Gaining maximum yield and benefit with optimum use of nutrients source is the common objective of the growers worldwide. Most of the nutrient element are soil applied whereas few are applied on the foliage. Soil application needs higher dose and is more often and most effective for the nutrients (Fageria et al. [1]). However there are few circumstances that foliar application of nutrient is more economic and effective. Application of soil fertilizers is done on the basis of soil test where as foliar application is done on the basis of visible cues or detailed plant tissue examination. So correct diagnosis of the nutrient deficiency is the fundamental for the successful foliar fertilization (Fageria, et al. [1]). Moreover some peculiar traits which are required for foliar application of nutrient elements are higher leaf area index so as to absorb nutrients elements instantly. The nutrient elements should be applied more than once based on the severity symptoms. Highly soluble fertilizer can be applied in the optimum temperature and sunshine avoiding leaf burning. Foliar application of the fertilizer can complement to the soil application. Such foliar application can be sprayed in combination with insecticides, postemergence herbicides or fungicides with increased the net benefit by reducing the cost of application (Fageria, et al. [1]). Moreover multiple nutrient elements such as Fe, Zn and Cu can be mixed and sprayed together which saves both time and money (Bhantana, et al. [2]).
The growth and development of plant is enhanced by effective application of proper amount of nutrient in the root zone. And adverse effect on plant growth and development is appeared due to failure to apply balanced fertilization. So not only Zn but also each and every nutrient required for balanced fertilization i.e. an application of macro and micro nutrient elements such as N, P, K, Ca, Mg, S, Fe, Mn, Zn, B, Mo, Cu, Cl, Ni etc in proper amount (Kumar, et al. [3]). Zn is an important micronutrient for plants. Zinc in soil and plant nutrition is becoming major concern over the more than forty different countries worldwide (Alloway [4]). Some examples of soil which are deficient in Zn are calcareous soil, sandy soil, tropical weathered soil, saline soil, waterlogged soil and heavy clay soil etc. (Alloway [4]). In the soil solution there is decrease in Zn by 30 fold with each unit increase in pH from 5- 7. When soil pH is higher than 8 the zinc bound more strongly causing poor availability of the Zn in soil solution (Cakmak, et al. [5]). Heavy fertilization with nitrogen is reported to have Zn deficiency in citrus of Florida. This is because that the application of nitrogen increases tissues numbers and sizes and eventually increases Zn hunger, the dilution effect. Similarly nitrogenous fertilizer increase acidity in the soil which increases Zn availability (Swietlik [6]). So a study of physiological response of Zn on fruit yield and quality parameters is taken for this study. Lack of Zn supplementation in daily diet is the major issue for the health of the global citizen (Bhantana et al. [2]). In the present scenario more than 1.1 billion people are suffering from lack of Zn nutrition (Kumssa, et al. [7]). Zinc can be applied to the soil or foliage respectively. There is a huge gap between the Zn supply and Zn requirement. Combined application of both soil and foliar application of Zn is practiced from the time ahead to minimize the gap (Bhantana et al. [2]). Inadequate supply of Zn in human food cause to lead several symptoms. Major symptoms of the Zn deficiency are growth retardation, delayed sexual and mental development, eczema and hair loss (Barokah, et al. [8]). And it is also reported that about 300 proteins in the human body are Zn dependent (Krezel, et al. [9]).
Some agronomic, breeding and biotechnological aspect of biofortification are essential to acquire the diversification of food. Monoculture is the key aspect of the reduced Zn fortification to the crop and their final product. Similarly people in the developing countries are highly dependent on plant based food rather than animal based diets (Cakmak, et al. [5]). A gap between daily requirement (40-50 mg Kg-1) and supplement (20 mg Kg- 1) is observed (Cakmak, et al. [5]). This is how an agronomic biofortification of cereals and fruits needs to be done. In this study both crop hunger with Zn and Zn hunger for food for the humans is addressed. In citrus orchard Zn is the most frequently occurring nutritional disorder. This is how two conventional used methods soil and foliar application are concurrently practiced. After N, Zn is the most widespread nutritional element frequently threatening the citrus industry. Both flowering and fruit set are affected by the Zn fertilization. Superiority of foliar application over soil application increase the fruit number and weight (Srivastava [10]). So both the methods and amount of application of Zn pertains importance over citrus quality and production (Razzaq, et al. [11]). Use of foliar spray with 0.6% increase tree height, crown width and stem girth. Also fruit diameter, fruit weight, vitamin C and total phenolics is increased in treated plant than untreated (Razzaq, et al. [11]). Hence the use of soil or foliar application solely in agreement to the field condition is practiced in this research. This is how this project is specially focused to deal with crop hunger and human hunger for the Zn.
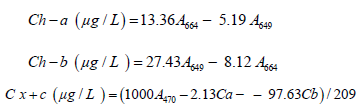
The research was carried out in the Huazhong Agricultural University (HZAU; 30°28′26″N, 114°20′51″E), Wuhan, China. A study on the response of foilar cum soil biofortification of Zn on citrus trees was done in the two varieties namely Wenzhou and Nanfeng in the five year old orchard. Similarly the SPAD (Soil Plant Analysis Development) value of the five leaves per tree were measured as described in the (Ling, et al. [12]). Twenty seedlings of ‘Wenzhou’ and ‘Nanfeng’ each were planted in the plant nutrition research block in the year 2014. The treatment consisted of three different levels of Zn application. The three different concentrations of foliar Zn application were 0, 0.5 and 1.0 percentage and the three different concentration of soil applied Zn were 0, 40 and 80 g/tree. Chlorophyll concentration, including Chlorophyll A, Chlorophyll B and caretenoids were measured by treating with 95% ethanol based on the following equation with spectrophotometric observation (Sumanta, et al. [13]).
Similarly the data on SPAD was measured on three different dates 13 May 2019, 10 June, 2019 and 20 July 2019. For the determination of NPK concentration in plant samples, plant samples were dried in forced air oven at 70oC to constant weight. Grinding and sieving of dried samples were done through 0.5 mm screen. 0.12g of finely grounded samples were mixed with 5ml of sulphuric acid (H2SO4) and wait for 12 hour for digestion. Then the samples were digested in digestion system of fume hood. The samples were heated to 180oC for 3 hour with addition of H202. After fully digested samples to clear white are transferred to 50 ml volumetric flask and dilute to 50 ml with deionized water. The Barbano and Clark 1990; method is used for the determination of N by using Kjeldahl apparatus. Similarly, colorometric method (Lu, [14]) was used to determine the concentration of P after digestion of the plant samples in H2SO4-H2O2. Moreover flame photometric technique was used for the determination of K in plant samples after the samples were completely digested in H2SO4-H2O2. The digested solution were distillated, filtrated and transferred to 50 ml volumetric flask and diluted to 50 ml with deionized water. The Zn in plant tissue in this study was determined by DTPA (Diethyltriamine pentaacetic acid) extraction-atomic absorption spectrophotometer method as described in (Katyal, et al. [15]). Similarly the vitamin C was measured by titration with 20% oxalic acid as quoted in (Najwa, et al. [16]) and hand held refractrometer was used for the measurement of total soluble solids as described in Echeverria, University of Florida, IFAS. Similarly titrable acididty was measured by titration of fruit juice with NaOH as described in the (Islam, et al. [17,18]).
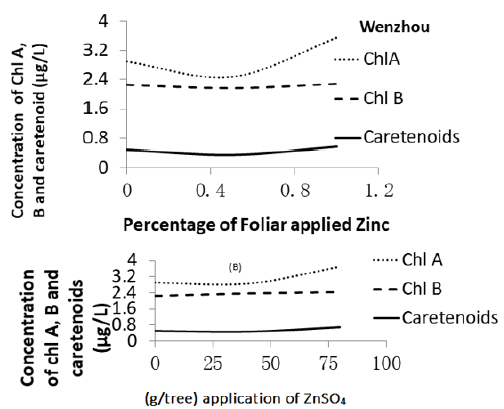
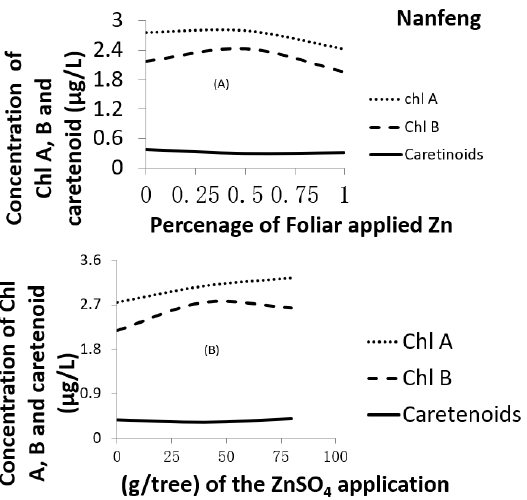
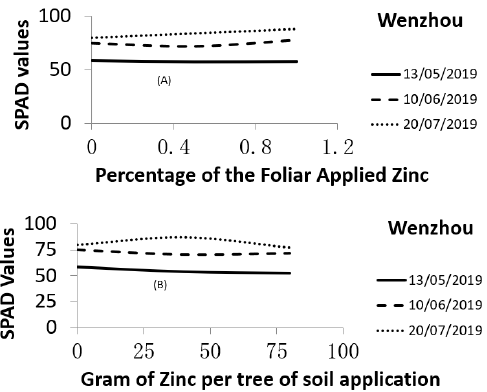
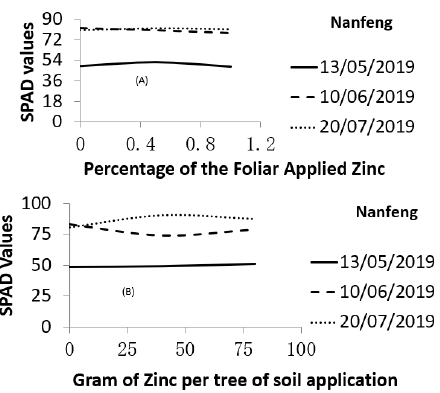
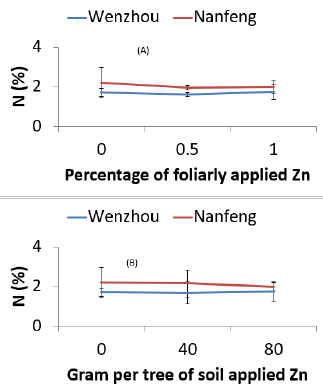
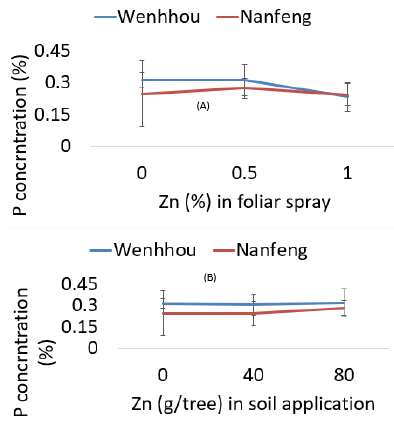
The determination of chlorophyll A, chlorophyll B and caretenoids of the variety Wenzhou are shown in the –(Figures 1A-1B)) with foliar spray of 0, 0.5 and 1 percentages and soil application of 0, 40 and 80 g/tree ZnSO4 respectively. In both figure Chlorophyll A is appeared on the top, Chlorophyll B in the middle and caretenoids in the bottom. Similarly, the determination of chlorophyll A, chlorophyll B and caretenoids of the variety Nanfemg are shown in the (Figures 2A-2B)) with foliar spray of 0, 0.5 and 1 percentages and soil application of 0, 40 and 80 g/tree ZnSO4 respectively. Again in the both figures Chlorophyll A is appeared in the top, Chlorophyll B in the middle and caretenoids in the bottom. The concentration of chlorophyll A, chlorophyll B and caretenoids in Wenzhou and Nanfeng as expressed in μg/L showed similar results. The data on soil plant analysis development (SPAD) is shown of in the Figures 3 & 4. The data were recorded in three different dates 13-May, 10-June and 20-July 2019 respectively. More mature the leaf the higher the reading of the SPAD. These SPAD values were arranged in ascending order 13-May, 10-June and 20-July. Besides the SPAD values in two varieties of citrus was observed similar. Also it appeared that the SPAD values observed similar with foliar application 0, 0.5 and 1 percentages and soil application of 0, 40 and 80 g ZnSO4 per tree (Figures 3 & 4). In most of the cases on an average the value of SPAD varied between 40-85. There is no distinct variation in SPAD values with foliar application of ZnSO4 0, 0.5 and 1% and soil application of ZnSO4 0, 40 and 80 g/tree respectively. Based on the chlorophyll measurement (Figures 1 & 2) and SPAD value (Figures 3 & 4) and that there is not a significant variation in Wenzhou and Nanfeng. Similarly there is no difference between foliar application and soil application of ZnSO4 in this attributes. Percentages of N, P, K with application of Zn as foliar spray or soil application is shown in the (Figures 4A & 4B)) of the respective (Figures 5-7) respectively. The concentration of nitrogen is higher in Nanfeng than Wenzhou in the parameter N in the study (Figure 5). Conversely the parameter Wenzhou is higher than Nanfeng in the parameter P study (Figure 6).
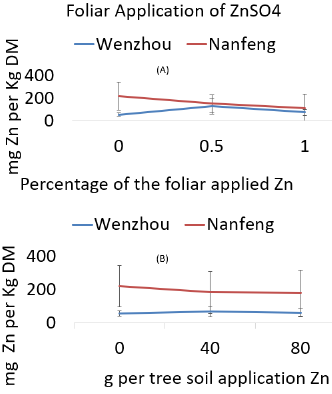
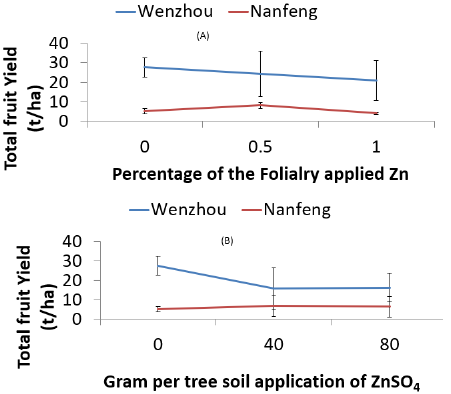
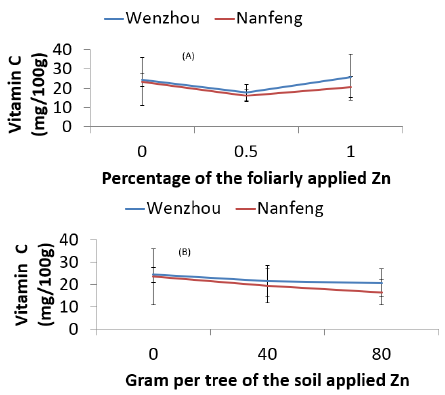
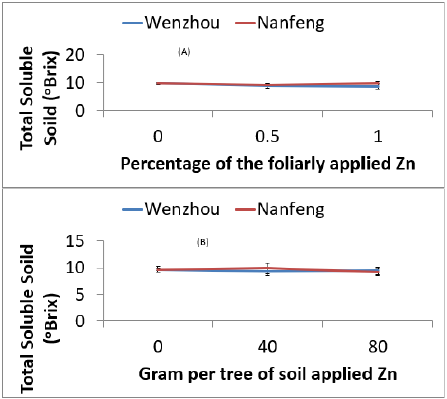
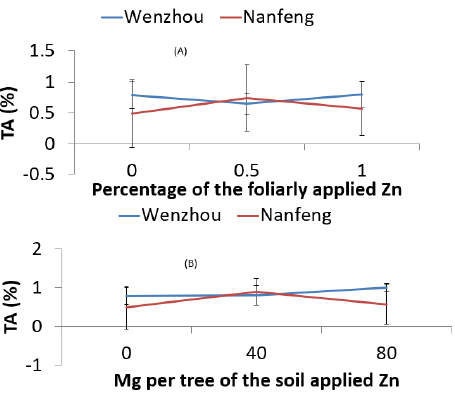
Moreover an interaction between Wenzhou and Nanfeng is observed in the (Figure 7) with percentages of K application. When the values of Nanfeng is higher the Wenzhou is lower and vice versa. As shown in all the figures from (Figures 1 & 7) that there is no significant difference in between Nanfeng and Wenzhou varieties. Similarly, the mg of Zn per Kg DM is shown in the (Figure 8). Both in the foliar application and the soil appliation, the Zn content in the Nanfeng is higher than Wenzhou. In the (Figure 8), it seemed a weak interaction between these two varieties for the parameter Zinc concentration. At zero concentration the Nanfeng has higher value of Zn supply than Wenzhou and other higher concentrations for example at 0.5 and 1 percentages of the foliar spray or 40 and 80 g/tree of soil application of ZnSO4. Likewise total fruit yield t/ ha is shown in (Figure 9). The fruit yield varied between 30-10 t/ ha in Wenzhou and it varied between 10-5 t/ha in Nanfeng. Also the vitamin C content in relation to the soil and foliar application in the foliar versus soil application of Zn is shown in the (Figure 10). However the analyzed data are not significant the value of vitamin C is higher in case of the variety Wenzhou than Nanfeng. It is observed that at zero concentration of foliar application of ZnSO4 and at Zero concentration of soil application the vitamin c amount is higher than other amount. Even more the total soluble sugars (TSS) is presented in the (Figure 11). The data are not statistically significant the presented values are similar with the application of foliar or soil applied Zn. Last but not the least another parameters for the study of Zn response is titrable acidity (TA). There is interaction between two varieties for the TA. In the variety Nanfeng there is higher value of TA with application of 0.5% foliar applied Zinc and 40 g/tree application of ZnSO4. In the variety Wenzhou the response soil cum foliar application in TA of Zn is the straight line (Figure 12).
Micronutrient like Zn plays pivotal role in the growth and development of plant and occupy an important position due to its essentiality (Dewal, et al. [19]). Even more the role of Zn in plant nutrition and increasing soil productivity increase the importance greater. With regards to increase cropping intensity, intensive cropping with high yielding crop and their varieties even increasing the importance of the micronutrient like Zn in agriculture (Dewal, et al. [19]). The present era farming is highly focused to top yield and quality so the attempt has to be paid for the application of Zn. An emphasis in soil or foliar application or combined application of Zn enhanced plant growth, grain yield and the components of grain quality. Zn is an essential attribute of the plant hormones, green chlorophyll and cytochrome (Dewal, et al. [19]). Similarly Zinc is one of the key nutrient element for the growth and production of plant. It helps in the production of chlorophyll pigment in the crop. There are instances to which production of chlorophyll, caretenoids and increase in yield and quality is achieved by application of Zn (Kandoliya, et al. [20]). For example increase in the chlorophyll is achieved at 45 and 70 days after sowing (DAS) (Kandoliya, et al. [20]). Not only foliar application also soil application of Zn increase the grain yield, protein and gluten content of wheat. This is due to increased photosynthesis with the help of increasing leaf pigment and enhanced mineral nutrition (Kandoliya, et al. [20]). The highest Zn content in straw and grain is recorded in chelated Zn treatments. Regarding plant nutrition content the chelated Zn appeared highest than the soil application. Similarly, the use of foliar spray increased the fertilizer use efficiency and wheat nutrient content (Kandoliya, et al. [21]).
But in this research as shown in Figures 1 & 2, the chlorophyll A, Chlorophyll B and Caretenoids did not differ in relation to soil and foliar application of the nutrients. Both variety used in the study showed similar response for the chlorophyll A, chlorophyll B and caretenoids (Kandoliya, et al. [21]). SPAD stands for the soil plant analysis development. SPAD is a hand held device used for the rapid, accurate and non-destructive measurement of leaf chlorophyll concentrations. SPAD is used extensively both in the research and agricultural operation with a range of plant species (Ling, et al. [12]). There are a number of scientific papers published in the area of using SPAD measurement (Uddling, et al. [22]). The SPAD meter (Konica- Minolta, Japan) provides alternative to the data provided through the destructive measurement of ethanol based formulation of leaf chlorophyll as shown in the Figures 1 & 2. This alternative method accounts for overcoming the disadvantages of leaf chlorophyll measurement. SPAD is a tool not very expensive, hand held device based on two light-emitting diodes. Measurement of a silicon photodiode receptor with the measurement of leaf transmittance in the red 650 nm wavelength and 940 nm. The transmittance values are used to derive the relative SPAD meter value are in between 0-50 which is proportional to the chlorophyll concentration in the leaf sample (Uddling, et al. [22]). But in our case the SPAD values varied between 40-80. The recording of the SPAD value differed by the age of the leaf, solar radiation, time of the day, cloudiness etc. Leaf chlorophyll concentration is an important parameter that frequently measures as an indicator of chloroplast development, nitrogen content, photosynthetic capacity or plant health. As mentioned in the (Figures 1 & 2), leaf chlorophyll is destructively quantified in the laboratory. Leaf chlorophyll concentration is an important parameter which correlated with SPAD readings in this study. So in vivo measurement of chlorophyll by SPAD should be focused. Yield and quality of the citrus fruit are subjected to balanced fertilization. New shoots in citrus are correlated with fruit yield. Citrus leaves accounts for 21% and 31-44 % of the above ground biomass and above ground nutrients respectively (Roccuzzo, et al. [23]). Earlier study showed distribution of N in different parts of the citrus such as shoots, leaves and fruits (Roccuzzo, et al. [24]). Measurement of the top shoot leaf nitrogen prior to start of the experiment is 1.72% (Wenzhou) and 2.11% (Nanfeng) (Unpublished data). Similarly in the study after application of Zn varied in between 1.18 to 2.25 in both of the varieties either with the application of foliar nutrition or soil. Mineral nutrients composition in the citrus fruits is optimized by application of balanced nutrition. Concentration of nutrients in citrus fruit varied with amount of N(52.70–71.4%), P (66.5–80.4%) and K (68.9–85.9%) (Fan, et al. [25]).
Furthermore, the nutrient requirements per unit of newly developed shoots and fruits were gradually decreased and increased. These information is useful for the pruning and fruit thinning of the citrus orchard (Fan, et al. [25]). Moreover, the concentration of N and K is increased highly in the citrus fruit. Whereas the P is required for the tree growth (Zambrosi, et al. [26]). As presented in the (Figure 5). the concentration of N is higher in the variety Nanfeng in comparison to Wenzhou. The value of N percentage is significant at 0.5% of the foliar application than Wenzhou as shown in the (Figure 5A). In addition an alternate bearing is closely looked and the citrus tree fetched great amount of nutrition which is still unresolved (Martinez-Alcantara, et al. [27,28]. China is one of the key producers of citrus but still there is problematic situation due to low yield, excessive fertilization and alternate bearing. Practice of rational fertilization, quantification of new tissues, nutrient demand rules are suggested for the improvement. Moreover high and stable yield, and high citrus quality in citrus plantation can be achieved (Li, et al. [29]). Application of 180 lb N ac-1yr-1 is recommended to sustain optimal tree growth, maintain high fruit quality and production in the citrus orchard of the Florida (Alva, et al. [30]). The rate, placement and timing is essential to meet the proper application of the fertilizer. Also organic sources of nutrient for example the leaf litter can be incorporated as fertilizer. However the leaf analysis showed important parameter for the evaluation of nutritional status of the trees an identification of the nutrient budget is important. Measurement of nutrient budget is one of the way to the fertilizer recommendation for the nutrient uptake efficiency (Alva, et al. [30]). The composition of mineral nutrients for example N, P and K in the fruits varied from 1-1.19, 0.14-0.16 and 1.19 to 1.26 respectively (Alva, et al. [31]). The citrus production is higher than other tropical and subtropical fruits including Banana, Mango, Apple , Pear and Peach (Alva et al., 2006). China alone occupies the highest production of citrus fruit in the world (Li, et al. [29]). Citrus production is mainly suited to sandy to clay loam soil. Soil pH of 6.0 is optimal for citrus production however the pH value between 5.5-7.5 is also adequate based on the different rootstock (Alva, et al. [30]). China ranked the first in position to the production of citrus both in the area and yield.
Citrus is one of the key commodity fruit in terms of farmers income, industrialization, poverty alleviation and provides occupation to needy farmers in the south China mountainous region (Li, et al. [29]). Increment in the fruit quality parameters namely yield and quality, vitamin C, total soluble solids, TA, etc with increased application of N, P and K is recorded (Han, et al. [1]). Application of urea 1.75 Kg plant-1 affect the quality of citrus fruit increasing the content of invert sugar by 12.2% and by reducing the vitamin C by 13.3% (Li, et al. [29]). So it has been observed that application of P increase fruit yield but decrease total soluble solids (Obreza, et al. [32]). Despite the numerous attempts has been paid towards the application of N, P, K on citrus fertilization yields mainly depend on cultivar, age, climate and soil physiochemical properties. In Brazil increase application of P increase the yield of lemons (Obreza, et al. [32]). Increase in the size of the fruit and number are accredited to the increased yield in citrus fruit. Firstly balanced fertilization application increase the number of fruits per tree and secondly the increment in the fruit size is recorded (Li, et al. [29]). An speculation was made towards decrease in aluminium toxicity in the soil with an amount of surplus P fertilization (Nakagawa, et al. [33]). P amendment increase TSS in citrus fruit. Application of P increase the citrus yield and quality (Quaggio, et al. [34]). So application of P increase the yield of citrus by 32.6% with increase both in number and size of the fruit. But the mineral nutrients N and P do not have effect on TSS (Li, et al. [29]). Due to limitation of rootstock and plant growth; a high application for P uptake are desirable. So an experiment was designed for the application of 20, 40 an 80 mg Kg-1 P. Increased in the root growth, shoot growth, P nutrition by the uptake of greater number of other nutrients. In case of Rangpur lime there is increase uptake of P by 13-126%. So P use efficiency of citrus tree can be increased by applying the P in the deeper strata of the soil and use of better rootstock (Zambrosi, et al.
[26]). Potassium has important contribution in yield and quality of the citrus fruit. High amount of K application increase the fruit size and thick and coarse peel. Whereas low amount reduced the size of the fruit with thin peel (Alva, et al. [31]). Similarly the juice acidity is directly proportional to K concentration in the fruit. High acidity is caused by high amount of K and vice versa. Highly available K in soil enduce the uptake of some ions such as magnesium, calcium and ammonium ions (Alva, et al. [31]). The concentration of K in leaf tissue varied between 0.30 to 0.37% before initiation of the treatment (Data not shown). But after initiation of the treatment the value changes to 0.4 to 0.8% in the variety Wenzhou and Nanfeng respectively (Figures 7A & 7B)) in foliar cum soil application of nutrients.
These figures are quiet similar to the data observed in this study. In combined application of 1% urea and 0.8% Zinc sulphate in a every two week interval applied for six year increase the yield and quality of 15 year old apple trees. Increase in yield is solely due to the increase in the mean fruit size (Amiri, et al. [35]). The highest yield observed is 49 Kg/tree with the maximum fruit size (202g). Whereas the lowest yield recorded was 35 Kg/tree with the maximum fruit size 175 g (Amiri, et al. [35]). Lower record of the fruit in the control treatment is due to pre-harvest fruit drop and smaller size of the fruit. As shown in the (Figure 9A); in this study the fruit yield varied from 30 to 15 t/ha in Wenzhou and 5 to 15 t/ha in Nanfeng respectively in the foliar application. But in the (Figure 9B) with soil application of Zn fertilizer increased the yield in Wenzhou to 15-35 t/ha. These Figures also showed the fruit yield in the Nanfeng with foliar or soil application of Zn. The differences in the yield observed is varietal and has not any relation with the Zn application under both soil and foliar application. The concentration of P in top shoot samples prior to start of the experiment are 0.17 and 0.16% in the top shoots of oranges respectively (unpublished data). And in the current study the P concentration varied between 0.15-0.35% respectively. The amount of vitamin C quantified in the concentration of mg per 100 g of fruit is presented in the Figure 10. The vitamin C is measured with titration method. As shown in the Figures 10A & 10B, the vitamin C ranges from 10-25 mg/100 g of the fruit. According to the Najwa and Azrina, 2016, the vitamin C content of the orange, grapefruit, lemon, kaffir lime, lime and musk lime are 58.3, 49.15, 43.96, 37.24, 27.78 and 18.62 mg per 100g respectively. The finding of our research is below than the aforementioned value except in musk lime. However the different method used in the determination has different values for the vitamin C. The use of HPLC method is closely suited to our values as determined by (Najwa, et al. [36]). In the HPLC the 43.61, 31.33, 26.4, 22.36, 21.58 and 16.78 mg/100 g of orange, lemon, grapefruit, lime, kaffir lime and musk lime is observed respectively. Significant variation is observed in the study of vitamin C of samples by both methods. Both of the methods are suitable for the determination of vitamin C, however the HPLC method is more accurate, precise and specific (Najwa, et al. [36]).
TSS value as measured by the hand refractrometer is shown in the Figure 11. Similarly the value of TA is shown in the Figure 12 by titration with 0.1 N sodium hydroxide solution and phenolphthalein indicator (Suszek, et al. [37]). Total fruit yield ranges from 2.04 to 11.70 Kg/tree in the year 2009 and 5.52 to 32.94 Kg/tree in the year 2010 (Suszek, et al. [37]). Occurrence of drought spell in flowering and fruiting time may cause the difference in the yield. Smaller size of the fruit in the year 2009 cause lower yield. The average size of the fruit as observed was 323g and 310g respectively in the year 2010 and 2009 respectively. The value of TSS in the year 2009 is 6.23 to 8.65 oBrix and in the year 2010 is 6.18 to 9.11 oBrix (Suszek, et al. [37]). These values are close to the values presented in the (Figure 11). Similarly the value of titrable acidity (TA) as observed in this study is shown in the Figure 12. The TA value ranges from 0.53-0.99 % in the year 2009 and 0.40-0.71 % in the year 2010 (Suszek, et al. [37]). These values are in close connection with the data presented in the (Figure 12). Soil Zn concentration measured by DTPA method in mg per kg dry matter is 22.35 (unpublished data) before start of the experiment. This value is higher than the critical value of the Zn in soil. So the plant do not experience Zn deficiency in the treatment. As shown in Figure 9, the yield of two varieties as known as Wenzhou and Nanfeng under foliar as well as soil application of Zn do not differed each other. Symptoms of chlorosis is appeared in some instances but not so severe. So there is no significant difference in the foliar cum soil application of Zn in this study. Based on the feasibility farmers are recommended to choose foliar application Zn than soil application. Since there is not significant variation in the yield and yield attributing parameters in these two treatment in the citrus trees of Wuhan.
Zinc is not only an essential nutrient element but also a heavy metal. So, in spite of the ameliorating effect, Zn has a deleterious effect when applied in excess. This is how due care has to be paid for the successful incorporation of Zn in cropping system. Soil test values are required to judge the concentration of the Zn in soil. Similarly the evaluation of Zn in plant tissue are required. However Zn value differed from soil types, plants and their varieties and crop growth stages. The critical limit for the Zn concentration from the soil in Wuhan, China is 22.35 mg Kg-1. So attention has to be paid for successful incorporation of Zn in an agro ecosystem. In regards to the critical limit research has to be carried out more frequently to access the ground reality in connection with the published literature. Moreover fruit yield and quality like vitamin C, total soluble solids, titrable acidity etc are increased with the application of Zn in different crops grown. So the human demand for Zn and crop hunger can be satisfied (Krezel, A et al. [38]).