Tuesday, December 21, 2021

Effect of Methanol Leaf Extract of Blighia Sapida on Mitochondrial Membrane Permeability Transition Pore Opening and Blood Glucose Levels in Normal and Streptozotocin-Induced Diabetic Rats


Effect of Methanol Leaf Extract of Blighia Sapida on Mitochondrial Membrane Permeability Transition Pore Opening and Blood Glucose Levels in Normal and Streptozotocin-Induced Diabetic Rats

Introduction

Diabetes mellitus is a chronic endocrine disorder, characterized by hyperglycemia resulting from absolute or relative insulin deficiency. It is a condition characterized by an elevation of the blood glucose level. Insulin, a hormone produced by the pancreas, controls the blood glucose level by regulating the production and storage of glucose. The etiopathogenetic categories of diabetes mellitus are type 1 diabetes mellitus and type 2 diabetes mellitus. In type 1 diabetes, the β cells of pancreas produce inadequate amounts of insulin due to tissue wastage (autoimmune β-cell destruction) as a consequence of excessive apoptosis [1]. Apoptosis in beta cells is orchestrated by environmental factors and genetically susceptible factors [2]. Apoptosis is a strictly regulated (programmed) device responsible for the ordered removal of superfluous, aged or damaged cells [3]. Inappropriate apoptosis (either too little or too much) is a feature in many human conditions including neurodegenerative diseases, ischemic damage, autoimmune disorders and many types of cancer.

Apoptosis in beta cells of the pancreas is a feature of type 1 diabetes. Apart from ATP generation, mitochondria have a prominent role in apoptosis initiation. The intrinsic or mitochondrial pathway of apoptosis is initiated by DNA damage and endoplasmic reticulum stress, which leads to permeabilization of the mitochondria outer membrane [4]. Mitochondrial permeability transition (MPT) pore opening disrupts the proton gradient of the inter membrane space configured by the electron transport chain of the inner mitochondria membrane, thus, uncoupling oxidative phosphorylation, rupture of the outer mitochondrial membrane, release of apoptogenic proteins such as cytochrome c, apoptosis inducing factor (AIF), endonuclease G and small mitochondrial dependent activator of caspase (SMAC) [5,6]. The release of cytochrome c into the cytosol triggers caspase activation and ultimately apoptosis [7]. Studies have shown that there is a link between mitochondrial permeability transition (MPT) pore opening and diabetes [8].

Diabetes-induced mitochondrial dysfunction subsequently causes increase in free radical production, impaired antioxidant capabilities and dysregulation of mitochondrial permeability transition pore (MPT) opening which are related to the onset, progression and pathological consequences of diabetes [9,10]. It is clear that the MPT pore plays an important role in modulation of intrinsic pathway of apoptosis and therefore serves as a pharmacological target to the development of drugs that target the components of the MPT pore [11]. Research has shown that certain bioactive agents present in medicinal plants elicit their chemoprotective and therapeutic effects through the induction or inhibition of the opening of the pore [12]. Blighia sapida (BS) is a medicinal plant used folklorically in the treatment of diabetes, but it is not known whether it could inhibit mitochondrial-mediated apoptosis and thus mitigate the excessive tissue wastage that is a hallmark of diabetes. This study was therefore designed to investigate the effects of methanol leaf extract of Blighia sapida (MEBS) on mitochondrial permeability transition (MPT) pore opening, ATPase activity and lipid peroxidation in normal and streptozotocin (STZ)-induced diabetic rat.

Materials and Methods

Chemicals and Reagents

Mannitol, sucrose, N-2-Hydroxy-ethyl-pipearizine- N-2- ethanesulfonic acid (HEPES), rotenone, spermine, Folin-Ciocalteau reagent, streptozotocin, Bovine Serum Albumin (BSA), and all other reagents were purchased from Sigma-Aldrich Chemical Co. (St. Louis, MO, USA) and were of the highest purity grade available.

Plant Material

The leaves of Blighia sapida were obtained from a local farmland in Ibadan, Oyo State, Nigeria. Botanical identification and authentication were done at the Department of Botany, Faculty of Science, University of Ibadan, Ibadan, Nigeria. The fresh plant was separated from extraneous materials and washed. The leaves were air dried for about two weeks and then blended to powder

Preparation of Extract

The powdered leaves were then soaked in Methanol for 72 hours. The filtrate obtained was concentrated using a Vacuum rotary evaporator (N-100, Eyla, Tokyo, Japan) and was later concentrated to dryness to yield methanol extract of Blighia sapida (MEBS) using a water bath at 37oC and the residues was transferred to a bottle and stored in a refrigerator until use.

Experimental Animals

Male Wistar strain albino rats weighing between 100–120g were purchased from the Preclinical Animal House of the College of medicine, University of Ibadan, Ibadan, Nigeria. All the animals were allowed to acclimatize for a period of two weeks in the Animal House of the Department of Biochemistry, University of Ibadan. The animals were placed under a 12hr light/dark cycle and fed commercial pelletized rat chow and water ad libitum throughout the experimental period. All experiments have been performed in accordance with the ethical standards laid down in the 1964 Declaration of Helsinki.

Animals Groupings, Treatment and Sample Collections

First Set: Thirty male Wistar rats were divided equally into five groups: Group A was the control group. Group B, C, D and E were treated with 50, 100, 200 and 400mg/kg MEBS respectively as a single dose daily by oral gavage for 28 days. One day after the final exposure, the animals were sacrificed. Blood was collected by cardiac puncture into plain sample bottles. Serum was prepared by centrifugation (3000rpm for 20 min) and used for the analysis.

Second Set: Twenty male Wistar rats were used in this study

a) Induction of Diabetes

Diabetes was induced by a single intraperitoneal injection of streptozotocin (STZ) (60 mg/kg) to overnight fasted rats. Animals with fasting plasma glucose concentration (FPGC)>300 mg/dL for 5 consecutive days were considered for this study using Accu-Chek glucometer (Roche diagnostics, Germany. The animals were divided and treated into various groups as follows:

Group 1: Non-Diabetic (control)

Group 2: Untreated Diabetic (STZ)

Group 3: Diabetic treated with MEBS (STZ+MEBS 100mg/kg)

Group 4: Diabetic treated with Glibenclamide (STZ+Glib)

Isolation of Rat Liver Mitochondria

Rat liver mitochondria were isolated essentially according to the method of Johnson and Lardy [13] and as modified by Olorunsogo et al. [14]. The animals were sacrificed by cervical dislocation and the livers excised and trimmed to wash excess tissue. The livers were then weighed, washed with homogenising buffer (210mM Mannitol, 70mM Sucrose, 5mM HEPES-KOH, pH 7.4 and 1mM EGTA), and homogenised as a 10% suspension in ice –cold buffer using a Porter Elvehjem glass homogenizer. The resulting homogenate was centrifuged in an MSE refrigerated centrifuge at 2300 rpm for 5 mins to remove the nuclear debris. This was done twice, and the supernatant obtained was centrifuged at 13,000 rpm for 10 mins to obtain the mitochondrial pellet. The supernatant was discarded while the pellet was washed twice with the washing buffer (210mMMannitol, 70mM sucrose, 5mM HEPES-KOH, pH 7.4, 0.5% BSA) at 12,000 rpm for 10 mins. The mitochondria obtained were immediately resuspended in an appropriate volume of MSH buffer (210mM Mannitol,70mM sucrose, 5mM HEPES-KOH, pH 7.4), and immediately dispensed into Eppendorf tubes and kept on ice.

Mitochondrial Swelling Assay

Mitochondrial membrane permeability transition was monitored by measuring changes in absorbance of mitochondrial suspension in the presence or absence of calcium (the triggering agent) in aT70 UV/visible spectrophotometer essentially according to the method of Lapidus and Sokolove [15] Mitochondria (0.4mg protein/ml) were preincubated in the presence of 0.8μM rotenone in a medium containing 210mM mannitol, 70mM sucrose and 5mM HEPES-KOH (pH 7.4) for 3mins at 270C prior to the addition of 120μM CaCl2. Thirty seconds later, 5mM succinate was added and mitochondrial permeability transition quantified at 540nm for 12mins at 30secs interval. To test the intactness of the mitochondria, 4mM spermine was added immediately following the addition of rotenone and just before the addition of mitochondrial fraction.

Determination of Mitochondrial Protein

Mitochondrial protein concentration was determined according to the method of Lowry et al. [16] using bovine serum albumin as standard.

Assesment of Mitochondrial FOF1 Atpase Activity

FoF1 Adenosine triphosphatase which was determined by the method of Olorunsogo and Malomo [17]. Each reaction mixture contained 65mM Tris-HCl buffer pH 7.4, 0.5mM KCl, 1mM ATP and 25mM sucrose. The reaction mixture was made up to a total volume of 2mL with distilled water. The reaction was started by the addition of mitochondrial suspension and was allowed to proceed for 30 mins at 270C. The reaction was stopped by the addition of 1 ml of a 10% solution of sodium dodecyl sulphate. The zero-time tube was prepared by adding the solution of ATP to the reaction vessel following the addition of sodium dodecyl sulphate. 2,4 Dinitrophenol (2,4 DNP) was used as a standard uncoupling agent.

Estimation of Inorganic Phosphate Released

The concentration of inorganic phosphate released following the hydrolysis of ATP was determined according to the method described by Bassir [18] and as modified by Olorunsogo and Bababunmi [14]. 300μl of each solution was dispensed into fresh test tubes, followed by the addition of 300μl of distilled water to each of the test tube. To this was added 1 ml of 5% ammonium molybdate and 1 ml of 9% freshly prepared solution of ascorbic acid. The tube was well mixed and allowed to stand for 20 minutes. The absorbance was read at 680nm.A water blank was used to set the spectrophotometer at zero.

Lipid Peroxidation

The lipid peroxidation was determined by the method of Varshney and Kale [19]. 0.4 ml of the test sample, 1.6 ml of Tris- KCl buffer and 0.5 ml of 30% TCA were dispensed into a test tube. This was followed by the addition of 0.5 ml of 0.75% TBA and the mixture placed in a water bath set at 80oC for 45 minutes. It was cooled, centrifuged at 3000 rpm for 10 min. and absorbance of the supernatant was measured at 532 nm.

Determination of Cytochrome c Release

The quantitative determination of cytochrome c released from isolated mitochondria was performed by measuring the Soret (γ) peak for cytochrome c at 414 nm (ε= 100 mM-1 cm-1), according to method of Appaix et al. [20]. Mitochondria (1mg protein/ml) were preincubated in the presence of 0.8μM rotenone in a medium containing 210mM mannitol, 70mM sucrose and 5mM HEPESKOH (pH 7.4) for 30mins at 270C in the presence of different concentrations of the fractions, using 24mM calcium as the standard (TA). After the incubation, the mixture was centrifuged at 15,000 rpm for 10 mins. The optical density of the supernatant was measured at 414nm which is the soret (γ) peak for cytochrome c.

Preparation of Immunohistochemistry Samples

Briefly, liver sections were immersed in 10% phosphate buffer formalin, dehydrated in graded alcohol and embedded in paraffin. Fine sections were obtained and mounted on glass slides. The method used in this study is Avidin Biotin Complex (ABC) method also referred to the Avidin biotin Imuunoperoxidase method. The antibody dilution factor used were 1:100 dilution for all the antibody markers.

Immunohistochemical Assays

Primary antibodies used in this study was cytochrome c, (Elabscience product). Immunohistochemical staining was performed according to the manufacturer instructions.

Tissue Preparation for Histopathology

Liver was used for histopathology. They were quickly removed and trimmed and were placed in 10% formalin for about five days for proper fixation, dehydrated by ascending grades of isopropyl alcohol for an hour. The dehydrated organs were cleared in xylene and transferred into two changes of liquid paraffin wax. The tissue sections were stained in Ehrlich’s hematoxylin for eight minutes, washed in tap water and dipped in acid alcohol to remove excess stain. These were counter stained in 10% aqueous eosin, incubated and mounted for photomicrography. The Histological pictures were taken with a Digital Microscope, VJ-2005 DN MODEL BIOMICROSCOPE ®.

Statistical Analysis of Data

Statistical analysis was performed using one-way analysis of variance (ANOVA). Level of significance was set at p < 0.05 and all the results were expressed as mean ± standard deviation (SD).

Results

As shown in Figure 1, there was no change in volume of mitochondrial respiring on succinate over a period of twelve minutes. On addition of calcium, which is a standard triggering agent, there was a significant induction of pore opening which was almost completely reversed on addition of spermine , a standard inhibitor. This shows that the mitochondria used in this study were intact and suitable for use. The Figure 2 shows the effect of varying concentrations of MEBS (10 to 90μg/ml) on MPT pore opening. The results show that there was no induction of MPT pore opening at all the concentrations tested in the absence of calcium. Furthermore, calcium-induced pore opening was reversed by MEBS at all the concentrations used in this study as depicted in Figure 3.

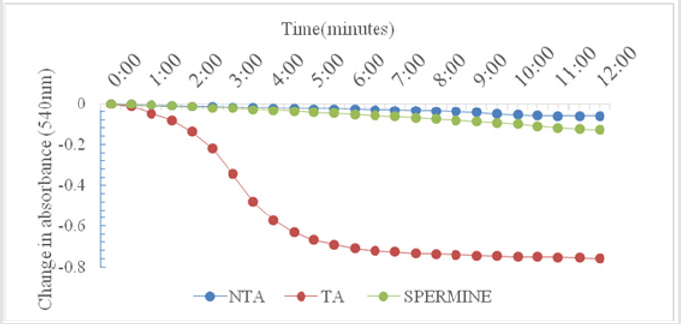
Figure 1: Calcium-induced mitochondrial membrane permeability transition pore opening in normal rat liver mitochondria and its reversal by Spermine.

NTA: No triggering agent TA: Triggering agent

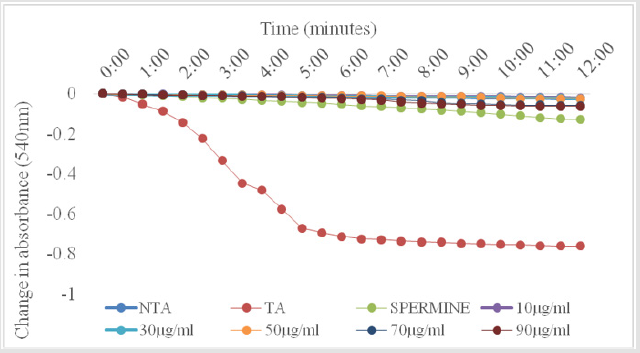
Figure 2: Effect of varying concentrations of MEBS on the MPT pore in the absence of Ca2+.

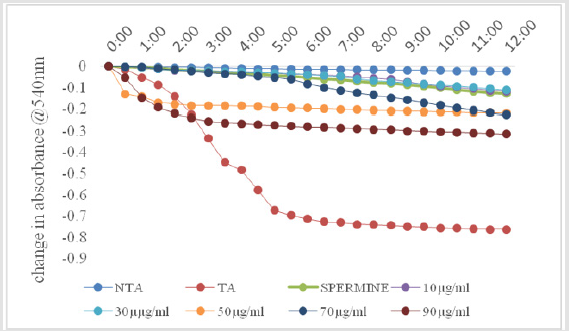
Figure 3: Effect of varying concentrations of MEBS on the MPT pore in the presence of Ca2+.

Figures 4 & 5 also show similar pattern of results in that varying concentrations of MEBS neither cause any release of cytochrome c nor enhancement of ATPase activity, respectively, at all the concentrations tested. Interestingly, at 50, 70 and 90μg/ml, there was significant inhibition of cytochrome c release and at 70 and 90μg/ml, the enhancement of ATPase activity was significantly reduced when compared with the control as shown by Figures 4 & 5, respectively. Table 1 shows the blood glucose level (mg/dl) in normal and streptozotocin-induced diabetic rats when treated with MEBS and standard drug, glibenclamide. There was no significant elevation of the blood glucose level of the non-diabetic control rats from the beginning to the end of the experiment. In the diabetic untreated group (STZ only), there was significant increase in the blood glucose level after 72 hours of STZ injection. The increase from 87.3±7.4 to 340.6±10.9 mg/dl was recorded after 72 hours, 379.8±11.2 mg/dl was recorded after 2 weeks of STZ injection while 429.7±15.1 mg/dl was recorded at the point of sacrifice.

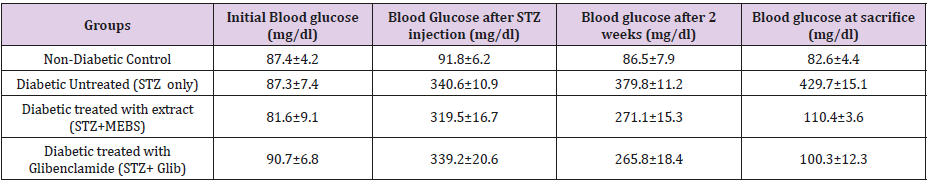
Table 1: Effect of methanol leaf extract of Blighia sapida on blood glucose level (mg/dl).

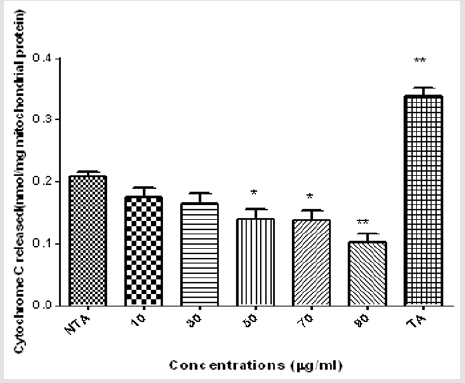
Figure 4: Effects of varying concentrations of MEBS on Cytochrome c release.

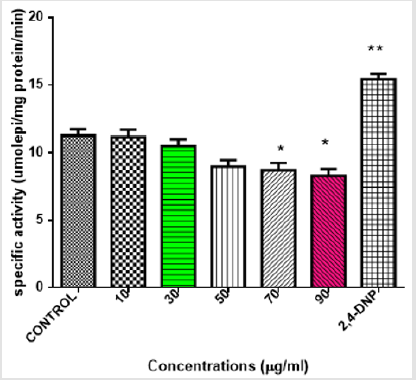
Figure 5: Effects of varying concentration of MEBS on mitochondrial ATPase activity.

In the diabetic group treated with extract, (STZ+MEBS), the blood glucose level after 72 hours post STZ injection was 319.5±16.7 mg/dl. This level was remarkably decreased to 271.1±15.3 mg/dl after 2 weeks of treatment with MEBS and the decrease was more significant after 4 weeks as it was lowered to 110.4±3.6 mg/dl. Similar pattern was recorded in the STZ group cotreated with glibenclamide. The glucose level (339.2±20.6 mg/dl) , 72 hours post STZ injection was lowered to 265.8±18.4 mg/dl after 2 weeks of treatment and 107.3±12.3 after 4 weeks. Figure 6 shows the effects of oral administration of MEBS on MPT pore opening in STZ- induced diabetic rats after 28 days of treatment. Evidences emerging have linked mitochondrial pore opening with diabetes [8]. As shown from the graph, there was significant induction of pore opening (16.3 folds) in the diabetic untreated group (STZ only) when compared with the non-diabetic control. This induction of pore opening was significantly reversed in the diabetic group co-treated with MEBS (STZ+MEBS) to 2.1 folds compared with the non-diabetic control. The standard drug also shows significant reversal of pore opening to 5.5 folds relative to the non-diabetic control.

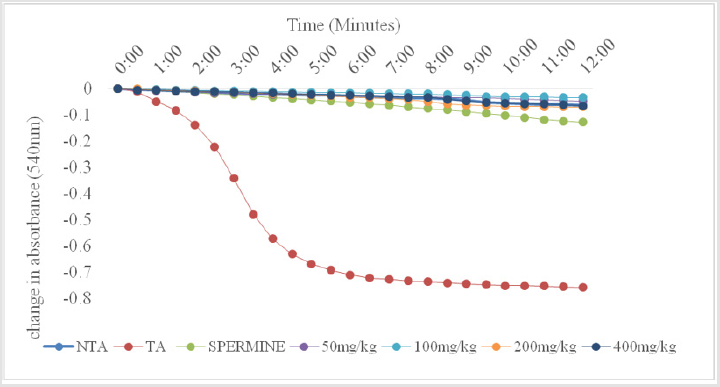
Figure 6: Effect of oral administration of MEBS on MPT pore opening in STZ-induced diabetic rats after 28 days of treatment.

The mitochondrial ATPase activity was significantly enhanced in the diabetic untreated group when compared with the nondiabetic control, however, this effect was significantly reversed in the diabetic group treated with MEBS and glibenclamide using 2,4, Dinitrophenol (2,4 DNP) as a standard uncoupler. There was no statistical difference between the non-diabetic control, diabetic treated with MEBS and diabetic treated with glibenclamide as depicted in Figure 7. The lipid peroxidation status in the diabetic untreated was significantly increased when compared with the non-diabetic control. This effect was also lowered in the diabetic group co-treated with MEBS and glibenclamide. There was no statistical difference between the non-diabetic control and the diabetic treated with MEBS and diabetic treated with glibenclamide (Figure 8).

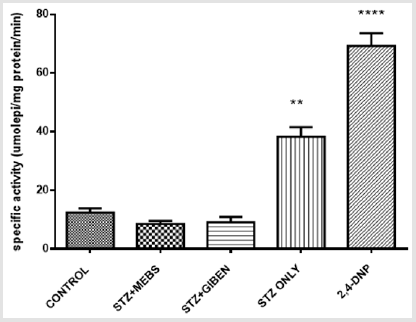
Figure 7: Mitochondrial ATPase activity in the normal, treated and untreated diabetic rats.

Abbreviations:

CONTROL: Normal Rats

STZ+MEBS: STZ –induced diabetic rats orally treated with MEBS 100mg/kg

STZ+Glib: STZ –induced diabetic rats orally treated with Glibb 5mg/kg

STZ ONLY: STZ –induced diabetes rats

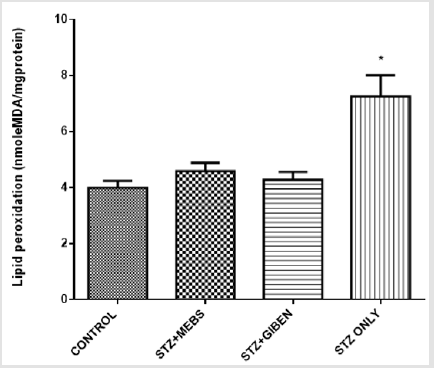
Figure 8: Lipid peroxidation status in the control, treated and untreated STZ-induced diabetic rats after 28 days.

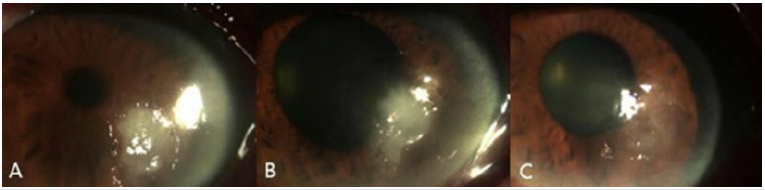
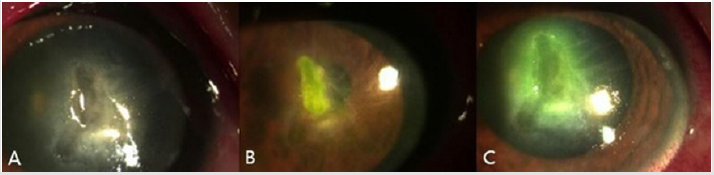
The findings from the immunohistochemical analysis of cytochrome c revealed that the hepatocytes of non-diabetic control showed negative expression of cytochrome c while the diabetic untreated (STZ only) showed a strong positive immunoexpression of cytochrome c. However, there was negative expression of cytochrome c in the groups co-administered with glibenclamide and MEBS, respectively as depicted in Figure 9. Also, the histological study showed gross lesion in the liver and pancreas of diabetic untreated rat. This was ameliorated by co-administration with MEBS. Similar result was obtained in the group co-administered with glibenclamide though there was congestion of vessel and sinusoid.

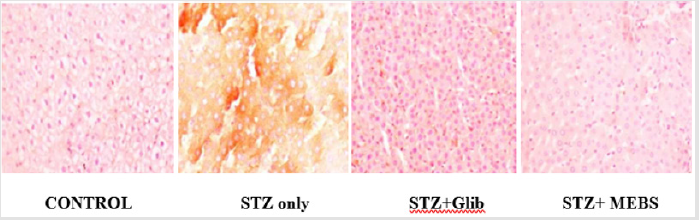
Figure 9: Immunohistochemical analysis of cytochrome c release in the liver of non-diabetic control, treated and untreated STZ-induced diabetic rats.

Discussion

Hyperglycemia affects the different stages in apoptotic signaling by increasing oxidative and nitrosative stress and also activating the proapoptotic Bcl-2 family proteins and caspase cascade [21]. Understanding that decreased beta cell mass is an important factor in the pathogenesis of diabetes, protection of beta cells against excessive apoptosis could be a therapeutic target for diabetes. The mitochondrial-dependent pathway of apoptosis via mitochondrial permeability transition (MPT) pore opening was investigated in normal and streptozotocin-induced diabetic rat. In the in vitro experiment, the mitochondrial intactness was established as the exogenous calcium induce the opening of the membrane permeability transition (MPT) pore, while spermine a potent inhibitor significantly reversed the Ca2+-induced pore opening. This indicated that the membrane integrity of the liver mitochondria was not compromised, hence, the mitochondria were suitable for use. The methanol extract of Blighia sapida did not induce the opening of the MPT pore at all the concentrations used. Similarly, there was neither the release of cytochrome c nor enhancement of ATPase activity by MEBS at all the tested concentrations. In fact, at 90μg/ml, there was significant inhibition of cytochrome c release and ATPase activity. Photomicrograph showing the histological changes in the liver of non-diabetic control, diabetic treated and diabetic untreated rats (Figure 10a-10d).

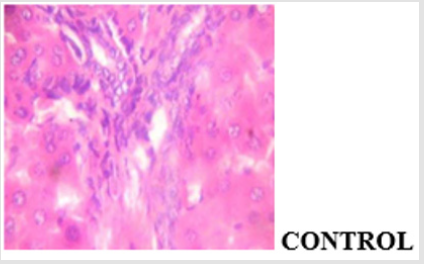
Figure 10a: Plates show no significant lesion.

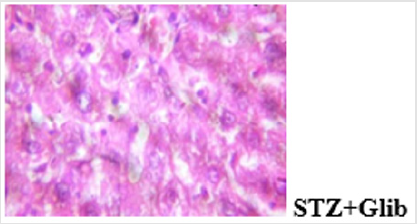
Figure 10b: Plates show disseminated congestion, multifocal area of thrombosis and disseminated periportal infiltration by inflammatory cells.

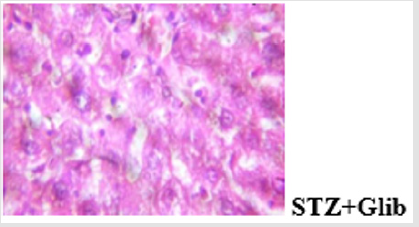
Figure 10c: Plates show disseminated congestion, moderate disseminated micro vesicular steatosis and very mild infiltration of zone 2 by inflammatory cells.

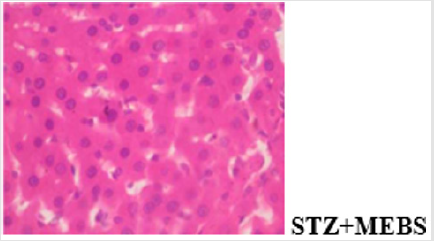
Figure 10d: Plates show mild disseminated periportal infiltration by inflammatory cells.

The results of the oral administration of MEBS at all the dosage used also show no induction of pore opening. This is probably suggesting that MEBS contains phytochemicals that cannot induce MPT pore opening and thus cannot cause the release of cytochrome c. The inhibitory effect noticed at 90μg/ml, suggests that the phytochemicals present in the plant might be relevant in cases where apoptosis needs to be inhibited or reversed. Since there was no induction in vitro and in vivo, and rather, there was inhibition at the highest concentration used, this instigated our curiosity to investigate the effect of MEBS in a diseased condition associated with tissue wastage as a result of excess apoptosis. Diabetes mellitus type 1 is a diseased condition associated with tissue wastage as a result of destruction of the beta cells of the pancreas thereby causing hyperglycemia. This diseased condition was mimicked in rat model by single intraperitoneal injection of 60 mg/kg streptozotocin. The blood glucose level was monitored and those that were diabetic were grouped into the diabetic untreated (STZ only), diabetic but treated with MEBS (STZ+MEBS) and diabetic but treated with glibenclamide which a standard drug is (STZ+Glib). The results on the glucose level as indicated by Table 1 shows that MEBS has the potential to ameliorate the hyperglycemic effect in STZ-treated rats. Photomicrograph showing the histological changes in the pancreas of nondiabetic control, diabetic untreated and diabetic treated rats (Figure 11a-11d).

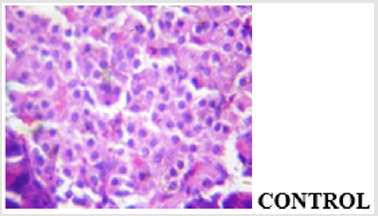
Figure 11a: The islet shows normal morphology.

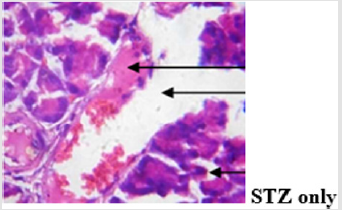
Figure 11b: Plates show marked disseminated congestion as well as thrombosis. The islets show vacuolation, desquamation and congestion, there is focal area of vacuolation of the exocrine acini while the ducts contain eosinophilic fluid.

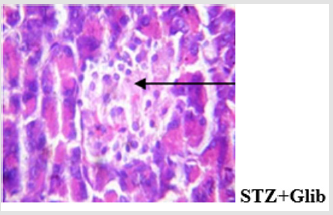
Figure 11c: Islets show mild desquamation and disseminated congestion.

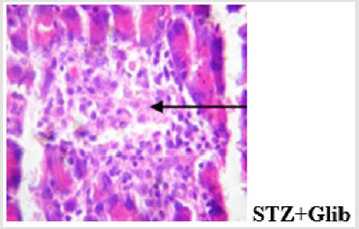
Figure 11d: Plates show disseminated congestion and focal area of very mild infiltration of the parenchyma. The islets show normal morphology.

The MEBS was able to reduce the blood glucose level from 319.5±16.7 to 110.4±3.6 mg/dl after the 4 weeks of treatment. This is statistically significant when compared with the untreated group which has glucose level of 429.7±15.1 mg/dl at the end of 4 weeks. Similar pattern of result was recorded in the case of glibenclamidetreated diabetic rats. The drug reversed the hyperglycemia from 339.2±20.6 to 107.3±12.3 mg/dl. Since type 1 diabetes has been associated with excess apoptosis of the beta cells, the effect of MEBS was further investigated on MPT pore status of the STZinduced diabetic rats. From the results, it was discovered that there was induction of MPT pore opening in the STZ-induced diabetic rats which was significantly reversed in the group co-treated with MEBS. This suggests that MEBS contains phytochemicals that can reverse or inhibit mitochondrial-mediated apoptosis and thus be relevant in situations where apoptosis needs to be reversed in inhibited like type 1 diabetes.

The glibenclamide too significantly reversed the MPT pore opening. When there is MPT pore opening, cytochrome c is released, and mitochondrial ATPase activity is enhanced. As shown in Figure 7, there was enhanced ATPase activity in the STZ-induced diabetic rats. This occurred as a consequence of the MPT pore opening that featured in the STZ-induced diabetic rats. From the same Figure 7, there was reversal of the ATPase activity in the group co treated with MEBS and glibenclamide respectively. This is because they reversed MPT pore opening and thus prevent the excessive apoptosis that could lead to tissue wastage which is a hallmark in type 1 diabetes. The results on the lipid status also show that the production of malondialdehyde in STZ-induced diabetic rat is very high when compared with the control, however, this was remarkably lowered in the group that receive co-administration with MEBS and glibenclamide respectively. This suggests that MEBS contains bioactive agents that might also be relevant in protecting against lipid peroxidation-induced damage or oxidative stress associated with diabetes.

The histological findings showed that MEBS contains phytochemicals that can protect against STZ-induced hepatocellular and pancreatic injury in rats as the gross lesion in the diabetic untreated rat was reversed in the group co-administered with MEBS. The result of the immunohistochemical analysis of cytochrome c showed that streptozotocin caused positive expression of cytochrome c while co-administration with MEBS showed negative expression. This shows that co-administration with MEBS prevented/inhibited the expression of cytochrome c. This result is in consonant with our in vitro result where MEBS did not cause any release of cytochrome c. This in vivo result on immunohistochemistry further confirms that MEBS does not cause the release of cytochrome c, it rather prevents the release. Blocking the release of cytochrome c prevents mitochondrial-mediated apoptosis.

In these findings, it can be concluded that streptozotocin induced hyperglycemia which was reversed by methanol extract of Blighia sapida (MEBS). Also, STZ induced MPT pore opening which was significantly reversed by MEBS. The cytochrome c which was positively expressed in diabetic untreated rats (STZ only) was downregulated in the group co-treated with MEBS. This shows MEBS to be an inhibitor of pore opening and thus inhibitor of mitochondrial-mediated apoptosis. It also shows that MEBS can reverse hyperglycemia which is characteristics of diabetes. Furthermore, the diabetic rat group treated with MEBS exhibited recovery from hepatic and pancreatic injuries. This could be due to the presence of antioxidants phytochemicals which might be present in the methanol extract. This study justifies the folkloric use of the plant in the treatment of diabetes. Though, the nature of substances responsible for the effects shown by MEBS are still unknown. Further work should be carried out in order to elucidate and characterize the structure of putative agent(s) present in MEBS and their effect on inhibition of mitochondrial-mediated apoptosis. This could be relevant in the management and treatment of diseases where there is need for downregulation of apoptosis.

Funding
This research did not receive any specific grant from funding agencies in the public, commercial, or not-for-profit sectors.

For more Articles on : https://biomedres01.blogspot.com/

Repetitive Transcranial Magnetic Stimulation in the Rehabilitation of Vascular Dementia. Report of 2 Cases

Repetitive Transcranial Magnetic Stimulation in the Rehabilitation of Vascular Dementia. Report of 2 Cases 

Introduction
Vascular Dementia (DV) is a clinical entity that encompasses a broad spectrum of cognitive disorders caused by Cerebrovascular Disease (CVD). The development of Transcranial Magnetic Stimulation (TMS) as a non-invasive study has enabled the study of the cerebral cortex to form a neurophysiological profile of DV. These studies have confirmed the existence of a pattern of cortical hyperexcitability probably related to the alteration of the integrity of white matter lesions due to cerebrovascular disease [1]. The prevalence of dementing syndrome in Latin America and the Caribbean is high, between 6.0 and 6.5 per 100 adults aged 60 and over. The annualized dementia incidence rate standardized for age is also high, with an estimated 410 938 new cases of dementia per year, which is associated with lower survival in relation to highincome countries. Of 3, 4 million people with dementia in Latin America and the Caribbean today, the figure will increase to 4.1 million for 2020 and 9.1 million in 2040, that is, it will be similar to that of North America.

Western Europe and North America, have the highest prevalences of dementia in the population of 60 years or older (7.2 and 6.9% respectively), followed by the Insular Caribbean (6.5%) and Latin America (6.0%). The prevalence of dementia per 100 adults over 60 years of age, the estimated number of people with dementia and new cases per year, as well as the proportion of increase in the next four decades and the total costs caused by dementias [2,3].

DV is reported as the second cause of cognitive impairment in the elderly, being surpassed only by Alzheimer’s Disease (AD), some studies report the superposition of both tables [4,5]. It has been shown that CVD risk factors, such as hypertension, atrial fibrillation, diabetes, hypercholesterolemia, atherosclerosis and the apolipoprotein e4 allele, increase the risk of AD [6,7]. The deficit in cholinergic neuronal markers and the decrease in serotonin metabolism observed in AD have also been associated with DV [8,9]. However, DV and EA can be distinguished clinically by the mode of onset and progression of cortical deficits. While memory and language deficits prevail in AD, executive function is more affected in DV, this has been associated with the interruption of frontal networks [10]. Changes in mood and personality occur earlier and are more severe in DV than in AD [11].

Transcranial Magnetic Stimulation (TMS) created as a neurophysiological noninvasive method for assessing the primary motor cortex and corticospinal tract, has changed its application and described the pulses in trains of TMS, are the principle of Repetitive TMS ( RTMS), an approach that can transiently influence the function of the stimulated areas of the brain, according to the frequency of stimulation. RTMS in recent years has been widely recommended in the treatment of neurological and psychiatric diseases [12,13].

In Mexico, a group of researchers have developed an EMT (Actipulse) team, which contributes to increasing the possibilities of neurorehabilitation in our patients. Given the novelty of this treatment, we present the result of the use of rTMS in the treatment of DV.

Case Report

Clinical Case 1

It is an 80-year-old female patient with a history of high blood pressure, for which she takes treatment. Go to consultation for a picture of dizziness that exacerbates the movements. He refers to the family that for months has come with behavioral alterations, incorporates stereotyped movements, repetition of sentences. Difficulty remembering names and recent events.

Figure 1: CT scan of the patient’s simple skull 1. Subcortical cortical atrophy and presence of leukoatrophy with dilation of the ventricular system in relation to subcortical ischemia.

The neurological examination presents discrete space-time disorientation, with Mini mental test 14 points. Presence of discinence in both hands. Light echolalia. CT scan of the skull with the presence of subcortical cortical atrophy, with increased volume of lateral ventricles due to leukoatrophy (Figure 1). Based on the clinical and tomographic findings, the patient was diagnosed with moderate mild Dementia secondary to cerebrovascular disease subcortical ischemia. After receiving information and consent from the patient, 40 rTMS sessions were applied, using the Dementia and Vascular Brain Disease protocol using the Actipulse equipment, developed in Mexico.

Evaluated the patient at 2 months, relatives report improvement of interpersonal relationships. It does not present language difficulties. Improvement of disorientation, with results of Mental MIni test of 21 points.

Clinical Case 2

Patient of 75 years, female, history of hypertension. No toxic habits. She refers family members who see her with memory problems for months. The places forget it. has been in recent weeks aggressive with family, isolated, does not speak, remains for hours in bed or sitting with indifference to the environment. Upon physical examination, attention is called to the presence of tremor of the hands and discrete hemiparesis of right hemisphere to brachial predominance. Mini mental test 12 points. CT scan of the skull with the presence of frontal parietal ischemic area.

Vascular Dementia is diagnosed in this patient and medical treatment is started. The rTMS protocol, the Dementia protocol and the cerebrovascular disease of the Actipulse team were started (Figure 2). Evaluation of the patient at 2 months, we see a patient who integrates into a family environment, performs household chores. Cooperating and socializing with their environment. Mini mental test 22 points.

Figure 2: CT scan of the simple skull of patient 2. A hypodense image is observed in relation to left-sided cerebral artery ischemic CVD, which affects the left parietal fronto region.

Discussion

RTMS has been described as a technique that interferes with cerebral Neuroplasticity (NP) with improvement of vascular sequelae [14-17]. Several publications have highlighted the effects of rTMS on NP, which may have a dual role in facilitating or inhibiting neuronal synaptic connections. Most of the clinic generated after the stroke is not due to the injury itself, but to the hyperactivity recorded in the intact hemisphere, which indirectly inhibits the injured. It is described that the low frequency rTMS (≤ 1 Hz) applied to the healthy hemisphere normalizes the diffuse cortical activation of the primary and secondary motor areas of both cerebral hemispheres, reactivating the injured cortical area that had been inhibited, favoring its excitability and motor recovery. However, high frequency rTMS (≥ 5 Hz) increases cortical excitability and can be applied to produce a neuronal stimulation of the cerebral cortex of the injured hemisphere. That is, rTMS accelerates NP mechanisms, reorganizing brain connections, which leads to greater efficiency of the interneuronal networks of the affected brain area [18-21].

EMT has been used in investigations of motor pathways, changes in corticocortical circuits after CVD and with special interest as a potential therapy that promotes reorganization and improves the response to conventional treatments [22]. The rTMS given its principles has potential in the reactivation of the cerebral stroke. Human studies show the potential of the cortical regions adjacent to the injured area that contribute to recovery by functional remodeling of the motor cortex representations. It has been reported that rTMS modulates neural excitability through its action on non-injured intracortical connections. Motor behavior after CVD is a primary objective of EMT interventions. There is a balance between the function of the two hemispheres, controlled by interhemispheric inhibition. The affected hemisphere may be altered by the CVD itself and by the unbalanced inhibition that the healthy hemisphere generates. In this model, the increased activity of the affected hemisphere promotes the recovery of the diseased hemibody and induces the decrease of inhibition from the healthy hemisphere. For example, it has been found that motor performance after ECV improves after inhibiting the healthy hemisphere with rTMS at a low frequency [23] or stimulating the affected hemisphere with rTMS at high frequency [24].

In attempting to exploit rTMS protocols as a therapeutic option for DV, a randomized controlled pilot study showed that a high frequency rTMS session applied to left DLPFC improved executive performance, whereas no effects were seen in any other cognitive function [25]. The excitatory and inhibitory electromagnetic pulses applied in the cerebral hemisphere ipsilateral or contralateral to the lesion, respectively, as well as at the transcallosus level to modulate cerebral interhemispheric communication, offer us the possibility of optimizing functional brain activity, as well as achieving a recovery of the area damaged The existence of impaired synaptic plasticity in the pathophysiology of vascular dementia suggests a role for rTMS as an adequate neurorehabilitation tool, this has been suggested in different publications [25,26].

Conclusion
In both cases of our patients we saw evident improvement after the use of rTMS. For the time being, the most adequate duration of treatment, the exact moment of intervention and the most suitable protocol are unknown. Surely in the realization of prospective studies, with larger samples of patients and longer follow-up times, it will allow us to obtain a higher level of scientific evidence, which allows us to clarify these doubts and thereby implement rTMS in the process of neurorehabilitation of the patient with acquired brain damage secondary to a stroke, without abandoning other physical and neurocognitive rehabilitation techniques.

For more Articles on : https://biomedres01.blogspot.com/

Effect of Anti-Inflammatory Eye Drops on Bacterial Keratitis

Effect of Anti-Inflammatory Eye Drops on Bacterial Keratitis 

Introduction
Bacterial keratitis is a severe infectious disease of cornea. Despite adequate antibiotic treatment, it is a serious disease that may cause a permanent visual loss due to corneal opacity, corneal neovascularization and corneal perforation ultimately leading to permanent visual impairment [1,2]. Cornea epithelial defect and infiltration of corneal stroma cause a range of symptoms including a visual loss, ocular pain, hyperemia, tearing, and glaring. The causes of corneal ulcers are ocular trauma, contact lens use, ocular surface disease, eyelid and eye surgery, HIV, immunodeficiency disease, and use of systemic steroids [3]. In a hospital study conducted in 2001, the incidence of bacterial keratitis in Korea has increased compared to the past. In addition, the proportion of women has increased and has changed to younger ages. This is due to the increased use of contact lenses in young women [4]. In bacterial keratitis, it is important to identify bacteria by microbial staining and culture to confirm sensitivity of antibiotics. Empirical broad-spectrum antibiotics should be used until obtaining results [5,6]. However, if the inflammation is not controlled despite the early treatment, the ulcer may lead to corneal opacity and vision loss. After treatment, best corrected visual acuity (BCVA) depends on the degree of inflammatory reaction and size and location of corneal ulcer [7].

In addition, if the visual acuity decreases due to corneal opacity and neovascularization after complete cure of the corneal ulcer, surgical treatment such as corneal transplantation or deep anterior lamellar keratoplasty (DALK) will be required. Anti-inflammatory treatment in bacterial keratitis is one of the useful methods to decrease corneal opacity, though it is still controversial, since it can delay the wound recovery and increase bacterial activity by inhibiting the local immune response [8-12] Aronson S et al. reported the use of high-dose topical steroids in 16 patients with bacterial corneal ulcers. Seven out of 16 had the final visual acuity of 20/60 or better Carmichael T et al. [13] carried out 18 months retrospective study which 40 bacterial corneal ulcer patients. Two groups were compared: one was treated with antibiotic only and the other with antibiotic plus steroid. There was no statistical difference in visual outcome between the two groups. However, the group which used the steroid, had better average cure rate and final visual acuity. In addition, there was no difference in the incidence of complications between the two groups [14]. Anti-inflammatory treatment is a relatively simple and economical treatment method that can reduce the corneal opacity and improve the final visual acuity. However, no comparison between the therapeutic effects of nonsteroidal anti-inflammatory drug (NSAID) eye drops and steroid eye drops has been reported. Therefore, we compare the recurrence rate and therapeutic effect of NSAID treatment and steroid treatment in bacterial corneal ulcer patients.

Materials and Methods

Between September 2017 and September 2018, 60 patients clinically diagnosed with bacterial keratitis at 00 university college of medicine were enrolled. This study was approved by the Institutional Review Board (IRB) of the 00 University college of medicine. Patients who did not want to be treated with antiinflammatory drops were treated with antibiotics. Randomized, double-masked study was conducted in patients who were treated with NSAID and steroid eye drop. Major exclusion criteria included corneal perforation or impending perforation, evidence of fungus on potassium hydroxide preparation, evidence of acanthamoeba by stain, evidence of herpetic keratitis by history or examination, use of a topical corticosteroid or systemic prednisolone during the present ulcer, previous penetrating keratoplasty. Corneal ulcer location was divided into three zones; it was considered ‘central’ if the ulcer was placed within 3mm from the center of the cornea, ‘peripheral’ if the ulcer was placed over 3mm from the center of the cornea and ‘paracentral’ if the ulcer was placed in the border. The size of the ulcer was obtained by multiplying X-axis of Y-axis that is perpendicular to X-axis. Clinically, when bacterial keratitis was suspected, corneal debridement was performed prior to antibiotic treatment. And microorganism staining and culture were performed to identify causative organisms and the sensitivity of antibiotics.

For all patients, Fortified Cefazolin 5% and Fortified Tobramycin 1.4% were used 8 times a day, and Atropine Sulfate 1% (IsoptoAtropine®, Alcon, Fort Worth, TX, USA) were used 3 times a day, and Hyaluronic acid 0.3% (Hyaluni®, Daejeon, Seoul, Korea) was used 8 times a day at first visit. Empirical antibiotic treatment was performed for at least 5 days before laboratory confirmation. BCVA, corneal epithelial defect, corneal infiltration and anterior chamber inflammation were re-evaluated every day while using empirical antibiotics. Additional anti-inflammatory treatment was carried out in patients who well responded to the antibiotic treatment and want to use. Bromfenac sodium hydrate 0.1% (Bronuck®, Daejeon, Seoul, Korea) applied 2 times per day for 4 weeks with antibiotics in NSAID group. Fluorometholone 0.1% (Flumetholon®, Santen, Osaka, Japan) applied 4 times per day for 1 weeks with antibiotics in Steroid group, then 3 times a day for 1week, and then twice a day for 1 week, and then once a day for 1 week. BCVA, corneal epithelial defect, corneal infiltration and anterior chamber inflammation were evaluated after the anti-inflammatory treatment to observe the adverse effect. When adverse effects such as aggravation of inflammation, increased epithelial defect, and decreased visual acuity were observed, it was considered as a recurrence and anti-inflammatory treatment was discontinued. Statistical analysis was carried out by chi-square test, Fisher exact test, ANOVA test. Two-way mixed ANOVA was used to compare the improvement of visual acuity. Statistical analysis was conducted using SPSS statistical program (version 18.0, SPSS Inc., Chicago, IL, USA) and P values <0.05 were considered statistically significant.

Results

60 patients were enrolled. 20 patients were treated with only antibiotics and 40 treated with anti-inflammatory drop. Twenty of the 40 patients were randomized receive NSAID eye drop, and 20 received steroid eye drop. Overall, enrollment characteristics were well balanced between three groups; sex, mean age, ulcer size, location, initial BCVA (Table 1). After 3-month, anti-inflammatory treatment groups showed significant improvement of BCVA compared to the group treated with antibiotics (p=0.045). Since there was no statistically significant difference between NSAID group and steroid group (Figure 1) (p=0.889). 3-month BCVA was log MAR 0.25±0.21 in antibiotics group, and log MAR 0.14±0.17 in NSAID group, and log MAR 0.18±0.32 in steroid group. NSAID treatment group showed lower recurrence rates than steroid group. However, there was no statistically significant difference between the two groups (p=0.332) (Figure 2). One eye (5.0%) of 20 eyes in NSAID group and 3 eyes (15.0%) of 20 eyes in steroid group showed re-aggravation of inflammation (Figures 3 & 4).

Table 1: Demographic data of patients about sex, age, study eye, ulcer area, ulcer location, visual acuity of previous treatment.

*Chi-square test, # ANOVA test

Figure 1: The BCVA at baseline and at 3 months after treatment. There was statistically significant difference in the improvement of visual acuity in both groups(p=0.045*) but there was no statistically significant difference in visual acuity improvement between the two groups (p=0.889*).

*Two-way mixed ANOVA

BCVA, best corrected visual acuity; NSAID, non-steroidal anti-inflammatory drug

Figure 2: Comparison of the recurrences between the NSAID eye drops treatment group and Steroid treatment group. NSAID treatment group showed lower recurrence rate but there was no statistically significant difference between the two groups (p=0.332*).

*Fisher exact test.

Figure 3: Anterior segment photograph of 42-years-old in NSAID group. (A) At presentation, corneal epithelial defect and infiltration at 5 o’clock. (B) After 4days treatment with antibiotics, epithelial defect almost healed and infiltration decreased. (C) 1monthafter anti-inflammatory treatment, 5 o’clock cornea lesion completely healed.

Figure 4: Anterior segment photograph of 63-years-old in steroid group. (A) At presentation, corneal epithelial defect and infiltration at center of cornea. (B) After 7days treatment with antibiotics, corneal infiltration and epithelial defects were decreased. (C) 2 days after anti-inflammatory treatment, size of the epithelium defect was increased and the corneal infiltration re-aggravation and anti-inflammatory treatment was stopped.

Discussion

Even with early and aggressive treatment, Bacterial keratitis may cause permanent visual loss by leaving corneal opacity. In addition to direct corneal damage by bacteria, the immune reaction to inflammation also weakens the normal structure of the cornea. T cells and macrophages react to bacteria to produce cytokines such as IL-1, IL-2 and Tumor necrosis factor, promoting neutrophil migration and degranulation [15]. In particular, the plateletactivating factor (PAF) can elevate metalloproteinase and cause more necrosis [16]. Immune reaction to these bacteria ultimately contributes to decreased corneal thickness and increased corneal opacity. Therefore, anti-inflammatory treatment has been used not only for bacterial corneal ulcers but also for herpes keratitis, corneal opacity and scarring after refractive surgery [17]. In addition, anti-inflammatory treatment can reduce angiogenesis of the cornea by reducing inflammatory factors such as prostaglandin, which cause vasoconstriction [16]. Anti-inflammatory treatment for bacterial corneal ulcers has been tried and discussed by many studies. Wilhelmus K. carried out meta-analysis for various studies from 1950 to 2000, but failed to conclude on the efficacy of topical steroid use in bacterial corneal ulcers [18] Stern G suggested that anti-inflammatory treatment for bacterial corneal ulcers should be combined with antibiotic treatment and that anti-inflammatory treatment should be initiated at a time when pathogens are identified or at least for a few days reacting to initial antibiotic treatment Srinivasan M et al. [19] conducted a clinical trial with 500 patients. Patients diagnosed with corneal ulcers used moxifloxacin 0.5% for 48 hours. Subsequently, anti-inflammatory group used prednisolone sodium phosphate 1% while the control group used placebo. After 3 months, there was no difference in BCVA, corneal wound size and corneal perforation ratio between the anti-inflammatory group and placebo groups.

However, the efficacy of anti-inflammatory treatment in patients with low initial visual acuity or ulceration at the center of the cornea was reported. In patients with visual acuity less than finger count, BCVA in the anti-inflammatory group was 1.7 line higher than placebo group at 3months after treatment. In the group with corneal ulcers located within 4 mm of the corneal center, BCVA in the anti-inflammatory group was 2 lines higher than placebo group at 3months after treatment [20]. Additional studies were reported for time of application of anti-inflammatory therapy. Patients who started anti-inflammatory treatment 2-3 days after antibiotic treatment, the anti-inflammatory group showed an average improvement of 1.7 lines better than the placebo group. However, there was no difference in visual acuity between the two groups in patients who started anti-inflammatory treatment after 3 days of antibiotic treatment [21]. In conclusion, anti-inflammatory treatment in bacterial keratitis is safer to initiate after 48 hours of adequate antibiotic treatment for patients with low visual acuity or corneal ulcer placed in the center of cornea. On the other hand, side effect of anti-inflammatory treatment may increase the bacterial activity and decrease the corneal thickness by melting the corneal parenchyma, which increases the risk of corneal perforation [22]. Animal studies have shown that when corneal injury is present, local steroid administration can reduce wound strength and delay corneal epithelial regeneration [23,24].

In addition, various side effects such as increased intraocular pressure, posterior capsular cataract, tear film instability and crystalline keratopathy have been reported [25]. Because of the possibility of these various side effects, the authors observed daily BCVA, intraocular pressure and slit lamp examinations for 3 days after the start of anti-inflammatory treatment. Thereafter, examinations were performed every week until the end of antiinflammatory treatment. In this study, there were no patients with corneal perforation and elevated intraocular pressure. But aggravation of inflammation was observed in one (5.0%) of 20 eyes with NSAID treatment group, and in 3 (15.0%) of 20 eyes with steroid treatment group. The mean incidence of complications higher than 6% reported by Srinivasan M et al. The high recurrence rate in our study is due to the small number of patients. The antiinflammatory treatment in corneal ulcer has several advantages. First, it is more economical to treat corneal opacity than the surgical method. Second, it is easy to apply and the patient compliance is high. Third, complications and recurrence rates are low. Fourth, improvement of final visual acuity after treatment can reduce the necessity of surgical treatment such as penetrating keratoplasty. Serious complications such as perforation, elevated intraocular pressure and worsening of inflammation are possible, but they can be prevented and treated through close observation after the initiation of anti-inflammatory treatment.

Conclusion
In this study, the authors compared the treatment effects of two anti-inflammatory eye drops, but there was no statistically significant difference between the two groups in the recurrence rate and degree of visual improvement. However, significant improvement in visual acuity was observed in both antiinflammatory treatment groups, and especially a lower recurrence rate was observed in NSAID treatment group. In conclusion, nonsteroidal anti-inflammatory eye drops in bacterial corneal ulcer is an effective treatment with equivalent effect on recurrence rate and visual improvement compared with steroid eye drops.

For more Articles on :
https://biomedres01.blogspot.com/

Monday, December 20, 2021

New Record of Long-Eared Hedgehog, Hemiechinus Auritus (Gmelin, 1770) in Sohag Governorate, Egypt

New Record of Long-Eared Hedgehog, Hemiechinus Auritus (Gmelin, 1770) in Sohag Governorate, Egypt

Introduction
Hemiechinus collaris is a burrowing and nocturnal species, recorded near water and agricultural landscapes Roberts [1] & Molur et al. [2] This species is useful indirectly to human being as it consumes insects, termites and scorpions. While H. collaris does not damage agriculture and lives on the edge of agriculture land or near desert and this species has no conflict with human. Long-eared hedgehog avoid high heat; strictly nocturnal in summer, emerging at dusk and feed for 5 to 6 hours Roberts [1]. They excavate their burrows; burrow entrance is covered under bushes and shrub; when ground is hard it may be less than one than one foot. In sandy and softer soil, the burrow may be more than 5 feet. The burrow leads to wider chamber, inside a small chamber Krishna and Parakash [3]. The burrow has sloped about one foot below the surface. H. collaris is unsocial species and does not share a burrow with the same species Roberts [1]. This species food is insects, insect larvae, lizards, birds’ eggs, cannibalism is also recorded in this species; female eat their own offspring; while adult eat their young hedgehog Prakash [4]. This species also attacked on the dangerous prey (i.e. venomous snakes) and eat them Krishna and Parakash [3] & Mirza [5]. Hemiechimus auritus is distributed in Libya, Egypt, Iraq, Israel, Lebanon, Syria, Turkey, USSR, Iran, India, Afghanistan, Pakistan, Mongolia, China. Colak et al. [6].

Materials and Methods

During the identification of rodents in Sohag Governorate, we noticed the presence of a hedgehog in Sohag District at the Village of Awlad Nasir - Naja Tarkhan at the north of the Sohag District about 2km. Samples were collected for breeding in the laboratory and identification. Identification of the hedgehog were done using different keys constructed by Anderson [7], Flower [8], Wassif [9], Setzer [10] and Osborn & Helmy [11, 12].

Results and Discussion

These animals were observed in the Village of Awlad Nasir - Naga Tarkhan, north of Sohag Governorate, at the period from afternoon to the sunset. Especially after the sunset because it’s activity at night. These animals appeared after the harvest period of the wheat crop in burrows under the piles of corn, sorghum & palm trees and on the sides of the agricultural canals, feeding on soil insects, grass and some pests. we transferred them to the agricultural animal laboratory for breeding and classified according to the different keys of the taxonomy in the animal kingdom as follows: (Figure 1).

Kingdom: Animalia

Phylum: Chordata

Class: Mammalia

Order: Erinaceomorpha (Insectivora)

Family: Erinaceidae

Genus: Hemiechinus

Species: Hemiechinus auritus

Common name: Long-eared hedgehog

Figure 1: Long-eared hedgehog (Hemiechinus auritus).

The results similar with Anderson [7], Flower [8], Wassif [9], Setzer [10] and Osborn & Helmy [11,12]. The long-eared hedgehog, Hemiechinus auritus was collected from Kawm El-Aaqula area, 15 km west of El-Burg. Two specimens were caught alive from their burrow under the vegetation, collected this hedgehog from Baltim and El-Burg. The sub specific status of this hedgehog is aegyptius. By the analysis of stomach contents, insects formed the only food item. So, it is recorded before, in the Nile Delta, but This research is the first record of long-eared hedgehog from to the south in Sohag Governorate (Upper Egypt). We suggest that more work and surveys should be done to know the distribution of all mammalian species in the region and their impact on the environment, whether useful or harmful.

For more Articles on : https://biomedres01.blogspot.com/


Near Chaos Graphic Images

Near Chaos Graphic Images 

Introduction
Chaos has emerged as a topic of study in the 21c [1]. The paper extends it to art practice. Interest in Robotic art and evaluation issues is current (News/Science) and runs parallel to the author’s research. It stems from a recent Ph.D, ‘Programmable Analogue Drawing Machines’ awarded by Manchester MIRIAD in 2011 [2]. This led to ‘Art by Machine’ [3] summarizing the research, and work covered in the author’s website [4]. Simple instructions leading to complex outcomes, was inspired by Turing’s work in the mid 20c [5]. Most recent work is into ‘near chaos’, concerns the philosophical implications of evaluation of machine-made images.
When further programming complexity is added to the drawing machine’s output it might be expected to make it less likely to achieve coherence in the images. Surprisingly the outcomes have been better than expected; coherent images including secondary patterns persist (Figure 1). Drawing machines, generating ‘near chaos’ images have a counter intuitive aspect. Unpredictable, inaccuracy might seem helpful, but the opposite is true. The basic machine must be deterministic, precise in line to line accuracy.

Figure 1: Structures of EGCG (1), and its glucoside derivatives (2, 3).

Many machines have been built able to create near chaotic outputs but in this paper the emphasis is on images produced by machine and evaluation issues arising from them. The analogue machines are complex; each one would fill a small paper. However, it is helpful to mention the mechanical actions crucial to creating a disruptive input which are a common feature of most machines. A fast pen-lift mechanism breaks up the continuous line into dots and dashes causing secondary patterns whilst a pen rotator and pen lift device is a feature of another machine (Figure 2). The latter is controlled by a sequential time output programmer. Of all the features employed the broken line via pen-lift is the principal contributor to the study of ‘near chaos’.

Figure 2: Effect of EGCG and EGCG derivatives on the proliferation of NSCLC cells. A. NCI-H1975 cells were treated with increasing doses of EGCG (1), EGCG-G1 (2) and EGCG-G2 (3) at the indicated concentrations for 48 hours. Cell proliferation was measured by MTT assay and expressed as the proliferation rate. B. H2O2 concentrations of EGCG (1), EGCG-G1 (2) and EGCG-G2 (3), tested using a H2O2 Quantitative Assay Kit (Water-Compatible).

Integral to both machines are sun and planet gearing systems generating complex mathematical curves. All the analogue machines employ multiple D.C. motors and linkages, which due to their inherent instability generate the essential component of quasi-randomness. This is a major factor in creating ‘near chaos’ effects. Finally, the platen, onto which the pen draws, influences the output. This can be a turntable, with either circular or elliptical motion or a horizontal movement. The difference with an identical programme is seen below in (Figures 3 & 4).

Figure 3: Effect of EGFR TKIs, EGCG derivatives or a combination of the two drugs on the proliferation of NCI-H1975 cells. A-F. gefitinib; erlotinib; lapatinib; icotinib; mubritinib and vandetanib (1μM) combinated with EGCG derivatives (EGCG-G1 and EGCG-G2) (30μM) with or withnot 10ng/mL EGF. Data represent the average of three independent experiments (mean ± SEM, p < 0.001). *** p < 0.001.

Figure 4: Combination of EGCG-G2 and grlotinib has synergized inhibitory effects on the phosphorylation the four members of the Her (ErbB) family in H1975 cells. NCI-H1975 cells were treated with EGCG-G2 (30μM), gefitinib (1μM) or EGCG-G2 plus gefitinib, after 12 hours, NCI-H1975 cells were stimulated with or withnot 10 ng/mL EGF for 5 minutes. The expression levels of the proteins were determined by western blotting with β-tubulin as the loading control.

Divisors

Intent, method and evaluation are three divisors often employed to discuss art works. This paper will only address the first and last, as a precis of the method i.e. analogue machines with D.C motors has been touched on in the introduction.

Intent

The original intent was to research how simple instructions may lead to complex outcomes in drawings made by programmable analogue drawing machines. A combination of determinism and quasi-randomness produced coherent non-figurative images where the selection criterion was based on aesthetic quality. When the focus of the research shifted towards exploring ‘near chaos’ the intent also altered. The programming was set to disrupt the drawing towards a ‘tipping point’ where the drawing almost became chaotic but just retained some coherence. The decision as to where the image was judged to be coherent is of course subjective. This aspect is examined in the evaluation section below. What is implied by this approach is to reduce the importance of conventional aesthetic criteria and simply concentrate on coherence. This in the author’s opinion is seen as a subtle but significant point. It resonates with views expressed by artists such as Paul Klee [6]. His phase “Taking a line for a walk” applies here perhaps.

The approach to examining intent and leading to evaluation issues is perhaps best dealt with by looking at a variety of images and offering comments on each. From 50 years research, the variety is wide ranging from simple drawings derived from Lissajous figures, sine waves and X:Y plotters to drawing with light exploiting color and tonality. Added color, via post production scanned work in Adobe Photoshop is another important aspect of the work where the color is used to highlight the character of the shapes drawn. When the attention was shifted to ‘near chaos’ it was seen that earlier work already had intimations of chaos which stemmed from the large element of quasi-randomness present in the design and programming. Some of these are shown, as it is felt that they have relevance to the topic. In some instances, an enlarged section of a drawing serves to emphasize the chaotic detail present (Figures 5 & 6). A recent addition is a double pen holder. The two-color drawing increases the chaos (Figures 7 & 8).

Figure 5: Transport of EGCG and EGCG-G2 across Caco-2 monolayers. TEER values were also measured to account for the integrity of the monolayer during the experiment. A. TEER values of Caco-2 monolayer (Ω·cm2). B. The transepithelial transport rate of EGCG and EGCG-G2 (50μg/mL) in the apical to basolateral direction. C. The transepithelial transport rate of EGCG and EGCG-G2 (50μg/mL) in the basolateral to apical direction. *** p < 0.001.

Figure 6: Structures of EGCG (1), and its glucoside derivatives (2, 3).

Figure 7: Effect of EGCG and EGCG derivatives on the proliferation of NSCLC cells. A. NCI-H1975 cells were treated with increasing doses of EGCG (1), EGCG-G1 (2) and EGCG-G2 (3) at the indicated concentrations for 48 hours. Cell proliferation was measured by MTT assay and expressed as the proliferation rate. B. H2O2 concentrations of EGCG (1), EGCG-G1 (2) and EGCG-G2 (3), tested using a H2O2 Quantitative Assay Kit (Water-Compatible).

Figure 8: Effect of EGFR TKIs, EGCG derivatives or a combination of the two drugs on the proliferation of NCI-H1975 cells. A-F. gefitinib; erlotinib; lapatinib; icotinib; mubritinib and vandetanib (1μM) combinated with EGCG derivatives (EGCG-G1 and EGCG-G2) (30μM) with or withnot 10ng/mL EGF. Data represent the average of three independent experiments (mean ± SEM, p < 0.001). *** p < 0.001.

The sine wave has been used in several machines as a basis for research and has been particularly useful when the broken line effect was present. The sinewave machine allows interactive control of the drawing as it progresses which can be useful in producing a drawing with a variety of characteristics (Figure 9). Adding color often helps to increase the variety and can move the image in a chaotic direction (Figures 10-13). A further device to alter the presentation is to invert a drawing post scanning. this can sometimes enhance the image character. Multiple pen holders may be used to add variety to the drawing (Figure 14).

Figure 9: Combination of EGCG-G2 and grlotinib has synergized inhibitory effects on the phosphorylation the four members of the Her (ErbB) family in H1975 cells. NCI-H1975 cells were treated with EGCG-G2 (30μM), gefitinib (1μM) or EGCG-G2 plus gefitinib, after 12 hours, NCI-H1975 cells were stimulated with or withnot 10 ng/mL EGF for 5 minutes. The expression levels of the proteins were determined by western blotting with β-tubulin as the loading control.

Figure 10: Transport of EGCG and EGCG-G2 across Caco-2 monolayers. TEER values were also measured to account for the integrity of the monolayer during the experiment. A. TEER values of Caco-2 monolayer (Ω·cm2). B. The transepithelial transport rate of EGCG and EGCG-G2 (50μg/mL) in the apical to basolateral direction. C. The transepithelial transport rate of EGCG and EGCG-G2 (50μg/mL) in the basolateral to apical direction. *** p < 0.001.

Figure 11: Structures of EGCG (1), and its glucoside derivatives (2, 3).

Figure 12: Effect of EGCG and EGCG derivatives on the proliferation of NSCLC cells. A. NCI-H1975 cells were treated with increasing doses of EGCG (1), EGCG-G1 (2) and EGCG-G2 (3) at the indicated concentrations for 48 hours. Cell proliferation was measured by MTT assay and expressed as the proliferation rate. B. H2O2 concentrations of EGCG (1), EGCG-G1 (2) and EGCG-G2 (3), tested using a H2O2 Quantitative Assay Kit (Water-Compatible).

Figure 13: Effect of EGFR TKIs, EGCG derivatives or a combination of the two drugs on the proliferation of NCI-H1975 cells. A-F. gefitinib; erlotinib; lapatinib; icotinib; mubritinib and vandetanib (1μM) combinated with EGCG derivatives (EGCG-G1 and EGCG-G2) (30μM) with or withnot 10ng/mL EGF. Data represent the average of three independent experiments (mean ± SEM, p < 0.001). *** p < 0.001.

Figure 14: Combination of EGCG-G2 and grlotinib has synergized inhibitory effects on the phosphorylation the four members of the Her (ErbB) family in H1975 cells. NCI-H1975 cells were treated with EGCG-G2 (30μM), gefitinib (1μM) or EGCG-G2 plus gefitinib, after 12 hours, NCI-H1975 cells were stimulated with or withnot 10 ng/mL EGF for 5 minutes. The expression levels of the proteins were determined by western blotting with β-tubulin as the loading control.

As seen above the nature of the pen unit can contribute to the expressive effects available in programming the drawing. The pen rotator unit is particularly useful where it may use with or without a pen lift action. Color is added to highlight the circular and linear blocks. Some near chaotic distribution of the circles is evident (Figures 15 & 16). Figure 17 is seen as one of the most successful recent images as it encapsulates the notion of ‘near chaos’.

Figure 15: Transport of EGCG and EGCG-G2 across Caco-2 monolayers. TEER values were also measured to account for the integrity of the monolayer during the experiment. A. TEER values of Caco-2 monolayer (Ω·cm2). B. The transepithelial transport rate of EGCG and EGCG-G2 (50μg/mL) in the apical to basolateral direction. C. The transepithelial transport rate of EGCG and EGCG-G2 (50μg/mL) in the basolateral to apical direction. *** p < 0.001.

Figure 16: Structures of EGCG (1), and its glucoside derivatives (2, 3).

Figure 17: Effect of EGCG and EGCG derivatives on the proliferation of NSCLC cells. A. NCI-H1975 cells were treated with increasing doses of EGCG (1), EGCG-G1 (2) and EGCG-G2 (3) at the indicated concentrations for 48 hours. Cell proliferation was measured by MTT assay and expressed as the proliferation rate. B. H2O2 concentrations of EGCG (1), EGCG-G1 (2) and EGCG-G2 (3), tested using a H2O2 Quantitative Assay Kit (Water-Compatible).

So far all the drawings have been graphic. When drawing with light, the soft color and tonality make a significant change o the image. A high-end digital camera records the light pen. The nature of the ‘near chaos’ image is very different. This concludes the variety of images where there are different examples of ‘near chaos ‘drawings. Other examples shown are to illustrate points concerning evaluation.

Evaluation

It is argued that the approach to the art works follows the Gombrich [7] notion of the ‘beholder’s share’ i.e. the response to and benefit derived from an art work is governed by what the viewer brings to the process. Whilst this puts the artist’s intent into second place it is felt to be a workable practice and is adopted in this paper. Evaluation is more complex when the subject is ‘near chaos’. It is the opposite end of a continuum between itself and order; the theme of Kenneth Martin’s ‘Chance and Order’ work in the mid 20c [8]. His work explored the role of chance. Using dice as random input, images displayed ‘near chaos’ characteristics.

Martin’s continuum establishes a deterministic start showing the distance moved towards ‘near chaos’; the process ending when coherence is evident. With machine drawings evaluation is informed by the expectation that combined inputs should fail to generate coherent images. Surprisingly this has not been the case and it is hoped that the various images shown above bear this out to the viewer. Evaluation of chaos and art intensifies the problems of definition, addressing two complex issues. The complexity calls for a philosophical approach and factors below come into play. Considering them might clarify the issues. Paul Klee [6] was a musician and artist, so a musical analogy might be helpful. Music consists of notes of different pitch and timbre, where delivery and interpretation govern the effect on the listener. The same music has first been seen as Chaotic and eventually as Classical. Art objects now seen as chaotic may be seen differently in future although the artist’s curiosity remains the same.

A concluding thought is offered. Simple instructions with a potential for chaos created Figure 18 with complex lines and added color. The author sees ’Homage to Klee’; others may see a jumble of lines with no meaning. We must decide which approach to adopt with regard to generative art from both machines and robots. Our predisposition to seek figurative meaning in abstract images occurs in Hamlet and Polonius’s argument about the shape of clouds and has a bearing on our responses today. In Figure 19 a product from quasi-random input, has been perceived as a woodpecker. A drawing programmed with chaotic potential has become an illustration!

Figure 18: Effect of EGFR TKIs, EGCG derivatives or a combination of the two drugs on the proliferation of NCI-H1975 cells. A-F. gefitinib; erlotinib; lapatinib; icotinib; mubritinib and vandetanib (1μM) combinated with EGCG derivatives (EGCG-G1 and EGCG-G2) (30μM) with or withnot 10ng/mL EGF. Data represent the average of three independent experiments (mean ± SEM, p < 0.001). *** p < 0.001.

Figure 19: Combination of EGCG-G2 and grlotinib has synergized inhibitory effects on the phosphorylation the four members of the Her (ErbB) family in H1975 cells. NCI-H1975 cells were treated with EGCG-G2 (30μM), gefitinib (1μM) or EGCG-G2 plus gefitinib, after 12 hours, NCI-H1975 cells were stimulated with or withnot 10 ng/mL EGF for 5 minutes. The expression levels of the proteins were determined by western blotting with β-tubulin as the loading control.

The view can be taken that the artist’s job is not to convince but to offer results stemming from curiosity and seeking innovation (Figure 20). Then re. ‘Gombrich’, the viewer makes of it what they will. Does this render intent irrelevant? Another viewpoint comes from the philosopher Collingwood, who stated that “Art is the community’s medicine for the worst disease of mind, the corruption of consciousness” [9].

Figure 20: Transport of EGCG and EGCG-G2 across Caco-2 monolayers. TEER values were also measured to account for the integrity of the monolayer during the experiment. A. TEER values of Caco-2 monolayer (Ω·cm2). B. The transepithelial transport rate of EGCG and EGCG-G2 (50μg/mL) in the apical to basolateral direction. C. The transepithelial transport rate of EGCG and EGCG-G2 (50μg/mL) in the basolateral to apical direction. *** p < 0.001.

For more Articles on : https://biomedres01.blogspot.com/

Healing and Prophylactic Efficacies of Topical Composite Herbal Medication on Overuse-induced Achilles Tendinosis

  Healing and Prophylactic Efficacies of Topical Composite Herbal Medication on Overuse-induced Achilles Tendinosis Introduction Tendinopath...