Showing posts with label Free medical journal. Show all posts

Wednesday, June 22, 2022

Synthesis of Molybdenum Oxide Nanoparticles by Sol-Gel Method for Ammonia Gas Sensing

Synthesis of Molybdenum Oxide Nanoparticles by Sol-Gel Method for Ammonia Gas Sensing

Introduction
Last several years much effort has been devoted to the study of molybdenum oxides and its related compound. Molybdenum oxide nanomaterials have attractive catalytic, photochromic and electronic properties, and a lot of potential applications in the areas of electrochemistry and sensing devices [1-5]. Molybdenum is a metal with a wide range of oxidation states from +2 to +7 existing in a variety of oxides. Molybdenum oxide is a potential material because of its wide range of stoichiometry and interesting behaviour which includes structural, chemical, electrical and optical, properties [6-9]. It exhibits a unique layer structure, which permits ion intercalation/deintercalation. Their properties strongly change as a function of oxygen vacancy concentration & nonstoichiometry. As a wide band gap n type semiconducting materials, MoO3 has received considerable attention in many technological applications such as erasable optical storage media, optical switching coatings and high density memory devices, gas & chemical sensors catalysis, energy efficient window technology, photochromic & electrochromic devices [10-12].To date, molybdenum oxide nanomaterials were mainly synthesized by hydrothermal route ultrasonic, solvothermal and chemical vapour deposition methods [13-16]. However, in these processes, it took a long time to synthesize molybdenum oxide nanomaterials or the synthesis process required a high temperature. However, the reproducible preparation of small, stable MnO3 nanoparticles with tight size distribution is of immense importance and still remains a challenging task. Here in we report a simple route for the synthesis of MoO3 nanoparticles and its application for ammonia gas sensing.

Experimental

Materials and General Methods

Sodium molybadate, aliquat HTA-1 and ammonium hydroxide, Hydrochloric acid was purchased from Sigma Aldrich and used as received. The as prepared molybdenum oxide were characterized by UV-Visible, XRD, TEM, EDS techniques. The UV-Visible spectrum was recorded on spectrophotometer [JASCO 503]. The X-ray powder diffraction patterns were recorded on Bruker 8D advanced X-ray diffractometer using CuKα radiation of wavelength = 1.54056 Å. TEM analysis was carried out with JEM 2000EXII /JEOL Ltd. (JAPAN) operated at 200kv. In a typical procedure, 2 g of sodium molybdate was dissolved in 50 ml of distilled water in a 250 ml beaker to it add diluted solution of 2 ml Aliquat HTA-1. Then to the above solution 5 ml of hydrochloric acid was added drop wise with constant stirring for about 1 hours then adjust the temp at about 80oC for 1-2 h. Then the final products Molybdenium oxide was obtained by heating above precipitate at 400oC for 4 hours. After the completion of the reaction, we get black colored powder of MoO3 nanoparticles in quantitative yield. The yield of MoO3 nanoparticles is about 86 % which is quite good.

Results and Discussion

Synthesis and Characterization

The as synthesized MoO3 nanoparticles was subjected to powder x-ray diffraction analysis. A Cu k-alpha (1.54 Ao) radiation was used with 2 Ɵ ranging from 6-90o. The X- ray diffraction pattern shown in Figure 1 explains the crystal structure and phase composition of MoO3 nanoparticles. The sharp diffraction peaks suggest crystalline nature of nanomaterials. The Figure 2 shows that the XRD peaks were observed at 10, 13.66, 24.82, 32.01, 45.72, 56.78, 66.48, 75.54, 84.22. The XRD analysis confirmed that the obtained product was MoO3 nanoparticles. The size and morphology of product were examined by transmission electron microscope (TEM). The TEM micrograph reveals that the size distribution of the nanoparticles was uniform. The size of the MoO3 nanoparticles was ranging from 20-25 nm. The morphological studies revealed that layered MoO3 is formed. Energy dispersive X-ray spectra were also recorded to determine the chemical composition of MoO3 nanoparticles. The uniform distribution and composition of the MoO3 nanoparticles was evaluated by energy dispersive X-ray spectroscopy. From EDS spectra one can obviously see that the signals of O and Mo elements appear in the EDX spectra, which further substantiates that the nanoparticles are composed of molybdenum oxide. The atomic ratio of Mo to O was measured to be 1:3, corresponding to the chemical composition of MoO3. The existence of MoO3 was also confirmed by the mapping of Mo and O signals. EDS mapping confirms the presence of Mo and oxygen in micrograph. The UV-visible spectrum of as synthesized MoO3 nanoparticles was recorded. The absorption spectrum exhibit the maximum absorption λmax at 398 nm. The prominent peak observed at 398 nm is due to absorption of surface plasmones. Particle size distribution studies have been carried out by dynamic light scattering techniques (DLS) via Laser input energy of 632 nm. This is shown in Figure 3. It was observed that MoO3 Nanoparticles have narrow size distribution within the range of about 20-32 nm [17-20].
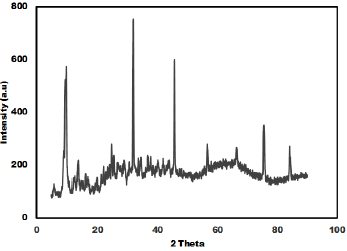
Figure 1: XRD of as-prepared MnO3 nanoparticles.
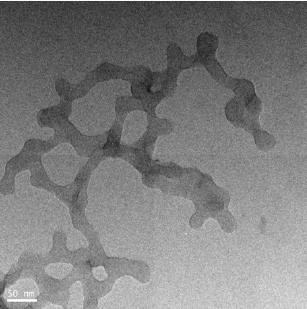
Figure 2: TEM images of as-prepared MnO3 nanoparticles.
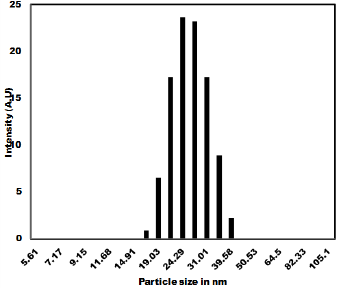
Figure 3: Particle size distribution of as prepared MnO3 Nanoparticles

Gas Sensing Property

The ammonia gas sensing studies of as synthesized MoO3 nanoparticles have been carried out and the result is shown in Figure 4. The gas sensitivity was measured at various temperatures in the range of 100oC to 400oC. Figure 4a shows that 3 to 6 mole % shows very good sensitivity and response time. The as prepared MoO3 was mixed with PVA (2 %) as binder and then pressed into pellets of 1.67 cm diameter and 0.12-0.25 cm thicknesses under the pressure of 10 tons. These pellets were heated in air at 600ºC to remove adhesive. The gas sensitivity sensors were fabricated by pressing the MoO3 nanoparticles into an accurate weight and then a pellet of 10 mm in diameter and 1mm in thickness is formed. The wire embedded as an electrode for sensing the Gas was used and the sensors were mounted into a specially designed Quartz cell. When the sensor absorbs the gas, the redox reaction takes place and it changes the resistance. The reducing gas used in the present study is ammonia. The concentration of ammonia gas was controlled by adjusting the flow rate ratios of target gases to dry air. The sensitivity of the sensors is expressed as the ratio of the air resistance to gas resistance. i.e. = R air / R gas was measured in the temperature range of 200ºC to 350ºC in a dynamic flow system. The measurements were performed inside a closed chamber at different temperatures. Gas mixtures were obtained by means of mass flow controllers and driven into the test chamber. A known amount of target gas is mixed in air and injected to the measuring cell at a flow rate of 1000 cc per minute of air, which is a carrier gas. A previous stabilization treatment is performed to reach a stable conductance value before making the test. Ammonia gas was used for the gas sensitivity measurements. For characterization of gas sensing properties the sensor element were placed in a 1000 cc, in a temperature controlled gas chamber. A typical gas measurements sequence containing predetermined intervals, in which the sensors were exposed to gas atmospheres. After completion of one sequence, the sensors and measurement cycle was repeated. The resistance response of each sensor structure was transformed into a sensitivity value using commonly used formula for the gases as given as
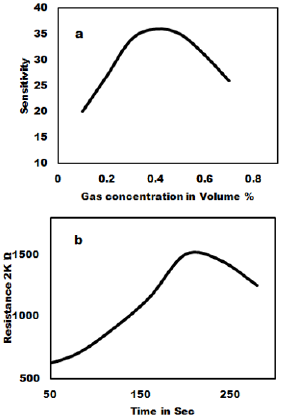
Figure 4: Effect of Gas concentration on the sensitivity of MoO3 Pellet (a) and response time (b).

S = (R air – R gas) / R air

Where R gas is sensors resistance influenced by the ammonia gas and R air is the Resistance in the air showing the dynamic response of MoO3 pellet 100% gas sensors to 1000 ppm ammonia measured at room temperature. The gas sensitivity of MoO3 pellets treated at 700ºC to 800ºC exhibit the highest linear decrease of the resistivity with gas concentration. The reaction time is about 20 sec to 30 sec for sample with MoO3 100% sample gas sensor at room temperature. The relative resistivity of the as syntheiszed sensor becomes stable after 20-255 ammonia exposures.

Conclusion
In conclusion, The MoO3 nanoparticles of narrow size distribution was synthesized and characterized successfully. XRD pattern showed that phase pure MoO3 nanoparticles are formed. TEM study showed that the particle size of MoO3 nanoparticles is about 25 nm. The advantages of this method are simplicity of the process, short duration, energy saving, accessible for auxiliary materials, non-sophisticated equipment and structures with high efficiency. The experimental results confirm that gas sensor based on MnO3 pellets sensitive layer are of great interest for gas detection.

For more Articles on : https://biomedres01.blogspot.com/

Friday, June 3, 2022

Cobalt Doped TiO2/rGO Nanocomposites as Highly Efficient Photocatalyst for Water Purification

Cobalt Doped TiO2/rGO Nanocomposites as Highly Efficient Photocatalyst for Water Purification

Introduction
Photocatalysis is a crucial research filed, which solves the problem of energy and environmental pollution in the world in an economical and sustainable way [1]. Titanium dioxide (TiO2), as the most common candidate among various semiconductor photocatalysts, has been widely utilized in the environmental filed because of its high activity, long-term stability and low toxicity [2-6]. However, because of its wide band gap (Ebg≈3.2eV for anatase type TiO2) and high recombination rate of electron-hole pairs, TiO2 can solely adsorb the UV light which is merely 3~5% of solar spectrum, resulting in low utilization of the majority of the solar energy [7-9]. In order to overcome these drawbacks, various improvement methods have been explored including heterogenous composition [10,11], element doping [12,13], surface modification and the like. Among them, the element doping of TiO2 photocatalysts has been considered as a feasible method to improve the interfacial charge-transfer efficiency, narrow the band gap and delay the recombination of carriers. Up to now, transition metal such as Co [14,15], Pt [16], Sn [17] and Fe [18] has been reported to be successfully doped into TiO2, and the light response wavelength of the obtained materials showed significant red-shift. According to literatures, transition metals cobalt is considered as one of the best candidates to reduce the electron-hole recombination rate and transfer the adsorption edge to the visible light region [19- 21]. The cobalt oxide-loaded TiO2 (TiO2-CoO) support with reduced graphene oxide (rGO) was fabricated by sol-gel method and utilized to remove 2-chlorophenol (2-CP).

The removal efficiency of 2-CP was 98.2% with the ternary nanocomposite in the visible region [22]. The ternary rGOTiO 2/Co3O4 nanocomposites were successfully prepared by coprecipitation method, and exhibited the highest degradation performance of methylene blue (MB) and crystal violet (CV) dye under visible light [23]. As a result, cobalt doped TiO2 photocatalysts have shown superior performance in degrading various organic pollutants. Graphene oxide (GO), due to its excellent electrical conductivity, large surface area and chemical stability, has attracted wide attention as a substrate for promoting the uniform distribution of heterojunction materials and enhancing the photocatalytic activity [24-28]. Due to the conjugated structure of GO, the nanocomposite of modified TiO2 supported with graphene oxide were the perfect combination to enhance the charge separation during the electron-transfer processes. Therefore, the coupling of graphene oxide with some semiconductors has received particular attention in recent years [6]. In this paper, Cobalt doped TiO2/rGO composites was successfully fabricated through hydrothermal method for MB degradation. The results demonstrated that the Co- TiO2/rGO composites remarkably enhanced the MB degradation efficiency. Furthermore, recycling degradation experiments revealed excellent stability of the fabricated Co-TiO2/rGO nanocomposites for treatment of target contaminant.

Materials and Methods

Materials

Cobalt nitrate hexahydrate (Co(NO3)2·6H2O, 98%), Tetrabutyl titanate (C16H36O4Ti), glacial acetic acid (C2H4O2), ethanol (C2H5OH) and macrogol 400 (HO (CH2CH2O) n H) were obtained from He Dong Hong Yan reagent factory of Tian Jin. Natural flake graphite (≥99.85%) was purchased from Sinopharm Chemical Reagent Co. Ltd.

Catalysts Synthesis

Co-TiO2 catalysts were prepared by one-step hydrothermal method. In a typical synthesis procedure, 10mL tetrabutly titanate was dissolved in ethanol (20mL) to form homogenous solution “A”, whereas 0.02g Co (NO3)2·6H2O dissolved in a solution of ethyl alcohol, glacial acetic acid, macrogol 400 and deionized water to form solution “B”. Subsequently, solution “A” was introduced into solution “B”, and the obtained dispersion was heated at 180 °C for 5h. In following step, the prepared catalysts were washed by centrifugation with ethanol and dried at 80 °C. The obtained composites were light yellow particle and calcined in a muffle furnace at 500 °C for 3h, and the obtained sample was named as Co- TiO2. The GO was synthesized by modified Hummers method. 20mg GO powder was dispersed in a solution of deionized water (40mL) and ethanol (20mL) through 30min ultrasonic, and then 200mg Co-TiO2 was introduced to the GO suspension under vigorous stirring. Subsequently, the solution was heated at 140 °C for 5h. The resulting precipitate was washed with deionized water and dried at 80 °C. The final composites powders were labelled as Co-TiO2/rGO- 2. For comparison, the samples prepared by adding 10mg, 30mg GO powder were denoted as Co-TiO2/rGO-1 and Co-TiO2/rGO-3, respectively.

Characterization Methods

The purity and crystallinity of the prepared samples were collected by Bruker D8 Advance X-ray diffraction (Germany) with Cu Kα radiation. The morphology of the photocatalysts was characterized via Scanning electron microscope (Hitachi SU-4800). The Ultraviolet-Visible (UV-Vis) diffuse reflectance spectra (DRS) were implemented by using UV-3600 Plus. X-ray photoelectron spectroscopy (XPS) were obtained by ESCALAB 250XI (ThermoFischer Electron Corporation, USA). Electrochemical measurements were carried out on CHI 660E electrochemical workstation.

Photocatalytic Degradation

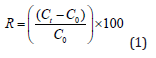
The photocatalytic efficiency of Co-TiO2/rGO samples was investigated with MB degradation under visible light. The visible light source was Perfect 300W Xe-lamp (with a 420nm cut-off filter). In each experiment, 20mg of Co-TiO2/rGO composite were added to 150mL MB solution (20mg/L). The suspension was stirred in the dark for 60min to ensure the attainment of adsorption-desorption equilibrium. 5mL sample solution was extracted at predetermined time and analyzed by UV-3600 plus. The removal efficiency (R) of MB was calculated by Eq. (1).

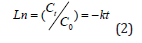
It was expected that the degradation of the MB obeyed the pseudo-first-order reaction kinetics as follows:

where C0 (mg/L) was the initial concentration of MB, Ct (mg/L) was the concentration of MB at time t, k was the kinetic constant.

Results and Discussion

Structure Characterization

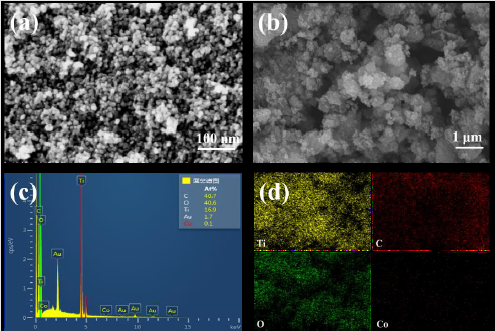
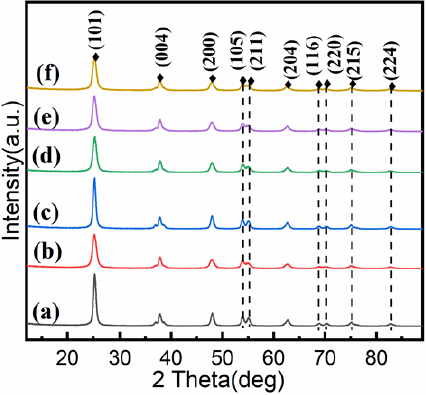
Figure 1 were the XRD patterns of the as-prepared nanocomposites. It was clear that all samples exhibit similar diffraction peaks. The peaks located at 2θ = 25.34°, 37.85°, 47.99°, 54.04°, 62.67°, 68.79°, 70.31°, 75.05° and 82.49°, which could be indexed to (1 0 1), (0 0 4), (2 0 0), (1 0 5), (2 0 4), (1 1 6), (2 2 0), (2 1 5) and (2 2 4) planes of anatase TiO2, demonstrating the high purity and good crystallinity of the samples [29]. The diffraction peaks of Co were not observed, which might be owing to the low content of Co (NO3)2· 6H2O or the cobalt ions were uniformly dispersed into the anatase crystallites. It was noteworthy that the peak intensity corresponding to the (2 1 1) crystal plane in the cobalt-doped nanocomposites varied, indicating that the presence of Co2+ ions around Ti4+ [30]. No significant diffraction peaks were noticed for XRD patterns of Co-TiO2/rGO nanocomposites when compared with Co-TiO2 nanoparticles, which was described the low rGO content in the composite, or of the TiO2 loading on the rGO surface [31,32]. Surface morphology of the as-prepared composites was assayed through SEM analyses. It could be seen from Figure 2a that the Co- TiO2 particles were subsphaeroidal and well-dispersed. Figure 2b showed that the agglomeration occurred when subsphaeroidal Co- TiO2 particles were combined with graphene sheets. The element composition of the Co-TiO2/rGO-2 nanocomposites were confirmed by EDS analysis. In the element mapping images (Figures 2c & 2d), C, Ti, O and Co disperse uniformly in the selected area of Co-TiO2/ rGO-2, suggesting that cobalt atoms were successfully doped into the composites. According to these images, the cobalt atoms were evenly distributed in TiO2 particles, indicating that the interaction between cobalt and TiO2 particles was excellent in the hydrothermal synthesis procedure [15].

Figure 1: XRD patterns of

a) TiO2;

b) Co-TiO2;

c) TiO2/rGO;

d) Co-TiO2/rGO-1;

e) Co-TiO2/rGO-2;

f) Co-TiO2/rGO-3

Figure 2: SEM images of

a) TiO2;

b) Co-TiO2/rGO-2;

c) C and

d) EDS analysis of Co-TiO2/rGO-2.

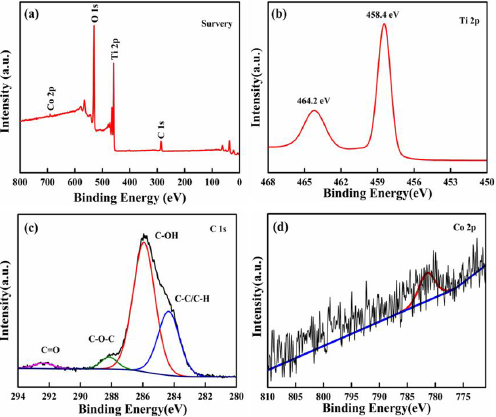
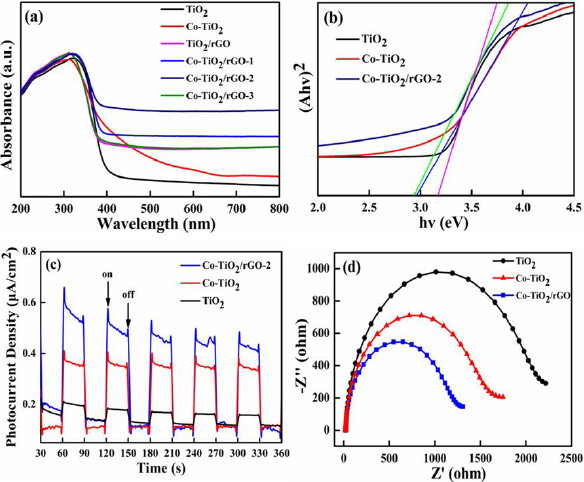
The chemical oxidation state of Co-TiO2/rGO-2 nanocomposites were measured by XPS analysis (Figure 3). As shown in Figure 3a, the XPS survey spectrum of the Co-TiO2/rGO-2 presented that C, O, Ti and Co elements could be revealed, which could consistent well with the result of EDS element mapping. The spectrum of Ti 2p (Figure 3b) exhibited two main peaks at 464.2 and 458.4eV, which were assigned to the Ti 2p1/2 and Ti 2p3/2 [33]. The C 1s spectrum of Co-TiO2/rGO-2 composite was fitted into four peaks at 292.3eV, 288.1eV, 285.9eV and 284.3eV, which were signed to C= O, C= O= C, C= OH and C= C/C= H, respectively [34,35]. In the Co 2p core level of the Co-TiO2/rGO-2 nanocomposites (Figure 3d), the peak appearing at 781.2 corresponded to Co (II) ions [36,37]. The optical property of TiO2 and Co-TiO2/rGO was inspected by UV-Vis adsorption spectra, as displayed in Figures 4a & 4b. Pure TiO2, with equal to 3.18eV and adsorption edge at 390nm, showed almost no visible light adsorption. Compared with the adsorption edge of pure TiO2, a strong light adsorption intensity at approximately 430nm was observed for the Co-TiO2/rGO-2 composites, which was associated to the formation of Ti-O-C bonds, resulting in reduced excited photons energies and hence low band gap energy [38]. As a result, the visible light adsorption efficiency of Co-TiO2/rGO-2 can be effectively enhanced due to the cobalt cations and rGO, which is beneficial to improving the photocatalytic degradation activity.

In order to reveal the behaviors of charge transfer and separation in the prepared photocatalysts, the photocurrent response and electrochemical impedance spectroscopy (EIS) were recorded [39]. Figure 4c showed the transient photocurrent responses of TiO2, Co-TiO2 and Co-TiO2/rGO-2 composites. It could be found that the photocurrent densities of Co-TiO2/rGO- 2 composites were significantly higher than that those of other samples, implying the efficient separation efficiency of electronhole pairs. Figure 4d exhibited EIS changes of TiO2, Co-TiO2 and Co- TiO2/rGO-2 composites. It was clearly observed that the Co-TiO2/ rGO-2 possessed much smaller arc radius relative to TiO2 and Co- TiO2, indicating that Co-TiO2/rGO-2 had lower resistance and faster separation of electron-hole in the charge transfer processes, which could well correspond to the photocurrent results.

Figure 3:

a) Full XPS spectrum and high-resolution spectrum of

b) Ti 2p

c) C1s and

d) Co 2p

Figure 4:

a) UV-Vis diffuse reflectance spectra of TiO2, Co-TiO2, TiO2/rGO and Co-TiO2/rGO;

b) Plot of Kubelka-Munk function versus band gap energy of TiO2, Co-TiO2 and Co-TiO2/rGO-2;

c) The transient photocurrent density of TiO2, Co-TiO2 and Co-TiO2/rGO-2;

d) Electrochemical impedance spectra of Nyquist plots of TiO2, Co-TiO2 and Co-TiO2/rGO-2.

Photocatalytic Performances

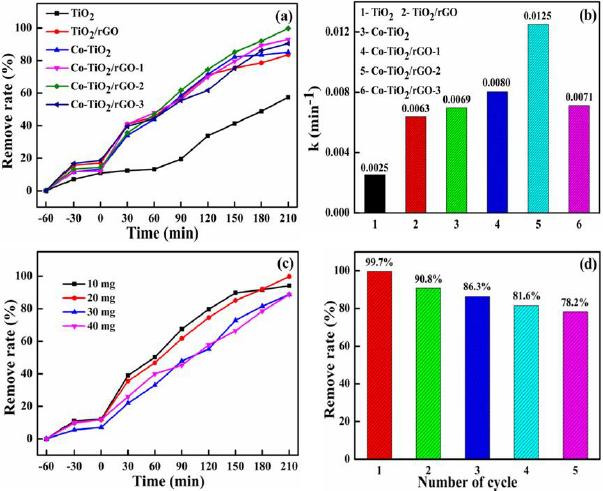
The photocatalytic performances of the TiO2, Co-TiO2, TiO2/rGO and Co-TiO2/rGO composites were evaluated by degradation MB. As exhibited in Figure 5a, the Co-TiO2/rGO-2 nanocomposites had the highest photocatalytic performance. For pure TiO2 nanoparticles, only 57.4 % of the MB was removed following 210 min under visible light irradiation. Nonetheless, the removal percentage of MB by TiO2/rGO and Co-TiO2/rGO-2 nanocomposites was 83.5% and 99.7%, respectively. The enhanced activity of the Co-TiO2/rGO-2 nanocomposites might have been attributed to the introduction of Co ions and rGO. Figure 5b manifested the kinetic constant (k) of the as-prepared photocatalytic. The k value of pure TiO2 and TiO2/ rGO were 0.0025 and 0.0063 min−1, respectively. While the Co-TiO2/ rGO-2 nanocomposites exhibited the highest MB photodegradation rate (0.0125 min-1), which was almost 5 and 1.98 times faster than those of the TiO2 and TiO2/rGO, respectively. To identify the optimum dosage of the photocatalyst, a series of experiments were carried out by varying the concentration of catalyst from 10mg to 40mg in 150mL of MB (20mg/L) (Figure 5c). It was realized that the removal efficiency of MB increased from 69.3% to 99.7% with the Co-TiO2/rGO-2 nanocomposites increased from 10mg to 20mg, which was ascribed to the availability of enough active sites on the catalyst surface. Whereas the remove efficiency decreased with a further increase in the Co-TiO2/rGO-2 dosage, which was ascribed to the agglomeration of the photocatalyst. Based on the above results, the optimal dosage of Co-TiO2/rGO-2 nanocomposites for MB degradation was to be 20mg. The stability and recyclability of the photocatalyst exerts great impact on the operating cost of wastewater treatment. Therefore, the stability of the photocatalysts was evaluated for the Co-TiO2/rGO-2 nanocomposites and the results were showed in Figure 5c. The study indicated that the removal efficiency of MB was still 78.2% after five recycling runs, indicating the activity of the recovered Co-TiO2/rGO-2 was stable enough for recycling. Therefore, Co-TiO2/rGO-2 nanocomposites were expected to be promising in environmental remediation because of their excellent photocatalytic activity and stability.

Figure 5:

a) Photodegradation of MB under simulated solar irradiation over the as-prepared photocatalytic;

b) The kinetic constants of the as-prepared photocatalytic for the MB photodegradation;

c) Efficient of the dosage of the MB photodegradation by Co-TiO2/rGO-2;

d) Effect of cycling times on photocatalytic efficiency on Co-TiO2/rGO-2

Proposed Mechanism for Photocatalytic Degradation of MB

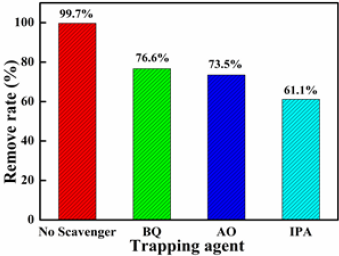
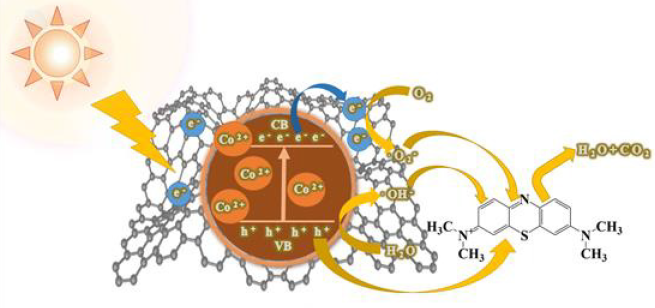
To determine the active species (such as •OH or h+ or •O2 - radicals) and further explore the photodegradation mechanism, isopropyl alcohol (IPA), ammonium oxalate (AO) and 1,4-benzoquinone (BQ) were used as the radical scavengers [40,41]. The experiment data revealed that the photocatalytic activity of Co-TiO2/rGO-2 was decreased by adding the radical scavengers but to different degrees (Figure 6), indicating that all the above active radical species were responsible for the MB degradation. Notably, the photocatalytic performance dropped sharply to 61.1% with the addition of IPA, demonstrating that h+ radical was the main active species in the MB degradation process. Based on the above characterization and photocatalytic activity results, a plausible mechanism of Co-TiO2/ rGO-2 for MB degradation has been proposed and shown in Figure 7. The improvement of TiO2 photocatalytic performance could be explained as follows:

1) The doping of optimal Co2+ into the lattice of TiO2 nanosheet could efficiently reduce the band gap width of TiO2 and increase the adsorption of visible light [42,43].

2) The specific surface area of the composite increased due to adding rGO, and more active sites could be provided for photocatalytic activity [44].

3) Under the excitation of visible light, the electrons generated by the conduction band of TiO2 were captured and transferred by the graphene layer, which improved the electron-holes separation efficiency [45,46].

The electrons subsequently react with the oxygen molecules adsorbed on the surface of the catalyst to generate •O2 - to degrade MB. At the same time, the residual h+ within the TiO2 VB can be directly or through water oxidation to generate ·OH radicals, and in turn photo oxidize of MB [15]. In summary, the addition of Co metals to TiO2/reduced graphene oxide composite have demonstrated to be beneficial for degrading MB, which was consistent with the electrochemical measurements. The synergy effects of Cobalt doped TiO2 and rGO was conducive to the formation of the active sites and the facilitation of the high photocatalytic performance. Therefore, Co-TiO2/rGO composite offered an excellent combination of high activity and long-term performance durability.

Figure 6: Effects of radical scavengers on the degradation of MB over Co-TiO2/rGO-2 nanocomposite.

Figure 7: The probable photocatalytic degradation mechanism for MB by the Co-TiO2/rGO nanocomposites.

Conclusion
In conclusion, an efficient Cobalt doped TiO2/rGO photocatalyst was successfully prepared, and the properties of Co-TiO2/rGO nanocomposites were investigated. It was noticed that the Co-TiO2/ rGO-2 revealed an excellent photocatalytic performance in the MB degradation process. Compared to TiO2, MB degradation percentage was increased from 57.4% to 99.7% in the existence of Co-TiO2/rGO- 2. This phenomenon could be explained as the special properties of reduced graphene oxide components and cobalt dopant, which facilitate the separation of photo-generated carries and extend the adsorption spectrum of TiO2 into visible region. Furthermore, the degradation percentage of MB was still obtained to 78.2% after five cycles. Therefore, Co-TiO2/rGO nanocomposites have promising applications in degradation of the organic compounds in the coloring, petroleum and leather industries.

For more Articles on : https://biomedres01.blogspot.com/
Tuesday, May 24, 2022

Transperineal Prostate Biopsies Under Local Anesthesia: Initial Experience


Transperineal Prostate Biopsies Under Local Anesthesia: Initial Experience

Introduction: Prostate biopsies (PB) are commonly performed using a transrectal approach under local anesthesia (LA). However, serious infectious complications can occur. The aim of our work was to evaluate the feasibility and safety of transperineal PB under LA.

Method: Between September and December 2020, all patients who had an indication of PB were offered to undertake it using a transperineal approach under LA. We proposed systematic biopsies, and additional targeted biopsies for patients presenting a target on pre-biopsy MRI (PIRADS≥3). The level of pain was evaluated using an analogic scale. Duration of procedure and adverse events within 30 days were also collected, as well as the results of biopsy cores histological analysis.

Results: 19 patients were included during the period. Median duration for the LA procedure was 13 [10-16] min, using a median volume of 65 [10-16] mL of Lidocaïne 0,5%. Median duration of the biopsy procedure itself was 12 [10-15] min. Median maximal level of pain was 3/10 [2;5]. A prostate cancer was diagnosed in 15 (79%) patients. No complication was reported during the 30 days following PB.

Conclusion: Our initial experience suggest that transperineal PB are feasible and safe under AL.

Keywords: Prostate Cancer; Prostate Biopsies; Transperineal; Local Anesthesia

Abbreviations: EAU: European Association of Urology; PB: Prostate Biopsies; LA: Local Anesthesia

Introduction

Since their initial description in the early 1980s [1], echoguided PB has been commonly performed by the transrectal approach. The transperineal approach has been rarely proposed - even though many reports suggested its non-inferiority in terms of diagnostic performance [2-5] mainly because of the poor tolerance, requiring general anaesthesia and thus hospital management. Despite antibiotic prophylaxis with oral fluoroquinolone, the main complications of transrectal PB are acute prostatitis, reported in 2.8% of cases [6]. Several publications recently suggested that severe post-PB sepsis rate increased over the past decade [6,7]. In addition, some reports suggested an increase of fluoroquinolone resistance, leading to a higher mortality rate [7-9]. Several solutions have been proposed to reduce the risk of sepsis, such as rectal disinfection [10] or the systematic performance of prebiopsy coprocultures in order to adapt the antibiotic prophylaxis to each individual case. Coproculture is now recommended by the European Association of Urology (EAU) for patients at risk of sepsis [11], but this organization in routine care limit the adherence of urologists to this practice. The transperineal approach could be an alternative to reduce this infectious risk.

The transperineal approach has received renewed interest in recent years due to the development of focal treatments for prostate cancer, which are performed mostly by transperineal approach [12]. Using the same approach for diagnosis, characterization and then treatment may be more relevant. Furthermore, the development of fusion and biopsy guidance software has made the technique of targeted PB reliable and accurate, regardless of the approach, transrectal or transperineal [13-17]. The main obstacle to the widespread use of transperineal PB remains its poor tolerance, which has motivated its use under general anesthesia until now. We have recently started our experience in performing transperineal PB under LA, in consultation. The objective of this work was to report the feasibility and tolerance of these PBs, performed by a single operator, during the first three months of his experience.

Patients and Methods

Patient Selection

Since November 2020, all patients with an indication for prostate biopsies in our center were offered transperineal biopsies under local anesthesia as an alternative to the transrectal approach. This work reports the initial experience, over a three-month period, of a single operator. In case of a suspicious image on MRI (PIRADS score 3), targeted biopsies were performed in addition to systematic sampling.

Technique

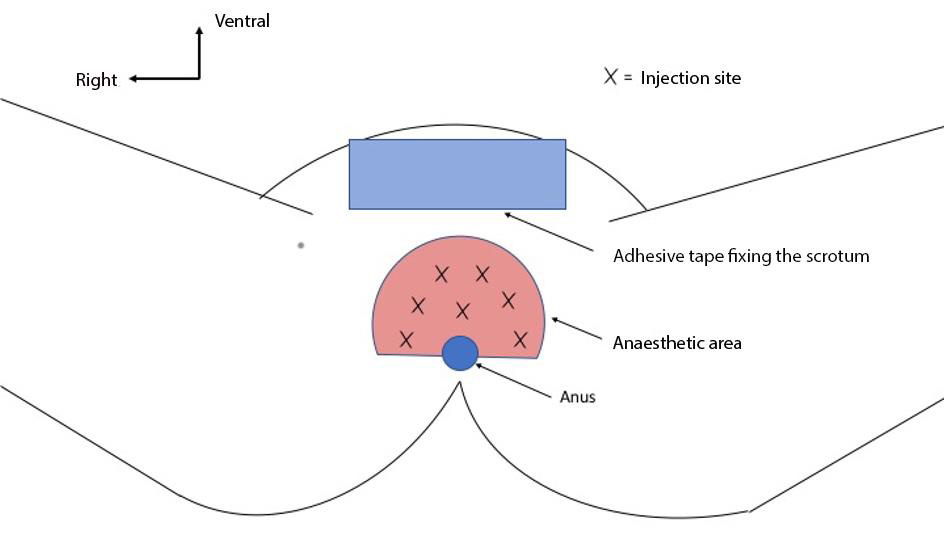
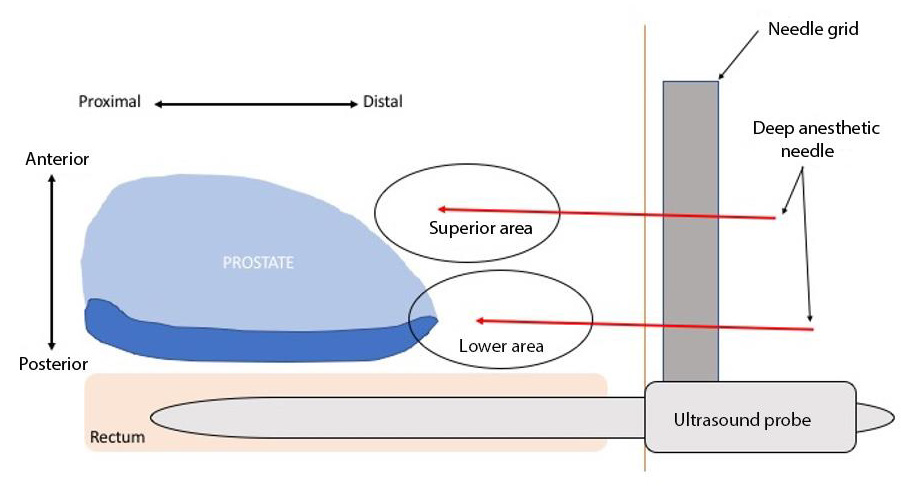
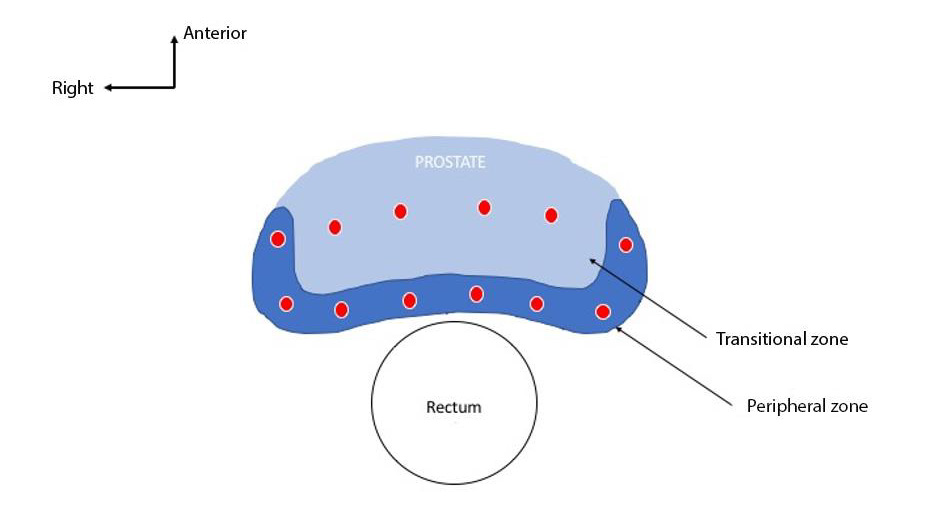
All patients received antibiotic prophylaxis with Ofloxacin in a single dose of 200 mg per os. A rectal enema was performed a two hours before biopsies. The biopsies were performed in a consultation room. The patient was installed in the gynecological position. The articulated arm used to stabilize the probe was attached to the examination table. A 0.5% lidocaine solution was prepared by diluting 40mL of 1% lidocaine in 40mL of saline. Subcutaneous anesthesia was performed by injection of approximately 10 mL of lidocaine solution. The area of anesthesia extended in a hemi-disc, centered on the anus, of approximately 5 cm radius (Figure 1). After skin anesthesia, the ultrasound probe was inserted, after having been attached to the stabilization arm. The anesthesia of subcutaneous tissues was performed under ultrasound control using a Chiba 22ga needle of 20cm length. During the progression of the needle from the subcutaneous tissues to the prostate, an injection was performed approximately every 5 mm. After injecting the lidocaine solution in the lower medial sagittal area, the injection was repeated in the upper medial sagittal area (Figure 2). The same protocol of injections was repeated in the left para-sagittal area and then in the right para-sagittal area, for a total of 6 injection points of local anesthesia. In patients with an MRI target of PIRADS≥3 score, the operator started with 3 to 4 targeted biopsies. All patients underwent systematic biopsies (Figure 3).

biomedres-openaccess-journal-bjstr

Figure 1: Schematic of the injection area for local skin anesthesia.

biomedres-openaccess-journal-bjstr

Figure 1: Median sagittal section diagram of subcutaneous anesthetic areas during transperineal biopsies under local anesthesia.

biomedres-openaccess-journal-bjstr

Figure 3: Axial section of transperineal systematic biopsy protocol.

Data Collection and Analysis

All data were collected prospectively. The different stages of the procedure were timed. The maximum level of pain was assessed during the procedure and 1 minute after the last biopsy, using a numerical scale ranging from 0 (no pain) to 10 (maximum pain possible according to the patient). Categorical variables were described in terms of absolute numbers and percentage, n(%). Quantitative variables were described in terms of median, expressed with the first and third quartile, m[q1; q3].

Results

Characteristics of the Population

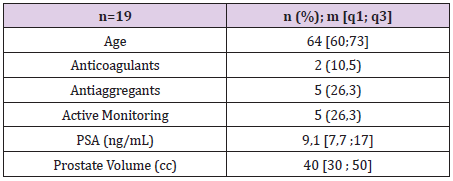
19 patients were included. The characteristics of the population are summarized in Table 1. The 5 patients under active surveillance protocol had PBs at least 6 months before the procedure.

biomedres-openaccess-journal-bjstr

Table 1: Characteristics of the population. Proportions are expressed as absolute numbers and percentages -n(%)- and continuous variables as medians -m[q1; q3].

Data Collected During the Procedure

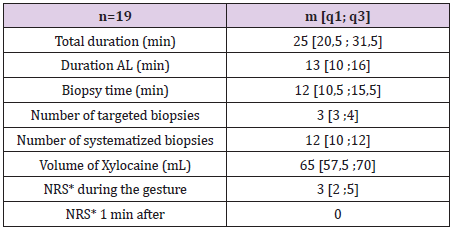
All procedures were performed completely using the transperineal approach, without any adverse event. No conversion to transrectal biopsy was required. The data collected per procedure are summarized in Table 2.

biomedres-openaccess-journal-bjstr

Table 2: Data collected during the biopsy procedure.

Note: *NRS: Numerical scale evaluating the patient’s pain, rated from 0 to 10.

Histological Analysis

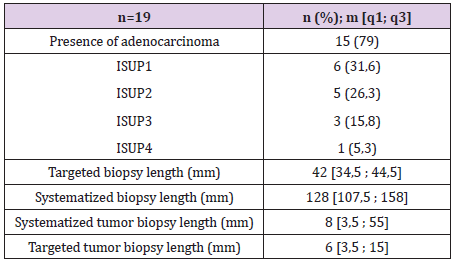
Prostate cancer was diagnosed in 15 (79%) patients. The results of the histological analysis are summarized in Table 3. No Clavien-Dindo≥2 score complications were reported within 30 days. No unusual symptoms were reported.

biomedres-openaccess-journal-bjstr

Table 3: Results of histological analysis of core biopsies.

Discussion

Our preliminary results suggest that transperineal prostate biopsies are feasible, with a good tolerance, in a consultation setting. No procedure had to be interrupted, and no adverse events were observed. Subsequently, no Clavien-Dindo>1 complications were reported by patients within 30 days. The median maximum pain reported during the examination was 3/10 [2;5]. These results seem comparable to these obtained with transrectal approach. Indeed, a study of nearly 200 patients rated the median pain of transrectal biopsies at 2.5 on a similar scale [18]. These results also seem comparable with recent series evaluating the transperineal approach under local anesthesia, with scores ranging from 2/10 to 5/10 [19-22]. Even if this median score of 3/10 seems acceptable, we observed heterogeneous results. Indeed, one patient reported a pain score of 6/10 and three other patients reported a score of 5/10. These pain scores do not seem acceptable for this type of diagnostic examination, and a larger study should confirm that these are exceptional situations, or related to the beginning of the experiment.

In addition, two patients felt no pain and two others felt very little pain at 1/10. These cases confirm that the analgesia technique used can be totally effective and allow a comfortable procedure. The patients who reported pain at some point of the procedure felt it mainly during the local anesthesia. The most painful moment was the introduction of the needle through periprostatic tissues. The majority of patients in our study described no pain at the time of biopsy punctures, and no pain after the procedure. These results are concordant with recent studies, which suggest the anesthetic procedure as the potentially painful stage of the procedure [19-22]. In addition, two of the three patients who previously underwent transrectal biopsies (active surveillance), reported less pain during transperineal biopsies compared to transrectal appraoch. One of the questions that currently arises is the comparison of the tolerance of the two approaches. To our knowledge there are no comparative trials in the literature.

Even if pain is probably the main point of the evaluation of the tolerance of the technique, the length of the procedure seems to us just as relevant, for the comfort of the patient, and on a larger scale in terms of accessibility of care and overall cost. In our study, the median length of the procedure was 25 [20 ;31] min. The duration was more than 30 min at the very beginning of our experience and then about 20 min for the last procedures. The recent work of Marra et al. also evaluated the length of procedures using a similar technique in 450 patients [19]. The median duration was 18 [15;22] min. It is therefore likely that the experience of the operator allows the duration of the procedure to be reduced, and thus optimizes patient comfort. The median duration of the LA procedure, was 13 [10;16] min, which corresponds to about half the duration of the procedure. In our experience, we observed that an AL procedure lasting less than 10 min did not provide optimal analgesia. This may reflect the minimal time required for effective analgesia, which could be explained by the time delay of action of lidocaine. In the work of Marra et al, the median duration of the anesthetic procedure was 3 [2;4] min, which could explain a high median pain of 5/10 [19].

One of the potential advantages of the transperineal approach is reduction of infectious risks. This risk is about 3% [6], it is greater in patients having iterative biopsies, which are nevertheless necessary in the context of active surveillance protocols, or surveillance after focal treatment [15]. In the series by Marra et al. the authors did not report any infection. The patients were nevertheless treated with fluoroquinolones, which may be debatable given the absence of rectal puncture. Another study that evaluated a series of 577 patients who received cephazoline as a single dose did not report any cases of post-biopsy prostatitis [15]. Finally, a smaller series of 45 patients who received no antibiotic prophylaxis reported no cases of infection [23]. A recent report using Norwegian social security data showed an increase in mortality related to infectious complications of prostate biopsies related to fluoroquinoloneresistant E. coli. The Oslo University Hospitals are now in the process of changing their PB protocol in favor of the transperineal approach [8].

Only a prospective randomized study will confirm that transperineal PB without antibiotic prophylaxis reduces the risk of infection compared to transrectal PB with antibiotic prophylaxis. No patient in our study had urinary retention. Other series report a low rate, less than 1% [21,22]. It is possible that this difference could be explained by a our relatively limited population . Other series have reported rates above 1%, but the procedures were performed under general anesthesia, which independently increases the risk of retention [15]. The main limitation of our study is related to the small number of patients. Our work was designed to evaluate the technical feasibility, and therefore does not present sufficient data to evaluate the infectious risk, nor the biopsy yield. Nevertheless, it allows us to conclude that transperineal PB under LA is feasible, and that the initial experience is not associated with a particular risk for the patient. The surgeon had a short training with another experienced surgeon before starting his own procedures. The experiment went on without any accidents, conversions, or adverse events.

Conclusion

Our results suggest that transperineal PB under LA is feasible and safe, in consultation, from the initial learning period.

For more Articles on :https://biomedres01.blogspot.com/

Monday, May 23, 2022

Molecular Modelling a Key Method for Potential Therapeutic Drug Discovery

Molecular Modelling a Key Method for Potential Therapeutic Drug Discovery

Introduction
Cancer is the second leading cause of death in the United States and serves as a great barrier to increasing life expectancy in many countries around the world [1]. In fact, below the age of 70, cancer is the first or second leading cause of death in 112 of 183 countries and is the third or fourth cause of death in another 23 countries [2]. Although the overall incidence and cancer mortality rate has been greatly reduced over the past couple of years due to advancements in early detection screenings and treatment options, cancer remains prevalent [3]. Factors that increase risk of cancer, like obesity, diabetes, and aging, are on the rise, and as a result, people are at a higher risk of getting cancer, especially in the United States [4]. Furthermore, treatment options are becoming more limited due to the robust characteristics of aggressive cancer types that allows them to obtain drug resistance. This is especially true for the adolescence and young adult (AYA) population, as from 2006- 2017, an increase in overall cancer incidence was seen, which is bad because treating younger cancer patients means that the cancer has more time to build up a resistance to the anticancer drug being used. Because of this, research into the development of new drugs for cancer treatment has been an ongoing effort.

Drug resistance for typical chemotherapeutic treatments is one of the main reasons these kinds of cancer therapies result in failure [5]. Despite the considerable progress being made in targeted cancer therapies, there is no treatment that is 100% effective in eliminating cancers, because of their innate resistance (to a broad range of anticancer drugs) or their acquired resistance (as existing therapies become more effective against them) [6]. One reason for this resistance may be due to cancer cell plasticity, which allows for cancer cells to switch between differentiated (limited tumorigenic potential) and undifferentiated (cancer stem cells) states [7]. Plasticity greatly contributes to tumor heterogeneity, which describes the differences between subpopulations of the same tumor type in different patients and is the reason why differential responses to therapies occur [8]. Furthermore, cancers are extremely complex, and their robustness [9,10] allows them to survive, adapt, and maintain their proliferative potential and functionality in the face of any internal or external perturbations (such as against a wide variety of anticancer therapies) [11]. One major solution to this is to develop novel drugs that are either better than their predecessors or that can result in deeper responses from being used sequentially or in combination with existing drugs [12].

Proteins as Therapeutic Targets

The diagnostic detection and measurement of cancer progression is essential for effective disease management, especially since the early stages of cancer have the highest therapeutic potential [13]. These early stages, however, are typically asymptomatic, and as a result, identifying novel biomarkers of various cancers is essential for early detection [14]. Cancer biomarkers can be any sort of tumor characteristic (like tumor tissue) or bodily response to cancer (like bodily fluids), that help indicate current or future cancer behavior, such as cancer risk, cancer type, and drug or treatment efficacy [15]. Not only can these biomarkers be used in diagnosis and early malignancy detection, but they may also be used as specific drug targets when designing novel anticancer drugs.

A prominent example of cancer biomarkers include the estrogen receptor (ER), the progesterone receptor (PR), and the human epidermal growth factor receptor (HER2), all of which are essential for the standard care of newly diagnosed, recurring, and malignant breast cancer patients [16]. Targeted HER2 drugs, such as Tratsuzumab, a humanized monoclonal antibody against HER2, have been developed and shown to increase time to progression and survival in both early stage and metastatic breast cancers [17]. As cancers continue to develop drug resistance, it becomes more critical to identify new biomarkers and develop more efficient drugs to help combat disease progression [18]. Current tools for doing this are time-consuming and inefficient, but the latest structural modeling tools can make this process easier and faster and can even take advantage of existing drug databases to potentially repurpose known drugs.

Methods for Drug Identification

The cancer proteome and metabolome (the entire set of proteins or small molecule metabolites, respectively, that are produced by a cancer), can contain important information relating to the discovery of novel biomarkers. Various methods such as electrophoresis, mass-spectroscopy techniques, and protein microarrays can be used to discover novel biomarkers. Additionally, many target-specific immunoassays and immunosensor techniques, including electrochemical, mass-sensitive, and optical have been used for tumor-related biomarker detection [19]. Traditional chemotherapies directly target the DNA of cells, but this can damage healthy cells, so modern approaches to anticancer drugs focus on molecular targeted therapy (i.e. monoclonal antibodies and small molecule inhibitors) to reverse abnormalities in the expression of kinases, tubulin proteins, extracellular matrix components, vascular targets, cancer stem cell pathways, or the tumor microenvironment (like acidity) as possible drug targets so that cancer cells can be selectively killed with a decreased toxicity towards normal cells [20].

Physical methods for studying drug-protein binding have been traditionally divided into either non-spectroscopic (like calorimetry, dialysis, filtration, electrophoresis and centrifugation) or spectroscopic (like UV and visible light absorption, NMR, X-rays, and fluorescence) [21]. These, however, have been replaced with more advanced and efficient methods such as a variety of massspectroscopy (MS) techniques including a direct approach, a structural approach, an enzymatic approach, an affinity-based approach, and a global proteomics approach [22]. These various MS approach make it possible to characterize drug target structures, screen large numbers of potential drug candidates (in metabolism and in pharmacokinetic studies), detect drug-target complexes, examine how protein structure is affected by the drug, and monitor the enzymatic activity of the target protein in relation to the drug [23]. Despite these major improvements in analyzing protein-drug interactions, these methods remain complex, time consuming, and costly [24]. As a result, more convenient tools, such as computational methods and structural modeling, should be used for estimating protein-drug binding affinities instead.

Structural Modeling and Drug Bank

The RCSB protein data bank (PDB) is an open access resource in biology and medicine for finding three-dimensional structural data on large biological molecules such as proteins and can be used to find the PDB ID for the crystal structure of a protein of interest (Ex: HER2) [25]. All 3D structures found on this resource are experimentally verified by either X-ray crystallography or nuclear magnetic resonance (NMR) and give an accurate depiction of the structure of the protein and/or its binding domain. This makes it perfectly valid for in silico use and for extrapolating that data towards in vitro and in vivo studies. Furthermore, a comprehensive list of potential inhibitors, agonists, and antagonists can be obtained from a variety of existing sources. For example, the Natural Product Activity & Species Source Database (NPASS) can be used to find potential nutraceuticals that are effective against the protein of interest or use that data to develop a novel drug that is analogous in structure [26]. Alternatively, the DrugBank library, a comprehensive open access database containing information on drugs, drug properties, and drug targets, may be used to screen approved and experimental drugs to find effective inhibitors of the protein of interest [27].

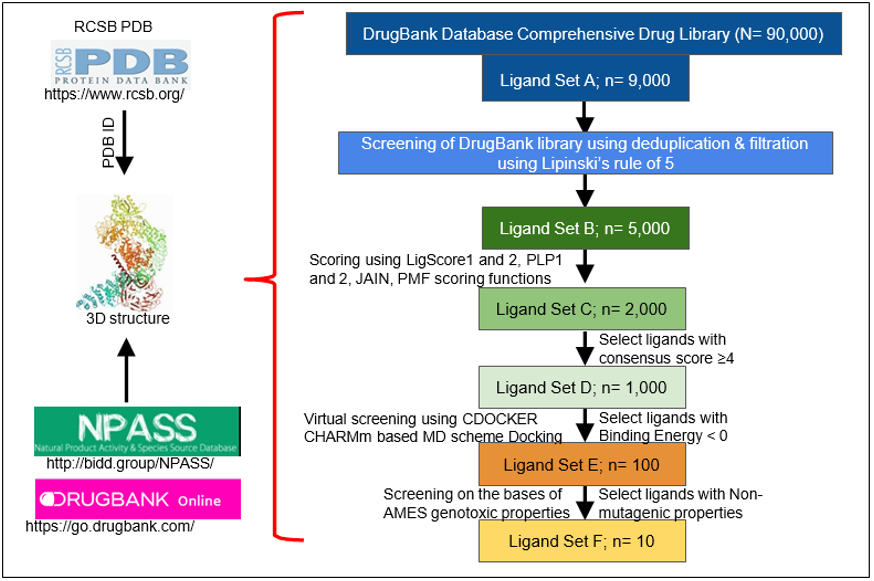
This can all be accomplished in a matter of days or weeks by performing a multi-layered High-Throughput Virtual Screening (HTVS) with the BIOVIA Discovery Studio Client 2020 software. In a multi-layered HTVS, several screening layers are performed in succession to identify the best molecule that will bind to the protein of interest [28]. This process takes place in three stages, each of which sequentially narrows down the list of potential inhibitors. First, a preliminary rigid docking analysis, using the DS LibDock extension, takes place by comparing the binding energies of the protein’s crystalline structure to each ligand from the identified drug library in a rigid conformation to determine which ligands best fit at the binding site. Then, a flexible docking analysis, using the CDOCKER extension, takes place by mimicking the flexible nature of the binding site domain in nature and produces docked conformations with extreme precision. The number of potential drugs is then finalized after an Absorption, Distribution, Metabolism, Excretion, and Toxicity (ADMET) analysis is performed to determine the exact pharmacokinetic properties of the protein-drug interactions that were identified. Typically, after completion, anywhere from 10-20 drugs are identified and can then undergo further testing via in vitro and in vivo analyses to confirm their potential for inhibition. Figure 1 summarizes the steps in identification of drugs through structural modeling.

Figure 1: Steps in identification of drugs through structural modeling. RCSB PDB is analyzed for the specific protein ID. The 3D structure of the protein of interest, which is verified by X Ray crystallography or NMR, is used for further analysis. Identified binding domains are screened on different drug bank libraries on the basis of different parameters (n= is the depiction for the total target number).

Conclusion
Using these underutilized in silico tools will save a lot of time and money when considering the alternatives that are much more labor and resource intensive. For example, High-Throughput Screenings (HTS) are similar to HTVS except they are performed physically under wet-lab conditions. HTS is a drug discovery process that is popular amongst many pharmaceutical companies and takes advantage of robotics to autonomously screen a library of drugs and test their biological functions for pharmacological profiling [29]. The problem is that the equipment required (robots) and the bioactive drug screening libraries can cost tens of thousands of dollars, require technical training to use precisely, and can take months to finish a large screening analysis. Furthermore, from the ADMET analysis, HTVS can analyze pharmacokinetic parameters, like toxicity, of the identified drugs and their potential impact on certain tissues, like the liver, something which requires further testing after completion of HTS.

On top of all that, once this process is completed, a new drug is not discovered. Rather, these molecules are identified as “leads” for furthering and optimizing the drug discovery process, which takes too long to be feasible for immediate use. In fact, from lab experimentation to clinical testing and drug approval, novel drug development is a complex, time-consuming, and expensive process that can cost a manufacturer million, sometimes even billions [30] of dollars in resources and 12-15 years for completion [31]. By taking advantage of the latest bioinformatics techniques, such as HTVS, to analyze protein-drug interactions, small molecule inhibitors for cancer protein targets can be found with ease by repurposing existing drugs instead of waiting years for new drug approval. The potential for repurposing existing drugs as antagonists for novel cancer protein targets shows great promise and should be a more frequently explored option by pharmaceutical companies worldwide.

For more Articles on : https://biomedres01.blogspot.com/
Tuesday, May 17, 2022

Uncommon Cutaneous Solitary Reticulohistiocytoma: A Case Report

Uncommon Cutaneous Solitary Reticulohistiocytoma: A Case Report

Introduction
The histiocytosis are a group of diseases associated with the exacerbated immune response of macrophages/monocytes. There is still no consensus regarding their morphological classifications and clinical presentations [1,2]. The most common and studied histiocytosis are Langerhans cell histiocytosis and hemophagocytic lymphohistiocytosis. The others are collectively called Non- Langerhans Cell Histiocytosis (NLCH) or rare histiocytosis [3]. Among the NLCH, Reticulohistiocytosis (RH) can present in a multicentric, diffuse cutaneous, or solitary pattern [4,5]. Solitary Reticulohistiocytoma (SRH) presents as a solitary papule or nodule with a reddish or yellowish hue. It affects mainly the skin and mucous membranes, being first described by Zak in 1950 [5-7]. SHR is a rare condition, and its prevalence has not yet been established [8]. With this in mind, we present below a rare case of SRH in a female patient from southern Brazil.

Case Report

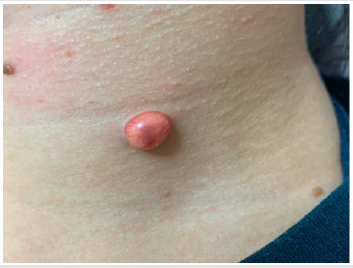
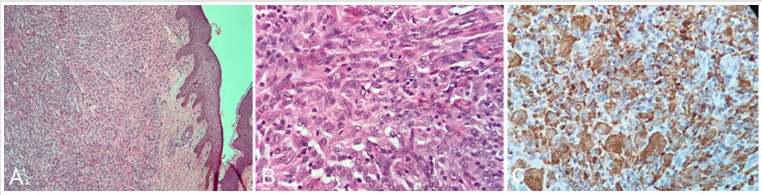
female patient, 34 years old, sought medical assistance due to an asymptomatic lesion in the left anterior cervical region, with rapid growth and spontaneous onset six months ago. The patient reported an attempt to remove the lesion because at first, she believed it was acne. Clinical examination identified a yellowish erythematous, with a brownish center, well circumscribed nodule, measuring 1.2 centimeters, presenting smooth surface, and telangiectasia in the periphery (Figure 1). On ultrasound examination of the cervical region, no lymphadenopathies or any other alterations were identified. Excision of the lesion for anatomopathological analysis was performed. The microscopic findings showed a proliferation of epithelioid cells in the dermis, with nodular architecture, and moderate inflammatory cell infiltration. No Touton giant cells were found (Figures 2A & 2B). The lateral and deep surgical margins were negative. Immunohistochemistry was carried out to define the histogenesis of the lesion. The epithelioid cells were positive for the CD68, in addition to a low proliferative index, assessed by ki67 (Figure 2C). Furthermore, the lesion was negative for CD1A, CD34, and S-100. The morphology and immunohistochemistry, as well as clinical data, were consistent with non-Langerhans cell histiocytosis, favoring reticulohistiocytoma.

Figure 1:Yellowish erythematous well circumscribed skin nodule in the left anterior cervical region.

Figure 2: a) Proliferation of epithelioid cells in the dermis, with nodular architecture (40x. H&E)

b) Detail showing epithelioid and admixed inflammatory cells (400x, H&E)

c) Strong and diffuse immunoreactivity for CD68 is observed in epithelioid cells (immunoperoxidase technique, 400x).

Discussion

Although it can be diagnosed in patients of any age, SRH affects mainly young adults, being more prevalent in males, making the case described above even more curious since the disease affected a female patient. [1,3,5,6,9,10]. SRH is a benign, localized disease induced by cytokines that cause a rare non-neoplastic proliferation of skin histiocytes, originated from the lineage of macrophages that react to yet unknown stimuli [4,5]. Clinically, the SRH presents itself as a single, firm, yellowish or reddish, asymptomatic skin nodule, measuring 0.5 to 2.0 centimeters, but usually smaller than one centimeter [1,10]. Its most common location is in the face, followed by neck and trunk, but can also be found in the mucosa. In our literature review, there are reports of trauma preceding these lesions, which could trigger the local inflammatory response. However, in most cases, a triggering factor for their development is not identified [1,4,5,10].

The diagnosis is based on the patient’s clinical history and the histopathological analysis. The microscopic findings show large histiocytes with eosinophilic cytoplasm in large quantities, with more purplish and amphophilic hues near the center of the histiocyte and lighter eosinophilic staining near the periphery [7]. Immunohistochemistry shows positivity for CD68 and CD163 and, in some cases, also for alpha-1-antitrypsin and lysozyme. The negativity of markers such as CD1a and S100 is essential for the differential diagnosis and exclusion of other histiocytosis [4,11]. Some studies concluded that SRH has clinical, histopathological, and immunohistochemical aspects similar to disseminated xanthogranulomas and multicentric reticulohistiocytosis [12,13]. Since these diseases present worse prognosis than SRH, and may require pharmacological therapy, including chemotherapy, it is essential to exclude these diagnoses. The definitive treatment for SRH consists of total resection of the lesion without the need for adjuvant therapies [1].

Conclusion
Despite the excellent prognosis of SRH, the early diagnosis of the disease is extremely important. Through morphology and immunohistochemistry, as well as clinical information, it is possible to rule out more aggressive histiocytosis which can negatively affect the patient’s quality of life, such as multicentric reticulohistiocytosis and Langerhans cell histiocytosis.

For more Articles on : https://biomedres01.blogspot.com/
Bridging the Gap Between COVID-19 and Subarachnoid Hemorrhage: A Case Report and Literature Review

  Bridging the Gap Between COVID-19 and Subarachnoid Hemorrhage: A Case Report and Literature Review Introduction The novel coronavirus was ...