Showing posts with label scientific research articles on biomedical. Show all posts

Friday, May 20, 2022

Estimation of Geographical Origin of Amfissis Cultivar Olive Oil Based on GC-FID/MS and Chemometrics

Estimation of Geographical Origin of Amfissis Cultivar Olive Oil Based on GC-FID/MS and Chemometrics

Introduction
Virgin olive oil (VOO) is produced from the fresh, immaculate olive fruits of Olea europaea L. employing mechanical and physical techniques [1]. VOO has grown in popularity amongst consumers due both to its pleasant qualities and its health benefits. These qualities are derived from the primary characteristics of olive oil such as phytosterols, tocopherols, and polyphenols, and the fact that VOO has elevated levels of monounsaturated fatty acids (MUFA), the principal element being oleic acid [2]. Disparities in geography, agronomy, and technology all contribute to variations in the chemical configuration of VOO. Moreover, geographically based compositional differences inform legislative initiatives, such as those designed to safeguard both the denomination of origin (PDO) and the protected geographical indication (PGI) [3,4]. The PGI and PDO certifications not only allow consumers to identify the areas where olive oil products were produced but also secures economic advantages for olive growers in regions that have been accorded specific designations.

VOO can be categorized according to both the region in which it is produced [5,6] and the cultivar of olive involved [7,8]. This classification is achieved using chemometrics combined with an array of data related to the composition of the oil, including its fatty acid (FA) content [9-11]. The profiles of FAs are primarily influenced by the relevant plant variety [12,13]. From the perspective of genetic diversity, monovarietal olive oils derived from specific varieties possess defined physical and biochemical characteristics that imbue the resultant oil with distinguishing qualities. Hence, FAs are highly important in the determination of the character and authenticity of VOO. The unique aromas of different VOOs are shaped by the presence of volatile compounds (VCs). The unique characteristics of different VOO volatiles are the consequence of both the ripening process and the enzymatic and chemical reactions which transpire during oil extraction and production. Volatile character and content are the product of an array of variables, including plant variety, geographical location, altitude, regional climate and temperatures, and technological considerations [14-17].

Greece is a major producer of olive oil. Figures published by Eurostat indicate that this country is the fourth largest olive oil exporter in the European Union [18]. Therefore, ensuring that the nation’s olive oil products accord with quality controls through effective regulatory and measuring processes is of immense economic significance to Greece. Moreover, it is essential that Greek olive oil retains consumer confidence by being accurately checked and authentically labeled since VOO is a product for which the value is closely allied to the manner in which it is produced and processed. The most frequently researched olive oil cultivar in Greece is the Koroneiki cultivar [5,9,19,20]. This means that other economically significant varieties have been overlooked including the Amfissis (or Konservolia) cultivar (Olea europaea var. med. rotunda) that is popular across large parts of Thessaly and Central Greece [21]. For this reason, the current study investigates the FA and VC content of VOO samples produced from the Amfissis cultivar originated from the Phocis region of Central Greece and the Magnesia region of Thessaly (Figure 1) using chemometrics. The aim of this study is to make a comparative evaluation of the samples from these two areas to identify the VOOs by their region, thereby rendering it possible to establish the regional authenticity of VOO in Greece.
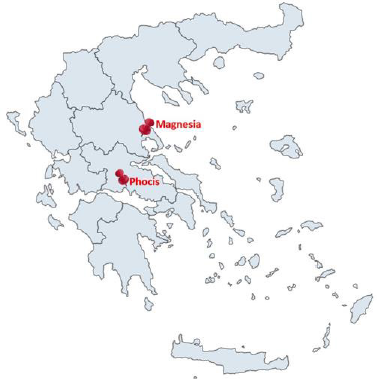
Figure 1: Map of Greece showing the location of Phocis and Magnesia regions of VOOs samples from the Amfissis olive oil cultivar.

Materials and Methods

Samples

A total of 29 VOO samples were obtained from local olive oil mills under the framework of the research program QuaAuthentic_ GR, during the 2018-2019 harvesting period. The VOO samples were originated from the geographical regions of Magnesia (16 samples) and Phocis (13 samples). Olives were picked by hand or collected in nets at the stage of maturity index 5–6 and processed in selected local olive mills using the three-phase system technology. Samples were collected from November to the end of January and stored in dark glass bottles of 500 mL. The analyses of VOOs were performed soon after the production of olive oil.

Determination of Quality Indices

All the quality indices were determined according to the official method of the Commission Regulation (EEC) No 2568/91 [22]. Free acidity was expressed as % oleic acid and peroxide value was expressed as meq O2/kg. K232, K270 and ΔK were calculated from the absorption at 232–270 nm.

Determination of Fatty Acids

Fatty acid methyl esters (FAME) were prepared according to the official method of the Commission Regulation (EEC) No 2568/91 [22]. FAME were prepared in a screwcap vial, by vigorous shaking of the olive oil solution in hexane (0.1 g in 5 mL) with 0.5 mL of 2 N methanolic KOH. The analysis was performed by gas chromatography utilizing a Perkin Elmer Clarus 500 chromatograph (Perkin Elmer, Waltham, MA, USA) with a flame ionization detector. The column used was Supelco SP-2560 capillary column (75 m × 0.18 mm id × 0.14 μm film thickness) (Supelco, Bellefonte, PA, USA). Helium was used as the carrier gas with a flow rate of 1.5 mL/min. The injection volume used was 1 μL and the injector was operated at 250°C in split mode (20:1 split ratio). The column was maintained at 140°C held for 5 min, heated to 170°C at a rate of 8°C/min, heated to 210°C at a rate of 2°C/min held for 2 min, heated to 250°C at a rate of 20°C/min and held to 250°C for 10 min. The FAs were identified based on their retention times, utilizing a FAME standard mixture (Sigma-Aldrich, St. Louis, MO, USA). The FA content was expressed as a percentage m/m from the peak area.

Analysis of Volatile Compounds

The volatile compounds of VOOs were determined by solid phase microextraction-gas chromatography-mass spectrometry (SPME/GC-MS) in accordance with the method of [19] with few modifications. Five grams of VOO and 1 μL of β-ionone (Alfa Aesar, Ward Hill, MA, USA) along with a micro-stirring bar were introduced into a 15 mL screw top glass vial with PTFE/silicone septa. The SPME procedure was carried out using a divinylbenzene/carboxen/ polydimethylsiloxane (DVB/CAR/PDMS) fiber (Supelco, Bellefonte, PA, USA) with 1 cm length. The vial was placed in a 50˚C water bath and stirred at 700 rpm. The VOO sample was equilibrated for 30 min. Subsequently, the needle of the SPME fiber was inserted into the vial and exposed to the headspace. After 15 min, the fiber was retracted from the vial and inserted into the gas chromatograph. The volatile compounds were analyzed using a Thermo GC-TRACE ultra, coupled with a Thermo Mass Spectrometer DSQ II (Thermo Scientific Inc., Waltham, MA, USA). The desorption conditions were as follows: GC inlet temperature of 260˚C for 3 min in the splitless mode with a 0.8 mm injector liner (SGE International Pty Ltd, Australia).

The column used was a Restek Rtx-5MS, 30 m x 0.25 mm x 0.25 μm (Restek, Bellefonte, PA, USA). Helium carrier gas flow rate was 1.0 mL/min. The column was maintained at 40˚C held for 6 min, then heated to 120˚C at a rate of 5˚C/min, then heated to 160˚C at a rate of 3˚C min, then heated to 250˚C at a rate 15˚C/min and held to 250˚C for 1 min. The conditions of mass spectrometer were: quadrupole temperature: 150˚C; source temperature: 240˚C; transfer line temperature: 290˚C; acquisition mode: electron impact 70 eV and mass range m/z: 35-650. The identification of VC was conducted by the comparison of spectral data and arithmetic index of the VC to those of the Wiley 275 mass spectra library and Adams [23]. Retention index (RI) values of VC were calculated using n-alkane (C8–C20) standards (Supelco, Bellefonte, PA, USA). Quantification of VC was accomplished by dividing the peak areas of the compounds by the peak area of the internal standard (β-ionone) and multiplying this ratio by the initial concentration of the internal standard. The peak areas were obtained from the full scan chromatograph using the total ion current.

Statistical Analysis

Prior to the performance of statistical analysis the data were standardized by the XLSTAT ver. 2020.3.1.0 software (Addinsoft Deutschland, Andernach, Germany). Shapiro-Wilk normality test, Spearman’s rho correlation coefficients and Principal Component Analysis (PCA) were accomplished utilizing the JMP software version 13.0 (SAS Institute Inc., Cary, NC, USA). The mean values and standard deviation of each parameter from the quality indices, FAs, and VCs were calculated in Microsoft Excel based on the samples of each region (n=16 for Magnesia and n=13 for Phocis).

Results

Conventional Quality Parameters

The analysis of conventional quality parameters is presented in Table 1. Free acidity of olive oil samples ranged from 0.54±0.22 to 0.16±0.04 and the peroxide values were between 13.69±5.36 to 18.02±1.97 meq O2/kg oil. K232 spectroscopic value of the samples used in this study ranged from 2.17±0.41 to 2.21±0.23, and the K270 values were between 0.15±0.04 and 0.18±0.07. ΔK was 0.00±0.00 for all samples analyzed. The refractive index of olive oil samples ranged from 1.469±0.000 to 1.470±0.000.
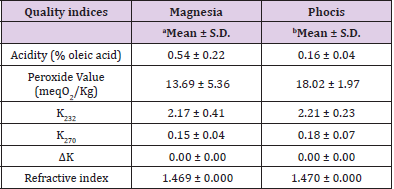
Table 1: Mean values and standard deviation (S.D.) of conventional quality indices of VOO samples from the Magnesia (n=16) and Phocis (n=13) regions.

Note: an= 16 samples; bn=13 samples.

Fatty Acid Composition

The analysis of FA composition revealed the presence of eleven FA (Table 2), with a small variance in composition as a result of the different geographical origin of VOOs. Oleic acid (C18:1) was the dominant FA for both Magnesia (75.15% ± 1.21) and Phocis (75.71% ± 1.99) regions. Slightly higher concentrations of palmitic acid (C16:0), α-linolenic acid (C18:3) and arachidonic acid (20:4) were observed in Amfissis VOO samples from the Magnesia region. The major saturated fatty acids (SFA) were palmitic acid (C16:0) determined in highest concentration in Magnesia (11.63% ± 0.48) and stearic acid (C18:0) with the highest concentration observed in the samples from the Phocis region (2.33% ± 0.21).
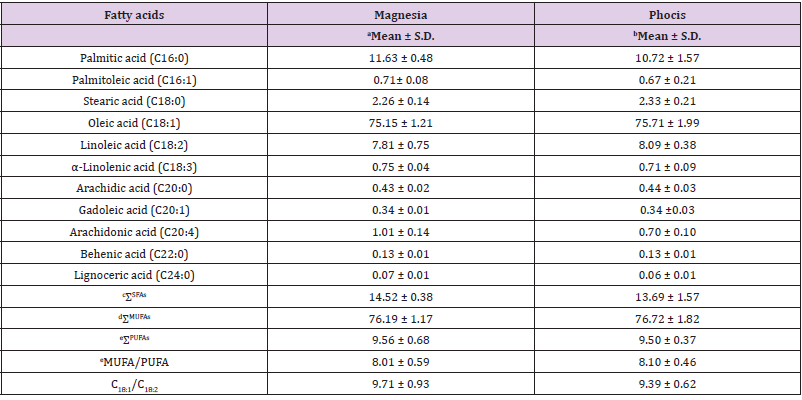
Table 2: Mean values and standard deviation (SD) of fatty acid composition (%) of VOO samples from the Magnesia (n=16) and Phocis (n=13) regions.

Note: an= 16 samples; bn=13 samples; cΣSFAs= Sum of Saturated Fatty Acids; dΣMUFAs = Sum of Monounsaturated Fatty Acids; eΣPUFAs: Sum of Polyunsaturated Fatty Acids; eMUFA/PUFA: Monounsaturated Fatty Acids/Polyunsaturated Fatty Acids.

Analysis of Volatile Compounds

The results from the determination of volatiles is presented in Table 3. Twenty six VCs (6 alcohols, 8 aldehydes, 2 ketones, 9 hydrocarbons, 1 ester) were identified and semi-quantified using the SPME-GC-MS technique. The prominent VCs from both geographical regions (Magnesia and Phocis) were (E)-2-hexenal, (E)-2-hexen-1-ol, 1-hexanol, (E)-β-ocimene and methylcyclodecane.
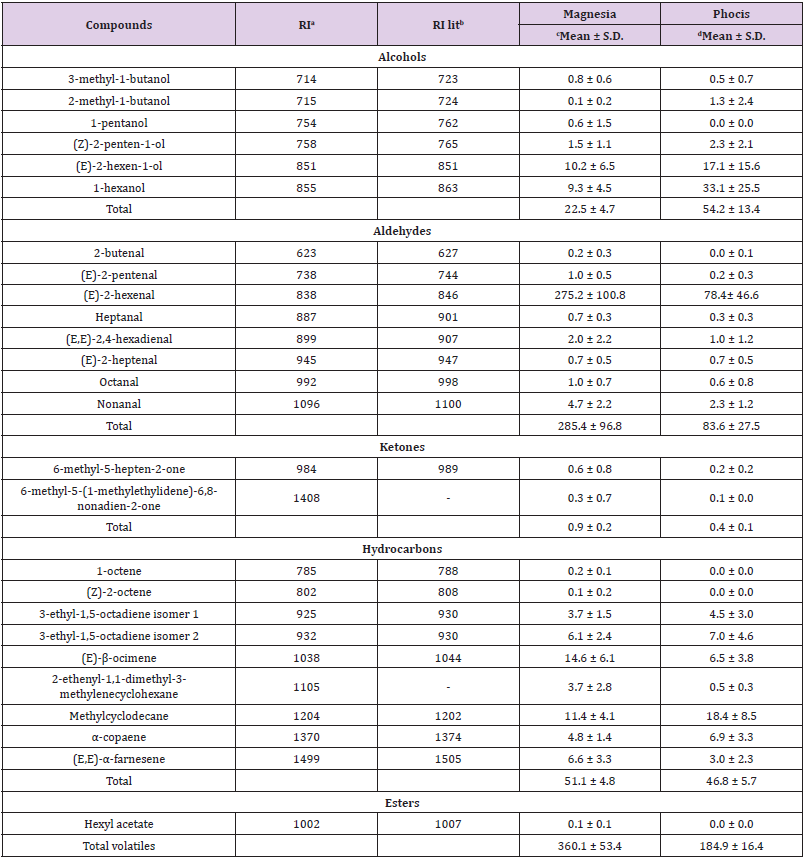
Table 3: Mean values (mg kg-1) and standard deviation (S.D.) of identified volatile compounds in Amfissis VOO samples originated from the Magnesia (n=16) and Phocis (n=13) regions.

Note: aRI = tentative identification by retention index; bRI lit. = literature retention index; cn= 16 samples; dn= 13 samples

Spearman’s rho Correlation Coefficients

Correlations among the FA and VC concentrations from the regions of Magnesia (Figure 2) and Phocis (Figure 3) were studied using Spearman’s rho correlation coefficients in order to highlight similarities and differences between the samples. The Spearman’s rho correlation coefficients were selected over Pearson correlation coefficients as small deviations from normality were observed using the Shapiro-Wilk normality test. Strong positive (p ≤ 0.01) correlation patterns were observed for the FA arachidic acid (20:0) – α-linolenic acid (18:3) and arachidic acid (20:0) – behenic acid (22:0), whereas strong negative correlation patterns were observed between gadoleic acid (20:1) – palmitic acid (16:0) in both regions. Regarding VCs, strong positive correlation patterns were observed between the two isomers of 3-ethyl-1,5-octadiene, as well as for (E)-2-hexen-1-ol and 1-hexanol, for the VOOs from Magnesia and Phocis regions. In the VOOs from the Phocis region, strong antagonistic relationship was recorded between palmitic acid (16:0) – oleic acid (18:1) and strong positive correlations were observed for the FA, α-linolenic acid (18:3) – behenic acid (22:0) and the VCs (E)-2-pentenal – 1-octene, (E)-2-pentenal – (Z)-2-octene, hexyl acetate – 1-octene, hexyl acetate-(Z) – 2-octene, α-copaene – methylcyclodecane and (E)-2-hexen-1-ol-(Z) – 2-penten-1-ol. Differences were observed in the VOOs from the Magnesia region. Strong positive correlations were recorded among the compounds: stearic acid (18:0) – arachidic acid (20:0), stearic acid (18:0) – behenic acid (22:0), behenic acid (22:0) – 6-methyl-5-hepten-2- one, 6-methyl-5-hepten-2-one – 1-pentanol, 6-methyl-5-hepten-2- one – hexyl acetate, hexyl acetate – 1-pentanol, (E)-2-hexen-1-ol – 1-hexanol, (E)-2-hexen-1-ol – heptanal and (E)-2-hexen-1-ol – methylcyclodecane. Strong negative correlation was found between palmitic acid (16:0) and hexyl acetate.
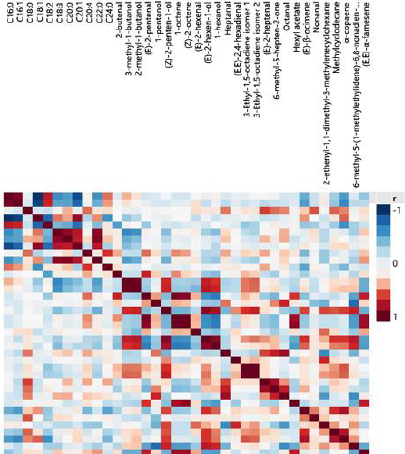
Figure 2: Color map on correlations among fatty acids and volatile compounds from Amfissis VOOs originated from the Magnesia region.
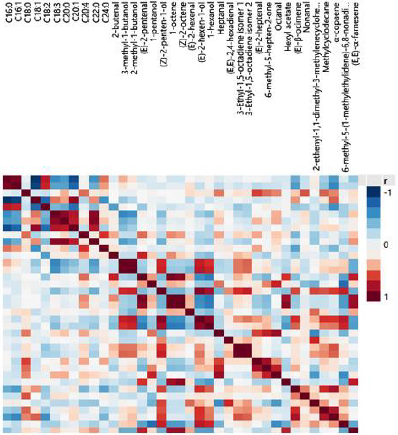
Figure 3: map on correlations among fatty acids and volatile compounds from Amfissis VOOs originated from the Phocis region.

Principal Component Analysis

PCA was used to study possible grouping of VOO samples according to their geographical origin. Based on the data obtained from the FA composition the first two principal components (Figure 4) explained 67.9% of the total variance. According to the scores plot (Figure 4a), a separation of samples to a certain extent has been achieved, although it is evident that several VOOs from Phocis are classified in Magnesia region. The first two principal components contribute in the differentiation of samples, though the second principal component distinguishes the VOOs to a greater extent (Figure 4a). The FAs that mainly contribute in the separation of samples at the first principal component (Figures 4b & 5) are gadoleic acid (20:1), palmitic acid (16:0), behenic acid (22:0), palmitoleic acid (16:1), arachidic acid (20:0) and oleic acid (18:1). In the second principal component the most important FAs are lignoceric acid (24:0) and arachidonic acid (20:4). Strong negative correlations between palmitic acid (16:0) – oleic acid (18:1) and palmitic acid (16:0) – gadoleic acid (20:1) were observed in the loadings plot (Figure 4b), confirming the Spearman’s rho correlations reported in this study. An efficient separation was observed from the application of PCA on the concentrations of VCs (Figure 6a). The first two principal components explained the 47.2% of the total variance. From the scores plot (Figure 6b) we observed that the majority of the VCs are positively correlated which also confirms the Spearman’s rho coefficients reported previously. The first principal component is the most important for the separation of VOOs. The VCs that mainly contribute in the separation of samples are 1-hexanol, (E)-2-pentenal, heptanal, (E)- 2-hexenal and (E,E)-α-farnesene (Figures 6b & 7).
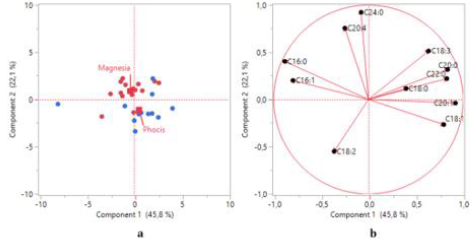
Figure 4: a) Scores plot and

b) loadings plot obtained from principal component analysis of VOO samples based on fatty acid composition.
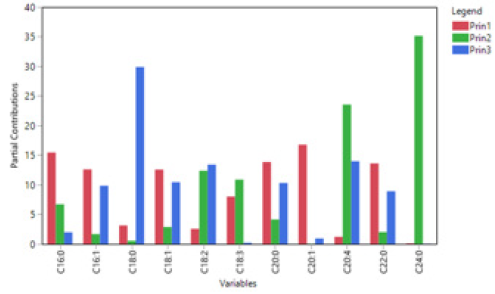
Figure 5: Partial contribution of fatty acids in the first three principal components.
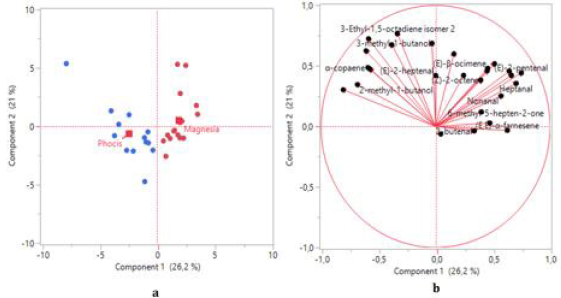
Figure 6:

a) Scores plot and

b) loadings plot obtained from principal component analysis of VOO samples based on volatile compounds.
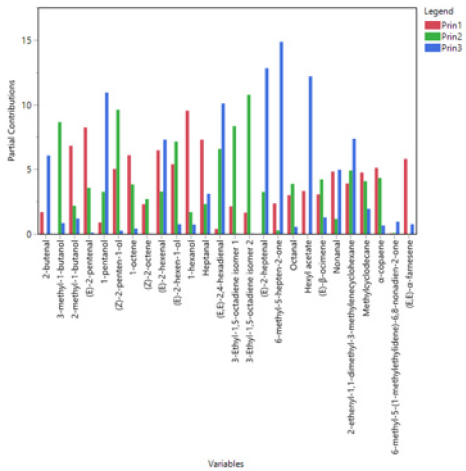
Figure 7: Partial contribution of volatile compounds in the first three principal components.

Discussion

Conventional Quality Parameters

The quality parameters of samples (Table 1) were within the limits described in Commission Regulation (EEC) No 2568/91 [22] for extra virgin olive oil (EVOO) and VOO. Free acidity of samples was within the limits of ≤ 0.8 and ≤ 2.0 for EVOO and VOO, respectively, while the peroxide values were in accordance with the limits of ≤ 20 meq O2/kg for EVOOs and VOOs. Limits for the spectroscopic values K232, K270, and ΔK according to EEC No 2568/91 are ≤ 2.50, ≤ 0.22, and ≤ 0.01 for the EVOO, and ≤ 2.60, ≤ 0.25, and ≤ 0.01 for VOO. Therefore the samples were classified as VOOs.

Fatty Acid Composition

The % mean values of FA of VOO samples were within the limits of the international olive oil council [24]. High levels of MUFA/ PUFA and oleic/linoleic acid (C18:1/C18:2) were observed in both regions indicating the high performance of VOOs against oxidative deterioration [25]. Limited research exists for the FA composition of olive oil from Amfissis cultivar. In a study from Andreou, et al. [26] the shelf-life of VOO extracted by non-thermal pretreatments from Amfissis, Tsounati and Manaki cultivars was evaluated. The oleic acid (18:1) and linoleic acid (18:2) levels for the olive oil samples from the Amfissis cultivar using the traditional olive oil extraction technology were 70.68% and 12.66%. In our study higher levels of oleic acid (18:1) and lower levels of linoleic acid (18:2) were observed in VOOs from both Magnesia and Phocis regions.

Analysis of Volatile Compounds

The flavor of VOO is attributed to a wide range of VC important for its quality assessment. Previous research reports indicated that the aldehydes exist in higher concentrations in olive oil compared to other flavor compounds [27]. This fact is confirmed in the current study since the total concentration of aldehydes determined in this study was 285.4 ± 96.8 mg kg-1 for Magnesia region and 83.6 ± 27.5 mg kg-1 for Phocis region, which is mainly attributed to the high levels of (E)-2-hexenal, a C6 aldehyde formed through the lipoxygenase pathway (LOX) pathway. This compound is responsible for the characteristic “green note” of olive oil [28]. The high levels of (E)-2-hexenal has been previously observed. In an earlier study of Greek olive oil it is reported that Amfissis olive oil samples had the highest concentration of (E)-2-hexenal compared to Koroneiki and Megaritiki olive oil samples [7]. However, the flavor of olive oil is not exclusively defined from the high concentrations of VCs. Other constituents, such as alcohols, ketones and esters are contributing in the flavor as well. The C6 alcohols (E)-2-hexen-1-ol and 1-hexanol were the most prominent alcohols in this study which are produced through the LOX pathway and provide the characteristic “green” aroma and astringent-sour flavor of olive oil [29]. The fruity, sweet flavor is a result of the hexyl acetate whereas the presence of 6-methyl-5-hepten-2-one, formed from the degradation of terpenic alcohols, is responsible for the pungent and fruity odor of olive oil [28,29]. High levels of the terpenes (E)-β-ocimene and (E,E)-α-farnesene were detected in VOOs from Magnesia. These compounds are biosynthesized via the mevalonic acid pathway and are highly dependent on the botanical origin [30,31].

Spearman’s rho Correlation Coefficients

The results obtained from the Spearman’s rho correlation coefficients of FA may be attributed to the variance of activity of the enzymes called fatty acid desaturases that regulate the biosynthesis of FAs during the maturation of olives. Oleic acid (18:1) and linoleic acid (18:2) are inversely connected in a way that the increase of the one FA will induce the decrease of the other. The first FA that is produced during biosynthesis of FAs is palmitic acid (16:0), which is converted to stearic acid (18:0). Subsequently, the FAs oleic acid (18:1), linoleic acid (18:2) and α-linolenic acid (18:3) are produced by the catalyzing activity of FA desaturases (stearoyl-ACP Δ9-desaturase, oleate desaturase, linoleate desaturase) [32-34]. The strong positive correlation between arachidic acid (20:0) and stearic acid (18:0) has been previously reported from Stefanoudaki, et al. [9] and Kritioti, et al. [35] who studied olive oil samples from Koroneiki, Mastoides and Cypriot cultivars.

Principal Component Analysis

PCA is a multivariate chemometric tool that is commonly used in classification problems. Gurdeniz, et al. [11] effectively applied the PCA method for the geographical separation of olive oil samples of Turkish origin, based on FA composition. The authors reported the FAs palmitoleic acid (16:1), oleic acid (18:1), linoleic acid (C18:2) and α-linolenic acid (C18:3) as the most significant for the differentiation of samples. In a study of Sicilian olive oils the PCA method was also successfully applied for the geographical differentiation and the FAs palmitoleic acid (16:1), oleic acid (18:1) and linoleic acid (C18:2) were the most influential variables for the separation of samples [10]. The high contribution of palmitoleic acid (16:1) for the geographical differentiation of samples is also confirmed in the present study. As previously mentioned, efficient separation of VOO samples from Phocis and Magnesia regions has been achieved in the current study based on the aldehydes (E)-2-pentenal, (E)-2-hexenal, and the alcohol 1-hexanol. These compounds are produced through the LOX pathway which involves the enzymes lipoxygenase and hydroperoxide lyase that oxidize and cleave, respectively, polyunsaturated fatty acids such as linoleic acid (18:2) and α-linolenic acid (C18:3) to yield aldehydes. The aldehydes are then reduced to alcohols by the enzyme alcohol dehydrogenase [36]. 1-hexanol is produced from the polyunsaturated FA linoleic acid (18:2), while the aldehydes (E)-2-pentenal and (E)-2-hexenal are produced from the oxidation of α-linolenic acid (C18:3).

Aldehydes are considered as important compounds for the authentication of olive oil. Şişik Oğraş, et al. [6] reported an effective geographical separation of olive oil samples of Turkish origin from various locations (Mediterranean, Aegean, Southeastern Anatolia, Marmara, and the Black Sea) based on volatile composition. Aldehydes, and especially (E)-2-hexenal were the most significant compounds for the separation of samples. Vichi, et al. [37] used PCA for the differentiation of VOOs from two geographical areas of Northern Italy. The authors concluded that aldehydes, including (E)-2-hexenal, exhibited a strong dependence on geographical origin of samples, therefore indicating the influence of environmental growth conditions on the activity of the enzyme alcohol dehydrogenase. The aldehyde heptanal, a product derived from the oxidation of linoleic acid (18:2) [38], was also a significant VC for the classification of VOOs. The sesquiterpene hydrocarbon (E,E)-α-farnesene is another important VC for the geographical differentiation of VOOs in the current study which is produced through the mevalonic acid pathway [31]. Terpenes can be useful markers for the authentication of geographical origin [39]. Terpenoid hydrocarbons have been effectively used for the geographical separation of extra virgin olive oils from West Liguria with the application of the PCA method [40].

Conclusion
In the present work, the analysis of the fatty acid composition and the volatile compounds profile of VOO samples of Amfissis cultivar originated from the Magnesia and Phocis regions was performed and studied using chemometrics. The high levels of MUFA (76.19% for Magnesia and 76.72% for Phocis) and MUFA/ PUFA ratio (8.01% for Magnesia and 8.10% for Phocis) indicate the potent high oxidative stability of the VOOs from this cultivar. The volatile compounds profile from both regions was characterized by the high concentration of aldehydes, especially (E)-2-hexenal, a compound that provides the characteristic “green note” of olive oil. The determination of Spearman’s rho correlation coefficients between fatty acids and volatile compounds was performed separately for the two regions and eventually revealed various differences and similarities possibly associated with the enzymes responsible for the metabolism of fatty acids and the production of the volatile compounds by different metabolic routes. The application of PCA algorithm on FAs content was not very effective for the geographical separation of samples. However, a clear separation of VOOs was obtained based on the composition of the volatile compounds. The aldehydes (E)-2-pentenal, heptanal, (E)-2-hexenal, the alcohol 1-hexanol, and the sesquiterpene (E,E)- α-farnesene had the highest contribution for the differentiation of VOOs according to geographical origin. The present research study highlights the unique characteristics of Greek olive oil and promotes the endeavors for its authentication.

For more Articles on : https://biomedres01.blogspot.com/

Tuesday, May 17, 2022

Acceptance of COVID 19 Vaccine in India

 Acceptance of COVID 19 Vaccine in India

Short Communication
The COVID-19 pandemic caused by severe acute respiratory syndrome coronavirus 2 (SARS-CoV-2) has infected more than 108 million people in over 150 countries. In Malaysia, as of February 15, 2021, more than 261,805 confirmed cases with 958 deaths had been reported [1,2]. The pandemic continues to threaten the healthcare system with catastrophic economic, education, and social consequences worldwide [3,4]. Currently, no curative treatment exists for COVID-19 infection [5-7]. Therefore, a safe and effective prophylactic vaccine is urgently needed to contain the pandemic, which has had devastating medical, economic, and social repercussions [8]. To date, several vaccines have been developed and approved for emergency immunisation [9-11]. This has given a glimpse of hope for preventing the spread of COVID-19 infection. This study sought to assess the acceptance of the COVID-19 vaccine among the general population of Kashmir.

Objective

The acceptance of the COVID-19 vaccine among the general population of Kashmir

Methods

This cross-sectional study was conducted from May 15-30, 2021. A door-to-door survey in conducted in two areas (one rural and one urban) following all standard operating procedures. The data was collected according to a predesigned checklist and entered in Excel sheets. Data was analyzed by SPSS 20 software.

Inclusion Criteria

The target participants were adults aged 18 years and above.

Exclusion criteria

Those who did not gave informed consent and refused to participate in the survey.

Results

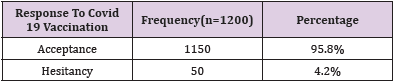
A total of 1200 completed responses were collected. Most respondents acquired information regarding COVID-19 through social media (85.0%), mass media (90%), friends and family (70.3%) and HCWs (79.0%). COVID-19 vaccine acceptance (95.8%) was substantially higher than hesitance (4.2%). Hesitant respondents reported they were concerned about the side effects (40%), safety and lack of information regarding the vaccine (20%). Some were not willing to accept vaccination due to religious (8.8%) and cultural (4.8%) reasons, belief in traditional remedies (3%) and fear of injection (16.1%).

Discussion

Herd immunity is also known as ‘population immunity’. For herd immunity to occur, the population coverage required through vaccination varies across diseases and is dependent on the basic reproduction number (R0), vaccine efficacy and duration of immunity [12]. The proportion of the population that must be vaccinated against COVID-19 to begin inducing herd immunity is unknown. Thus, the challenge to determine the sufficient proportion of the population to create such immunity by mass vaccination remains. Nevertheless, the larger the number of vaccinated individuals, the better the immune coverage. Vaccination is recognized as an effective way to reduce and eliminate the burden of COVID-19. However, the success of a vaccination programme depends on the willingness of the population to be vaccinated. Out of 1200 respondents, the acceptance rate of the COVID-19 vaccine was 95.8%, much higher than the hesitance rate (4.2%). (Table 1) This acceptance rate corresponds to studies conducted among the general population in Indonesia, China, Europe, and Saudi Arabia [13-16].

Table 1: COVID-19 vaccine acceptance (95.8%) was substantially higher than hesitance (4.2%).

Conclusion
The acceptance rate of the COVID-19 vaccine among the Kashmiri population who participated in this study was high.

For more Articles on : https://biomedres01.blogspot.com/
Wednesday, May 11, 2022

Inflamyar™ Possesses Anti-Inflammatory Effect on Human Immune Cells and Cytokine Expression In Vitro

Inflamyar™ Possesses Anti-Inflammatory Effect on Human Immune Cells and Cytokine Expression In Vitro

Introduction
Since virtually all organisms are constantly exposed to the influences of the living environment, the immune system has a great importance for the physical integrity of humans. It protects against threatening external influences such as infestation by microorganisms and parasites, but also against threats from the inside of the body, like e.g. necrotic and apoptotic cell material as well as functionally degenerated cells [1,2]. The human immune system is made up of several components. A distinction is made between a cellular and a humoral part. The cellular immune system comprises highly specialized immune cells that are either mobile (e.g. in the blood) or located in various tissues, e.g. Monocytes, Granulocytes, B cells, T cells, NK cells. The humoral immune system is the part of the immune system based on plasma proteins (antibodies, complement factors and cytokines) [2,3]. Upon induction of an immune response, humoral components of the immune system are initially released by the cells located in the affected tissue. By secreting these factors, other immune cells are lured to the focus of infection [2,3]. The inflammatory response in the body is important for the resolution of the cause of the inflammation but is also the cause of the symptoms of the disease [4]. The immune response is not entirely specific to its cause; even healthy tissue is always damaged [5].

This is especially important when an acute inflammation becomes a chronic inflammation that does not succeed in elimination of the trigger. For example, this may be due to the presence of debris in the tissue or frequent overload of muscles and joints. This persisting inflammation can massively damage the surrounding, primarily healthy tissue [6,7]. The damage of healthy tissue leads to severe pain reactions in both acute and chronic inflammatory reactions [5,8]. Moreover, chronic inflammation can lead to neoplasms (carcinomas or lymphomas) in many organs and in the lymphatic tissue and promote their growth and vascularization. Causes include the chronic proliferation stimulus, the growth-promoting effects of cytokines and the genomic damage caused by reactive oxygen species produced by immigrated immune cells [9-11]. In such situations, use of anti-inflammatory agents to assist and reduce the side effects of inflammation is useful [12,13]. Among the most widely used anti-inflammatory drugs include i.e., synthetic substances such as cyclooxygenase inhibitors, steroids, immunosuppressants and cytokine inhibitors [14,15]. These substances are usually proven to be extremely effective - but in part also show a wide range of unwanted side effects [16-18]. For this reason, the active ingredients from classical medicinal plants are increasingly becoming the focus of research.

In particular, secondary plant metabolites are in the interest of science since these have been in use in traditional medicine for many centuries and thus relatively safe and side effects associated with their use often relatively low [19-23]. Plant metabolites have a wide range of pharmacological effects, such as high antioxidant, antiviral, anti-inflammatory and carcinogenic activity [24-26]. Antiinflammatory ingredients such as alkaloids, phenols, flavonoids, glycosides, terpenes, quinones, catechins and carbohydrates of aqueous extracts from various traditional herbs have been described in several studies [25,27-29]. Besides of direct antiinflammatory actions, an interaction with immunological signal cascades, such as the reduction of proinflammatory mediators by inhibiting transcription factors of gene expression (Nuclear Factor κB, Inhibitor of κB), has already been demonstrated for some of these substances [30-32]. These modulatory effects of plant substances are particularly interesting for research. The individual effects of active ingredients from plant extracts are very diverse and have so far been described inadequately. For this reason further investigations are mandatory. In this study, the anti-inflammatory effect of Inflamyar™, a commercially available homeopathicspagyric product consisting of plant extracts from Arnica montana, Bryonia cretica, Guajacum, Toxicodendron quercifolium, Bellis perennis, Ledum palustre, Ruta graveolens and Viscum album was evaluated.

Materials and Methods

All experiments were conducted by NIS Labs, Klamath Falls, USA.

Test Substance

The test substance, Flamyar™, is a homeopathic spagyric natural remedy manufactured by PEKANA Naturheilmittel GmbH (Kißlegg, Germany) and distributed in the USA under the name Inflamyar™. The test substance was developed for the treatment of sports injuries, sprains, joint problems, bruises, and muscle strains. Active ingredients are Arnica montana spag. Peka Dil. D12, Bryonia cretica spa. Peka Dil. D4, Guajacum Dil. D4, Toxicodendron quercifolium Dil. D12, Bellis perennis spag. Peka Dil. D8, Ledum palustre Dil. D4, Ruta graveolens spag. Peka Dil. D6, Viscum album spag. Peka Dil. D4.

Reagents

Histopaque1077 and Histopaque1119, RPMI1640, 200mM l-glutamine, antibiotics, fetal bovine serum, BSA (bovine serum albumin), fibronectin, and PBS (phosphate buffered saline) were purchased from Sigma-Aldrich (St. Louis, MO, USA). Sodium azide (NaN3) was acquired from LabChem, Inc. (Pittsburgh, PA, USA). CD3 (peridinin chlorophyll protein), CD25 (brilliant violet 421), CD56 (phycoerythrin) and CD69 (fluorescein isothiocyanate), antibodies as well as heparin vacutainers were ordered from BD Biosciences (Franklin Lakes, NJ, USA). The protein multiplex array (27-Plex human cytokine Bio-Plex Pro™) was obtained from Bio- Rad Laboratories Inc. (Hercules, CA, USA).

CD69 Activation Marker Expression on Human Leukocyte Subsets

Peripheral whole blood from human healthy adult donors (n=3) was obtained upon written informed consent approval by the Sky Lakes Medical Center Institutional Review Board, Federalwide Assurance 2603. Heparinized blood samples were placed on gradient solution (Lympholyte-Poly) and centrifuged at 450 × g for 35 minutes. The layer containing PBMC (peripheral blood mononuclear cells) was separated, washed twice with 10 ml PBS (without Ca / Mg) and resuspended in RPMI 1640 (containing 10% fetal calf serum, l-glutamine and antibiotics (P/S) at a cell density of 106/ml. Two parallel culture conditions were used:

a) Adding of serial dilutions of test product without any other stimuli to test the direct immune modulating effect

b) Adding of serial dilutions of test product, followed by addition of an inflammatory insult in the form of bacterial endotoxin LPS (lipopolysaccharide), to assess the ability of test product to reprogram the human immune cells to respond differently to inflammatory stimuli.

Triple cultures were established for each test condition. Negative controls (untreated cell cultures) were established with n=6. Positive control cultures (2x n=3), n=3 containing 10 ng / ml LPS and n=3 containing 100 IU / ml IL-2 for immune cell activation via two different ways.

After an incubation time of 24 hours at 37°C and 5% CO2, blood cells were isolated and stained for 15 min with fluorochromeconjugated monoclonal antibodies at suppliers recommended concentration and then analysed via Attune acoustic-focusing flow cytometer (Thermo Fisher Scientific). Data analysis was performed using electronic gating based on cell size and granularity to distinguish lymphocytes and monocytes, allowing separate analysis of CD69 expression on lymphocyte subsets opposed to monocyte/ macrophage cell subsets. The subpopulation of lymphocytes was then analysed for CD69 expression on CD3-CD56+ NK cells. Costaining with CD3 and CD56 allowed further detailed analysis of four separate lymphocyte subpopulations, namely CD3-CD56+ NK cells, CD3+ CD56- T lymphocytes, and CD3+CD56+ NKT cells. The combination also allowed us to analyze the CD3-CD56- non-T non-NK lymphocytes for activation markers. For each of these populations we examined the expression level of the CD69 activation marker.

Cytokine Production in Peripheral Blood Mononuclear Cell Cultures

Cell culture supernatants were obtained from 24-hour culture setup described above. Expression levels of the following cytokines were tested: Interleukin (IL)-1β, -1ra, -2, -4, -5, -6, -7, -8, -9, -10, -12 (p70), -13, -15, -17, eotaxin, basic Fibroblast Growth Factor (FGF), Granulocyte-Macrophage Colony Stimulating Factor (GMCSF), Granulocyte-Colony Stimulating Factor (G-CSF), Interferon γ (IFN-γ), interferon γ -Induced Protein 10 (IP-10), Monocyte Chemoattractant Protein 1 (MCP-1), Macrophage Inflammatory Protein (MIP)-1α, MIP-1β, Platelet-Derived Growth Factor (PDGF)- BB, Regulated On Activation, Normal T Cell Expressed And Secreted (RANTES), Tumor Necrosis Factor (TNF)-α, and Vascular Endothelial Growth Factor (VEGF). The assay was analysed using magnetic protein multiplex arrays (BioPlex, Bio-Rad Laboratories Inc.) and xMAP technology (Luminex, Austin, TX, USA).

Statistical Analysis

Calculations and statistical analysis was performed using the two-tailed, independent t-test using Microsoft Excel.

Results

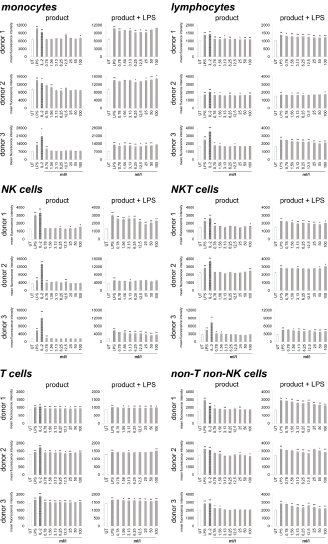
Immune cells harvested from human peripheral blood were used as a model for potential activities on immune activating and modulating. On the one hand, the direct activation of immune cells by the test substance, and on the other hand, the priming of immune cells to respond differently to a subsequent inflammatory insult was analyzed. Therefore, two sets of cell cultures were examined in parallel, on the one hand the highly inflammatory bacterial LPS from Escherichia coli and on the other hand the recombinant Interleukin-2 (IL-2) for activation was used as a positive control, and LPS was additionally used in one of the two cultures to induce inflammation after treating the immune cells with the test substance. As indicator for immune cell activation, the activation marker CD69 (cluster of differentiation 69) was chosen. In the case of lymphoid activation, CD69 is the earliest inducible surface glycoprotein and leads to lymphocyte proliferation and signal transmission at the cellular level [33,34]. Incubation of the cell culture with the test product (Figure 1) led to a slight increase in CD69 expression on monocytes (-6.3 to 28.8%) and lymphocytes (0.8 to 10.2%). Either no effect or else a slight increase was seen on Natural Killer (NK) cells (-4.1 to 24.7%), Natural Killer T (NKT) cells (-6 to 14.3%), non-T non-NK lymphocytes (-4.3 to 12.5%) and T cells (2.8 to 8.6%).

Figure 1: CD69 expression on immune cells in 24-hour cultures of peripheral blood mononuclear cells treated with products alone (column “product”) or pretreated with product prior to the addition of the inflammatory insult LPS (column “product + LPS”) plotted as CD69 mean fluorescence intensity. Statistical significance is indicated on the bar graph (*p<0.05, **p<0.01).

Under inflammatory conditions, treatment of cultures with the test product led to a reduced CD69 expression in monocytes of all three donors at lower concentrations of the test product (-0.4 to 14.4%). The highest concentrations of the test substance showed an induced expression of CD69 up to 5.9%. The lymphocytes possessed a reduction of CD69 expression from -2.7 to 19.19% for all three donors. A 38.6 to 42.0% reduction was seen in NK cell activation for both donor 1 and donor 3; donor 2 also showed a reduction in NK cell activation but the response was more variable (ranging from -1.1 to 12.0%). Incubation of NKT cells with the test product prior to LPS stimulation resulted in a -6.3 to 19.2% reduction of CD69 expression for all three donors. T cells possessed a slight reduction in CD69 expression for both donor 1 and donor 3 (-0.2 to 5.3%); donor 2 showed a slight increase in T cell activation (5.3%) at the highest dose tested with no change at lower concentrations of the test product. CD69 expression in non-T non-NK lymphocytes showed a 2.0 to 24.0% reduction in CD69 expression for all three donors. A dose-dependency was seen for donor 1 and donor 3 on NK cells, NKT cells and lymphocytes; on T cells only for donor 3 and for all donors in non-T non-NK cells.

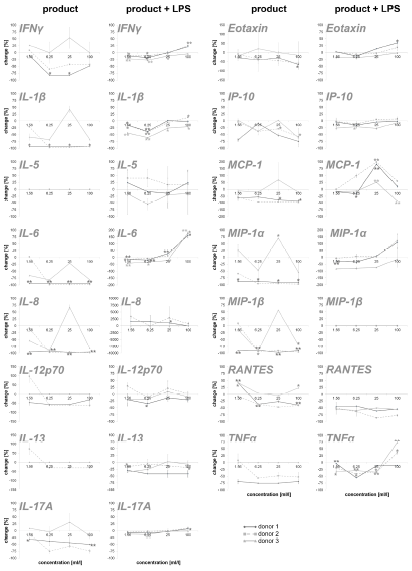
To obtain an overview of the effects of the test substance on the humoral components of the immune system, the test substanceinduced cytokine expression changes were analyzed on PBMC. In this part of the study, on the one hand, the direct effect of the test substance on PBMC cultures and, on the other hand, the effect of pre-incubation of PBMCs with the test substance and subsequent inflammatory stimulus (LPS) were tested. The exposure of immune cell cultures to the test substance without a subsequent inflammatory stimulus (LPS) resulted in a reduction in the cytokine IL-6 up to 98.9% (Figure 2). For two out of three donors (donor 1 and donor 2) the exposure of immune cell cultures to the test product resulted in consistent decreases in the following proinflammatory cytokines: INF-γ (8.5 – 82.2%), IL-1β (21.6 – 97.5%), IL-8 (8.6 –98.4%), IL-12p70 (46.5 – 61.4%; except lowest doses on cells of donor 2), IL-17A (12.0 – 75.7%), Eotaxin (28.4 – 65.4%; except lowest doses on cells of donor 2), IP-10 (3.9 – 74.7%), MCP-1 (55.0 – 97.7%), MIP-1α (58.8 – 97.3%), MIP-1β (13.8 – 97.2%; except lowest doses on cells of donor 2), RANTES (9.1 – 47.6%; in donor 1 and 2) and TNFα (52.4 – 75.6% in donor 1 and 2). The exposure of PBMC cultures to the test substance resulted in a reduction in the cytokine IL-13 in cultures from one donor (29.6%, without lowest dose) and no change in cultures from the other two donors. No change was seen for the cytokine IL-5 in PBMCs exposed to the test substance.

Figure 2: Percent change in proinflammatory cytokine levels in PBMC culture supernatants of three donors treated with serial dilutions of the test product in absence (column “product”) and presence (column “product + LPS”) of a subsequent inflammatory stimulus. Samples without inflammatory stimulus are compared to untreated control cultures; samples with inflammatory stimulus are compared to LPS-control (*p<0.05; **p<0.005).

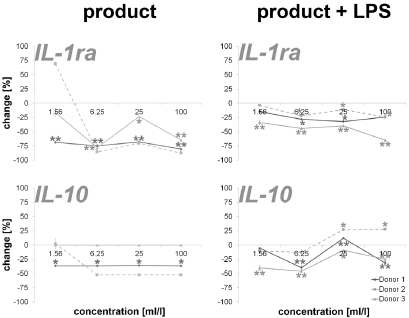
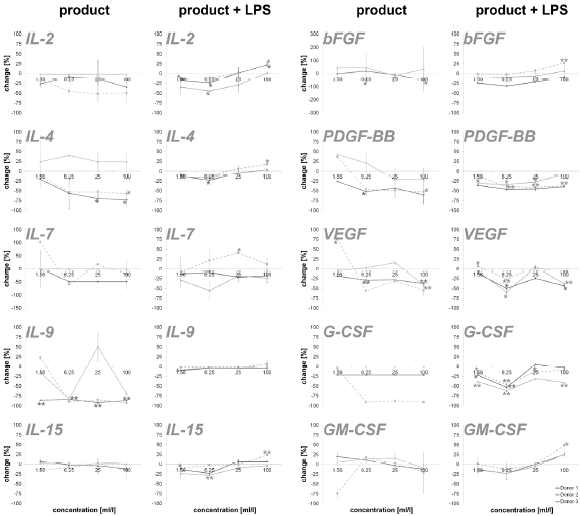
An incubation of PBMCs with the test substance resulted in a reduction of the anti-inflammatory cytokines IL-1ra (16.2 – 87.4%; except lowest doses on cells of donor 2) and IL-10 (35.8 – 52.2%; except lowest doses on cells of donor 2). The data is shown in Figure 3. Measuring cytokines with pro- and anti-inflammatory properties (Figure 4), the following reactions could be assessed: For two out of three donors (donor 1 and donor 2) the exposure of immune cell cultures to the test substance resulted in consistent decreases in IL-2 (8.6 – 51.9%), IL-4 (13.0 – 72.8%), IL-9 (85.1 – 92.5%; except lowest doses on cells of donor 2) and IL-15 (-8.0 – 16.2%) levels. The exposure of immune cell cultures to the test substance led to variable effects on IL-7 (-102.9 – 60.0%) levels. In the group of growth factors (Figure 4), for two out of three donors (donor 1 and donor 2) the exposure of PBMCs to the three highest doses of the test substance resulted in consistent decreases in PDGF-BB (26.2 – 60.3%; except lowest doses on cells of donor 2), VEGF (18.9 – 56.2%; except lowest doses on cells of donor 2) and G-CSF (18.9 – 56.2%; except lowest doses on cells of donor 2). Variable effects were detected in bFGF (-44.9 – 55.4%) and GM-CSF (-20.0 – 74.1%) levels. In total, a clear dose-dependency of cytokine expression could be seen in IL-17A, Eotaxin MCP-1, RANTES, IL-1ra, IL-4, IL- 15, bFGF, PDGF-BB, VEGF and GM-CSF in a minimum of two donors.

The exposure of PBMCs to the test substance with a subsequent inflammatory stimulus (LPS) led to consistent decreases in IL-13 (2.4 – 34.9%) and RANTES (43.8 – 85.7%). An incubation with the three lowest doses of the test substance led to consistent decreases in the following cytokines: INF-γ (0.0 – 26.3%), IL-1β (-1.4 – 41.4%), IL-17A (-9.1 – 7.8), IP-10 (-6.4 – 27.6%) and TNF-α (4.2 – 41.4; except highest doses on cells of donor 2 and 3). A consistent biphasic response, i.e. increases at higher doses and decreases at lower doses of the test substance, was seen for IL-6 (-177.4 – 19.3%) and Eotaxin (-35.2 – 12.8%). Variable effects were detected on IL-5 (-40.8 – 55.4%), IL-8 (-3356.6 – 79.8%), IL-12p70 (-97.6 - 58.8%), MCP-1 (-98.8 – 42.6%) and MIP-1α (-123.2 – 79.3 %) levels and no effects were seen on MIP-1β levels (Figure 2). Consistent decreases in IL-1ra (3.9 – 64.7%) and variable effects on IL-10 (-27-6 – 45.8%) levels were detected in PBMC cultures (Figure 3). The exposure of immune cell cultures to the three lower doses of the test substance led to consistent decreases in the following cytokines: IL-2 (12.0 – 44.5%), IL-4 (9.1 – 23.3%), IL-9 (1.8 – 10.2%) and IL-15 (2.8 – 27.9%); variable effects were found on IL-7 levels (-40.7 – 29.0%).

Under inflammatory conditions, the exposure of PBMC cultures to the test substance led to a decreased concentration of bFGF (9.3 – 24.4%; except donor 2), PDGF-BB (7.8 – 46.3%) and GM-CSF (-0.3 – 23.0%; except highest dose) in a concentration dependent manner. The growth factors VEGF (-7.5 – 58.8%) and G-CSF (-5.9 – 61.6%) showed variable results with a decrease in cytokine expression in two of three donors. According to the results from stimulation of PBMC without inflammatory stimulus, very consistent responses were seen for all three donors (Figure 4). Also in this group, a dosedependent cytokine expression was found in IFN-γ, IL-1β, IL-6, IL- 17A, Eotaxin, IP-10, MIP-1α, TNFα, IL-2, IL-4, IL-9, IL-15, PDGF-BB, GM-CSF and IL-10.

Figure 3: Percent change in anti-inflammatory cytokine levels in PBMC culture supernatants of three donors treated with serial dilutions of the test product in absence (column “product”) and presence (column “product + LPS”) of a subsequent inflammatory stimulus. Samples without inflammatory stimulus are compared to untreated control cultures; samples with inflammatory stimulus are compared to LPS-control (*p<0.05; **p<0.005).

Figure 4: Percent change in levels of cytokine with pro- and anti-inflammatory capacities and growth factors in PBMC culture supernatants of three donors treated with serial dilutions of the test product in absence (column “product”) and presence (column “product + LPS”) of a subsequent inflammatory stimulus. Samples without inflammatory stimulus are compared to untreated control cultures; samples with inflammatory stimulus are compared to LPS-control (*p<0.05; **p<0.005).

Discussion

In the present study, stimulation of immune cells with the test substance was done in the presence and absence of a subsequent inflammatory stimulus. Thereafter, CD69 expression, i.e., the activation of immune cells, was measured along with the cytokine expression. The data show no effects or only a slight induction of CD69 expression after stimulation of the immune cells with the test substance in the absence of an inflammatory stimulus. With the exception of the T cells, the immune cells showed only isolated inductions of CD69 expression compared to untreated controls. These inductions were distributed over the entire concentration spectrum of the test substance and no dose-dependency was seen. In addition, a reduced expression of proinflammatory cytokines was measured in groups without subsequent inflammatory insult. Noteworthy here is the particularly strong reduction of IL-1β, IL-6, IL-8, MIP-1α, MIP-1β and TNFα. The anti-inflammatory cytokines and growth factors also show a regulation in this context; in relation to the proinflammatory cytokines, however, this is more moderate. This suggests a shift of pro- and anti-inflammatory cytokines activity ratio towards an anti-inflammatory level. Together, the findings from CD69 and cytokine expression indicate an antiinflammatory effect of the test substance.

Upon incubation of immune cells in the presence of a subsequent inflammatory stimulus, a reduction in immune cell activation could be demonstrated for most of the samples in two out of three donors, indicating an anti-inflammatory effect of the test substance also under inflammatory conditions. Correlatively, a reduced expression of cytokines and growth factors the doses of 1.56 to 25 ml/l of test substance was measured. Interestingly, the results show an induction of cytokine expression in a concentration range of 25 to 100 ml/l of test substance, in particular of proinflammatory cytokines. This biphasic effect of the test substance (cytokine reduction at low levels and induction at high concentrations) is in contrast to the reduction of CD69 expression at this concentration. An association between reduced CD69 expression at high doses of the test substance and increased cytokine expression at the same dose, in addition to the shift in the balance between pro- and anti-inflammatory cytokines seen in the previous experiments, indicates an additional anti-inflammatory mechanism of action of the test substance. However, further investigations are needed to verify this.

Unfortunately, not all donors in this study showed an equal response to the test substance. In view of the individual variations in the immune status of the donors (e. g. genetic and epigenetic aspects, potential pre-existing conditions), high deviations in the data from primary cells of different donors are not unexpected [35- 37]. From this point of view, the results of this study are relatively consistent. The observed dose-dependent regulation of the CD69 and cytokine expression of individual groups clearly underlines the validity of the data. In addition, the data generated in this study is consistent with previously published data from other workgroups. For example, a significantly reduced in vitro LPS-induced expression of TNFα, IL-1 and IL-6 from the human whole blood culture and RAW-264.7 cells showed Mahajan et al. after incubation with different dilutions of A. montana and Bryonia species (6CH, 30CH, 200CH) [38]. Lussignoli et al. showed a significant reduction in systemic IL-6 expression in a traumatic animal model after the use of a homeopathic preparation containing A. montana and other plant extracts and minerals [39]. In another study, T. quercifolium in dilutions of 6CH, 12CH, 30CH and 200CH appeared to interfere with an histamine, prostaglandins and other inflammatory mediators driven inflammatory processes [40]. Anti-inflammatory actions due to inhibition of both lipoxygenase and cyclooxygenase metabolic pathways were also seen in homeopathic remedy containing A. montana and T. quercifolium [41]. Porozov et al. described reduced IL-1β, TNFα and IL-8 secretion without an effect on human T cell and monocyte proliferation by a homeopathic remedy containing A. montana and B. perennis [42]. In addition, various studies showed anti-inflammatory properties of various extracts out of A. montana [43-48], Bryonia species [48-50], T. quercifolium [40,51,52], B. perennis [53], L. palustre [54,55], R. graveolens [56-60] and V. album [61-65], which are also contained in the test substance of this study. In summary, the data of the present study possesses a clear antiinflammatory effect and thus a potential for the test substance for the treatment of acute or chronic inflammatory reactions.

For more Articles on : https://biomedres01.blogspot.com/
Friday, May 6, 2022

Transperineal Prostate Biopsies Under Local Anesthesia: Initial Experience

Transperineal Prostate Biopsies Under Local Anesthesia: Initial Experience

Introduction
Since their initial description in the early 1980s [1], echoguided PB has been commonly performed by the transrectal approach. The transperineal approach has been rarely proposed - even though many reports suggested its non-inferiority in terms of diagnostic performance [2-5] mainly because of the poor tolerance, requiring general anaesthesia and thus hospital management. Despite antibiotic prophylaxis with oral fluoroquinolone, the main complications of transrectal PB are acute prostatitis, reported in 2.8% of cases [6]. Several publications recently suggested that severe post-PB sepsis rate increased over the past decade [6,7]. In addition, some reports suggested an increase of fluoroquinolone resistance, leading to a higher mortality rate [7-9]. Several solutions have been proposed to reduce the risk of sepsis, such as rectal disinfection [10] or the systematic performance of prebiopsy coprocultures in order to adapt the antibiotic prophylaxis to each individual case. Coproculture is now recommended by the European Association of Urology (EAU) for patients at risk of sepsis [11], but this organization in routine care limit the adherence of urologists to this practice. The transperineal approach could be an alternative to reduce this infectious risk.

The transperineal approach has received renewed interest in recent years due to the development of focal treatments for prostate cancer, which are performed mostly by transperineal approach [12]. Using the same approach for diagnosis, characterization and then treatment may be more relevant. Furthermore, the development of fusion and biopsy guidance software has made the technique of targeted PB reliable and accurate, regardless of the approach, transrectal or transperineal [13-17]. The main obstacle to the widespread use of transperineal PB remains its poor tolerance, which has motivated its use under general anesthesia until now. We have recently started our experience in performing transperineal PB under LA, in consultation. The objective of this work was to report the feasibility and tolerance of these PBs, performed by a single operator, during the first three months of his experience.

Patients and Methods

Patient Selection

Since November 2020, all patients with an indication for prostate biopsies in our center were offered transperineal biopsies under local anesthesia as an alternative to the transrectal approach. This work reports the initial experience, over a three-month period, of a single operator. In case of a suspicious image on MRI (PIRADS score 3), targeted biopsies were performed in addition to systematic sampling.

Technique

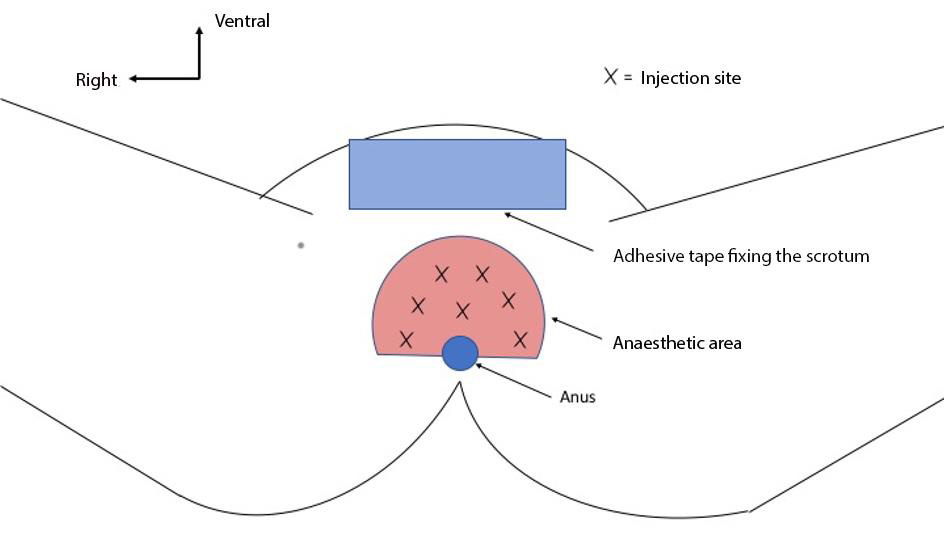
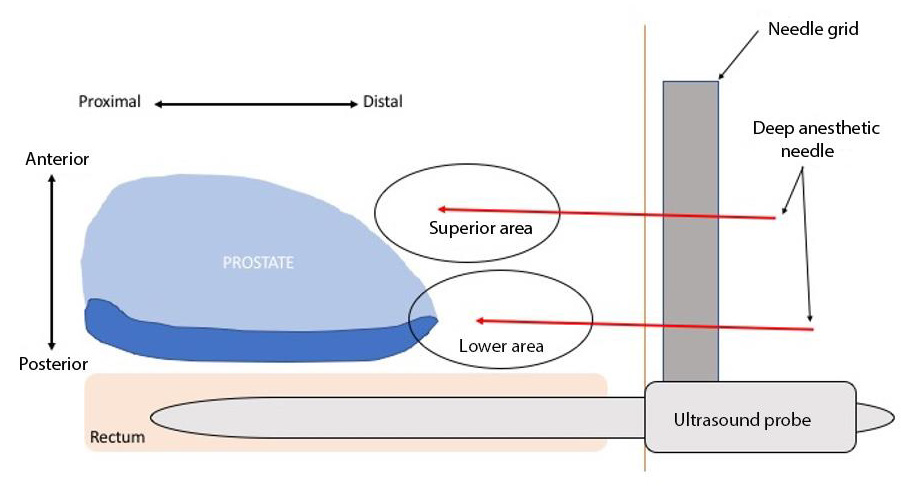
All patients received antibiotic prophylaxis with Ofloxacin in a single dose of 200 mg per os. A rectal enema was performed a two hours before biopsies. The biopsies were performed in a consultation room. The patient was installed in the gynecological position. The articulated arm used to stabilize the probe was attached to the examination table. A 0.5% lidocaine solution was prepared by diluting 40mL of 1% lidocaine in 40mL of saline. Subcutaneous anesthesia was performed by injection of approximately 10 mL of lidocaine solution. The area of anesthesia extended in a hemi-disc, centered on the anus, of approximately 5 cm radius (Figure 1). After skin anesthesia, the ultrasound probe was inserted, after having been attached to the stabilization arm. The anesthesia of subcutaneous tissues was performed under ultrasound control using a Chiba 22ga needle of 20cm length. During the progression of the needle from the subcutaneous tissues to the prostate, an injection was performed approximately every 5 mm. After injecting the lidocaine solution in the lower medial sagittal area, the injection was repeated in the upper medial sagittal area (Figure 2). The same protocol of injections was repeated in the left para-sagittal area and then in the right para-sagittal area, for a total of 6 injection points of local anesthesia. In patients with an MRI target of PIRADS≥3 score, the operator started with 3 to 4 targeted biopsies. All patients underwent systematic biopsies (Figure 3).

Figure 1: Schematic of the injection area for local skin anesthesia.

Figure 1: Median sagittal section diagram of subcutaneous anesthetic areas during transperineal biopsies under local anesthesia.

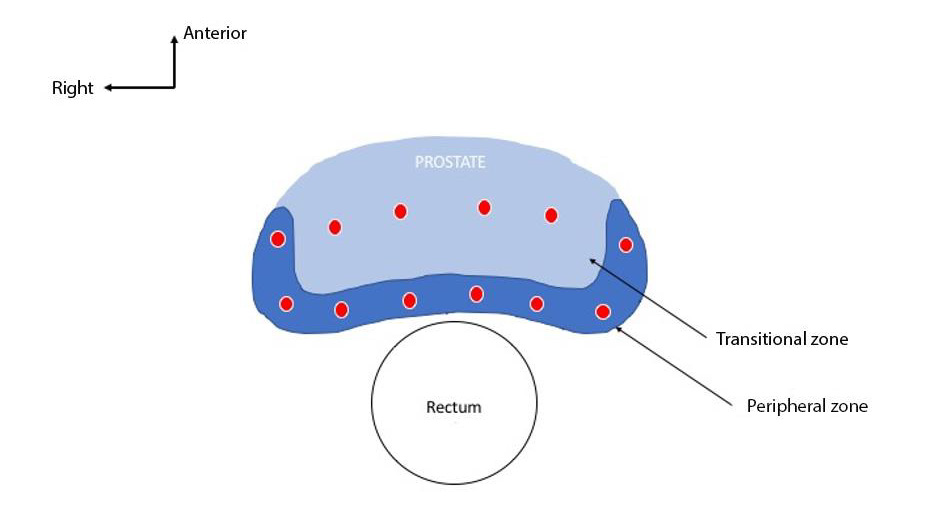
Figure 3: Axial section of transperineal systematic biopsy protocol.

Data Collection and Analysis

All data were collected prospectively. The different stages of the procedure were timed. The maximum level of pain was assessed during the procedure and 1 minute after the last biopsy, using a numerical scale ranging from 0 (no pain) to 10 (maximum pain possible according to the patient). Categorical variables were described in terms of absolute numbers and percentage, n(%). Quantitative variables were described in terms of median, expressed with the first and third quartile, m[q1; q3].

Results

Characteristics of the Population

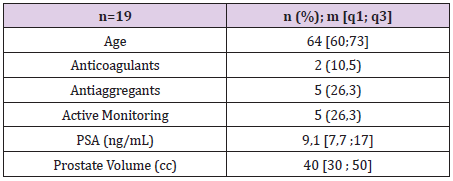
19 patients were included. The characteristics of the population are summarized in Table 1. The 5 patients under active surveillance protocol had PBs at least 6 months before the procedure.

Table 1: Characteristics of the population. Proportions are expressed as absolute numbers and percentages -n(%)- and continuous variables as medians -m[q1; q3].

Data Collected During the Procedure

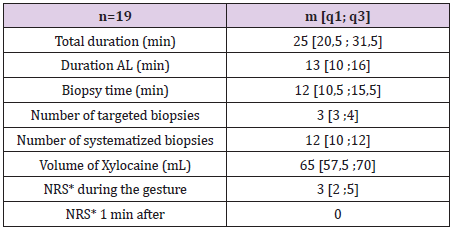
All procedures were performed completely using the transperineal approach, without any adverse event. No conversion to transrectal biopsy was required. The data collected per procedure are summarized in Table 2.

Table 2: Data collected during the biopsy procedure.

Note: *NRS: Numerical scale evaluating the patient’s pain, rated from 0 to 10.

Histological Analysis

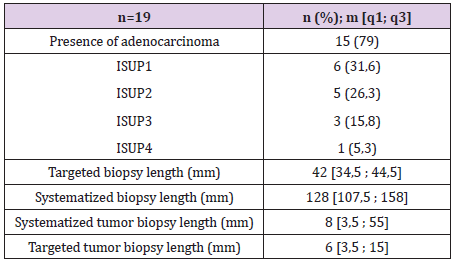
Prostate cancer was diagnosed in 15 (79%) patients. The results of the histological analysis are summarized in Table 3. No Clavien-Dindo≥2 score complications were reported within 30 days. No unusual symptoms were reported.

Table 3: Results of histological analysis of core biopsies.

Discussion

Our preliminary results suggest that transperineal prostate biopsies are feasible, with a good tolerance, in a consultation setting. No procedure had to be interrupted, and no adverse events were observed. Subsequently, no Clavien-Dindo>1 complications were reported by patients within 30 days. The median maximum pain reported during the examination was 3/10 [2;5]. These results seem comparable to these obtained with transrectal approach. Indeed, a study of nearly 200 patients rated the median pain of transrectal biopsies at 2.5 on a similar scale [18]. These results also seem comparable with recent series evaluating the transperineal approach under local anesthesia, with scores ranging from 2/10 to 5/10 [19-22]. Even if this median score of 3/10 seems acceptable, we observed heterogeneous results. Indeed, one patient reported a pain score of 6/10 and three other patients reported a score of 5/10. These pain scores do not seem acceptable for this type of diagnostic examination, and a larger study should confirm that these are exceptional situations, or related to the beginning of the experiment.

In addition, two patients felt no pain and two others felt very little pain at 1/10. These cases confirm that the analgesia technique used can be totally effective and allow a comfortable procedure. The patients who reported pain at some point of the procedure felt it mainly during the local anesthesia. The most painful moment was the introduction of the needle through periprostatic tissues. The majority of patients in our study described no pain at the time of biopsy punctures, and no pain after the procedure. These results are concordant with recent studies, which suggest the anesthetic procedure as the potentially painful stage of the procedure [19-22]. In addition, two of the three patients who previously underwent transrectal biopsies (active surveillance), reported less pain during transperineal biopsies compared to transrectal appraoch. One of the questions that currently arises is the comparison of the tolerance of the two approaches. To our knowledge there are no comparative trials in the literature.

Even if pain is probably the main point of the evaluation of the tolerance of the technique, the length of the procedure seems to us just as relevant, for the comfort of the patient, and on a larger scale in terms of accessibility of care and overall cost. In our study, the median length of the procedure was 25 [20 ;31] min. The duration was more than 30 min at the very beginning of our experience and then about 20 min for the last procedures. The recent work of Marra et al. also evaluated the length of procedures using a similar technique in 450 patients [19]. The median duration was 18 [15;22] min. It is therefore likely that the experience of the operator allows the duration of the procedure to be reduced, and thus optimizes patient comfort. The median duration of the LA procedure, was 13 [10;16] min, which corresponds to about half the duration of the procedure. In our experience, we observed that an AL procedure lasting less than 10 min did not provide optimal analgesia. This may reflect the minimal time required for effective analgesia, which could be explained by the time delay of action of lidocaine. In the work of Marra et al, the median duration of the anesthetic procedure was 3 [2;4] min, which could explain a high median pain of 5/10 [19].

One of the potential advantages of the transperineal approach is reduction of infectious risks. This risk is about 3% [6], it is greater in patients having iterative biopsies, which are nevertheless necessary in the context of active surveillance protocols, or surveillance after focal treatment [15]. In the series by Marra et al. the authors did not report any infection. The patients were nevertheless treated with fluoroquinolones, which may be debatable given the absence of rectal puncture. Another study that evaluated a series of 577 patients who received cephazoline as a single dose did not report any cases of post-biopsy prostatitis [15]. Finally, a smaller series of 45 patients who received no antibiotic prophylaxis reported no cases of infection [23]. A recent report using Norwegian social security data showed an increase in mortality related to infectious complications of prostate biopsies related to fluoroquinoloneresistant E. coli. The Oslo University Hospitals are now in the process of changing their PB protocol in favor of the transperineal approach [8].

Only a prospective randomized study will confirm that transperineal PB without antibiotic prophylaxis reduces the risk of infection compared to transrectal PB with antibiotic prophylaxis. No patient in our study had urinary retention. Other series report a low rate, less than 1% [21,22]. It is possible that this difference could be explained by a our relatively limited population . Other series have reported rates above 1%, but the procedures were performed under general anesthesia, which independently increases the risk of retention [15]. The main limitation of our study is related to the small number of patients. Our work was designed to evaluate the technical feasibility, and therefore does not present sufficient data to evaluate the infectious risk, nor the biopsy yield. Nevertheless, it allows us to conclude that transperineal PB under LA is feasible, and that the initial experience is not associated with a particular risk for the patient. The surgeon had a short training with another experienced surgeon before starting his own procedures. The experiment went on without any accidents, conversions, or adverse events.

Conclusion
Our results suggest that transperineal PB under LA is feasible and safe, in consultation, from the initial learning period.

For more Articles on : https://biomedres01.blogspot.com/
Faba Bean Varieties Response to Phosphorus Application on Yield and Yield Components at Kulumsa Area of Tiyo District, Arsi Zone, South-Eastern Ethiopia

  Faba Bean Varieties Response to Phosphorus Application on Yield and Yield Components at Kulumsa Area of Tiyo District, Arsi Zone, South-Ea...