Tuesday, August 31, 2021

The Potential Efficacy of Broussonetia Kazinoki Stem Extract to Show Antioxidant Property or Suppress Collagenase Activity


The Potential Efficacy of Broussonetia Kazinoki Stem Extract to Show Antioxidant Property or Suppress Collagenase Activity

Introduction

Broussonetia Kazinoki (Siebold) is a kind of tree belonging to the Rosaceae family. It grows mainly in the mountain side of the shore but has been cultivated many times in recent years. The bark is the material that makes the paper, and the fruit and stem are used as a medicinal material, and the young leaves are eaten [1-4]. According to the ancient Chinese medicine book, the leaves of B. kazinoki are effective in the treatment of edema, and the stems of B. kazinoki can be used for the treatment of symptoms such as rubella and poor urination. In this study, we report novel efficacy of B. kazinoki stem extract (BKSE) to show antioxidant property or inhibit collagenase activity. Antioxidants are a very important means of protecting the living body by eliminating the toxic effects of active oxygen [5]. If the living body cannot adequately remove active oxygen due to lack of antioxidants, various diseases and aging progress rapidly. Antioxidant enzymes naturally present in the human body include superoxide dismutase (SOD), glutathione and peroxidase [5]. First, we investigated whether BKSE displays a cytotoxic effect on human kidney epithelial cells (HEK-293T). Cytotoxic effect by BKSE on HEK-293T cells was not observed, suggesting that BKSE does not have a negative effect on human cells (Figure 1). The DPPH (1,1-diphenyl-2-picrylhydrazyl) radical scavenging assay provides an easy and rapid way to evaluate potential antioxidants. Our DPPH radical scavenging assay suggests that BKSE has an excellent effect on removing DPPH free radicals (Figure 2). Therefore, our results suggest that BKSE has excellent antioxidant activity.

Figure 1: HEK-293T cells were treated with BKSE (0– 100μg/mL), and cell viability at 24h was determined using the MTS colorimetric assay. Error bars represent SD from three biological replicates.

Figure 2: DPPH radical scavenging assay using BKSE (5.5mg/mL). Ascorbic acid was used as a positive control. Error bars represent SD from three technical replicates.

Collagenase is an enzyme of the matrix metalloproteinase family that breaks down collagen and destroys extracellular matrix [6]. Collagen is an abundant structural protein present in animals. Collagenase has a direct effect on skin elasticity and wrinkles through the breakdown of collagen that makes up the skin cell connective tissue. We investigated whether BKSE inhibits collagenase activity. The results showed that BKSE is able to effectively inhibit collagenase activity (Figure 3). BKSE can inhibit the activity of collagenase to properly maintain the collagen content of the skin, thereby adding the elasticity of the skin. Therefore, this work suggests that BKSE can be used as a natural product to prevent wrinkle formation in the skin. In conclusion, BKSE shows excellent antioxidant activity and inhibits collagenase activity. These results indicate that BKSE might be used a raw material for cosmetics to suppress skin wrinkles.

Figure 3: BKSE inhibits collagenase activity in vitro. Collagenase inhibition activity assay was performed using Enzchek collagenase assay kit following the manufacturer’s instruction. Error bars represent SE from three technical replicates.

Materials and Methods

MTS (3-(4,5-dimethylthiazol-2-yl)-5-(3-carboxymethoxyphenyl)- 2-(4-sulfophenyl)-2H tetrazolium) assay in HEK-293T cells. The B. kazinoki stem was dried and extracted using EtOH (70 %) for 24 hours. The MTS assay was performed as described previously [7]. Briefly, the cells were seeded in a 96-well (2 × 10⁴ cells/well) and treated with different doses of BKSE for 24 h. After incubation, 20μL of the MTS working solution (2 mg/mL in PBS) was added to each well and incubated at 37°C for 4h. Absorbance at 490nm was measured using a microplate reader (PerkinElmer) and cell viability was determined as the percentage of MTS reduction, assuming the absorbance of control cells as 100%.

DPPH Radical Scavenging Assay

DPPH radical scavenging assay was performed as described previously with minor modifications [7]. Briefly, the reaction mixture contained 100μL of BKSE and 0.1 mM DPPH solution. The mixture was incubated for 30 min at 37°C, and then the activity was measured spectrophotometrically at 517nm. The blank was 100 % (v/v) ethanol. DPPH scavenging effect was calculated using the following equation:

DPPH scavenging effect (%) = {(A0-A)/A0} X 100.

Where A0 is the absorbance of negative control (0.1 mM DPPH solution) and A is the absorbance in presence of BKSE.

Collagenase Inhibition Activity Assay

Collagenase inhibition activity assay was performed using EnzChek Collagenase Assay Kit (Molecular Probes) following the manufacturer’s instruction.

Acknowledgments

This research was supported by the Ministry of Trade, Industry & Energy (MOTIE), Korea Institute for Advancement of Technology (KIAT) through the Encouragement Program for The Industries of Economic Cooperation Region.

Conflicts of Interest

The authors report no conflicts of interest.

Ethical Approval

This article does not contain any studies with human participants or animals performed by any of the authors. 

For more Articles:  https://biomedres01.blogspot.com/


Epidemiological Characteristics of Women Participating in Breast Cancer Screening by Bach Mai Hospital


Epidemiological Characteristics of Women Participating in Breast Cancer Screening by Bach Mai Hospital 

Introduction

Breast cancer is the most common cancer in women worldwide. It is also the leading cause of death among women globally. According to GLOBOCAN 2012, in Vietnam, breast cancer - the most common cancer in women - is ranked as the third cause of cancer death, after liver and lung cancer. Moreover, breast cancer is more common in female over the age of 40. Furthermore, 6-19% of breast cancer cases have a genetic nature. Several genes, for example BRCA1, BRAC2, PTEN, and PT53, are found to be related to breast cancer. In addition, other non-genetic components, such as age, gender, reproductive history, menopause, menstruation, hormone replacement therapy, obesity, smoking, benign breast disease, might also contribute as the risk factors of breast cancer [1-2]. Breast cancer is a curable disease with early diagnosis and a positive treatment strategy. Therefore, screening for early breast cancer is important to increase the curable rate which improves the quality of life for patients as well as reduces the mortality rate. In Vietnam, The Nuclear Medicine and Oncology Center participated in 04 breast cancer screening programs for over 30-year-old Vietnamese women, in which there are 03 programs hosted by Ministry of Health and Bright Future Foundation and 01 program coordinated with Ha Tinh General Hospital. Based on the results of these programs, we conduct a study with these following aims:

a) Describe the epidemiological characteristics of women participating in the breast cancer screening program at Bach Mai Hospitaland

b) Evaluate the results of screening programs for breast cancer screening.

Patients and Methods

Study Population

A descriptive cross-sectional study was conducted among 4250 women at the age of 30 years and older who participated in the breast cancer screening from 2015 to 2017 at The Nuclear Medicine and Oncology Center – Bach Mai Hospital.

Data Collection

A structured questionnaire consisted of two parts: Demographic information and the outcome of breast cancer examination. The collected demographic information included Age, Hometown, Educational level, Occupation, Marital status, history of cancer.

The outcome of breast cancer examination was assessed by using the following criteria:

a) Clinical assessment

b) Ultrasound image

c) Mammography results (if necessary)

Using these indicators, the outcomes of breast examination were divided into two groups: Normal and Abnormal. The Abnormal group was comprised of women with the diagnosis of both breast abnormalities and breast cancer.

Data Analysis

Data were analyzed using Statistical Package for Social Science Version 16.0 software, SPSS. Data were summarized using number and percentage for qualitative variables. Chi-square and Fisher’s Exact test were used to examine the related factors of breast abnormalities, re-screening, and breast self-examination status. A p-value less than or equal to 0.05 was considered statistically significant.

Ethical Approval

All procedures performed in studies involving human participants were in accordance with the ethical standards and with the 1964 Helsinki declaration and its later amendments or comparable ethical standards. Our study was approved by Science and Ethics Council of Bach Mai hospital. A verbal consent was obtained from all participants before filling the questionnaire.

Results

Out of 4,250 women participating in screening, the majority came from Hanoi (accounting for 50.2%). In addition, most of the subjects had an educational level of high school or higher (70.7%), working mostly as public administrators (30.5%) and currently married (89. 6%) (Table 1). Women who had a history of breast cancer and a family history of breast cancer only accounted for 4.7% and 5.5% of all women in the screening (Table 2). The study results showed that most women in the screening were from the age of 40 to 49 with 1884 women, accounting for 44.3%, followed by the age of 50 to 59, with 1267 women, accounting for 29.8 %. The lowest group was the 60 years old and above group, with 369 women participating in the screening, accounting for 8.7%.

Table 1: Demographic characteristics of women participating in the screening program.

Table 2: Patients’ history of breast cancer.

In 2016 and 2017, 1775 women were interviewed about their previous screening experience. The number of women re-screened in 2016 and 2017 was still limited, with 142 people, accounting for 8% of all women screened in 2016 and 2017 (Table 3). After the screening in 2015, the proportion of women re-screening in 2017 was 1.69 times higher than in 2016 (p <0.05). In addition, the results of the study also showed that there was a statistically significant difference in the rate of re-screening between different occupations, educational background, and history of cancer. The screening rate for women with a high school diploma or higher was 1.94 times higher than for those with lower education. Women having a personal or a family history of cancer were recorded with a higher re-screening rate of 1.88 and 2.12 times than those without a history of cancer (Table 4). After 3 years of screening among 4250 women, the results showed that 811 women were diagnosed with breast abnormalities, accounting for 19.1%.

Table 3: Age distribution of woman in the screening program.

Table 4: The relationship between re-screening rate and related factors.

* p<0.05, Chi-square test

In 2015, 2016 and 2017, the newly detected breast cancer cases were 6 cases, 5 cases, and 3 cases, respectively (Table 5). The incidence of breast abnormalities was statistically significant among age, family history of cancer, occupation, BMI, menopause and abortion status (Table 6). Among 4250 women screened, only 4151 women agreed to answer questions regarding monthly breast self-examination. Only 25.8% of answered women performed monthly breast self-examination (Table 7). The results of the above table showed that the percentage of women performing breast selfexamination increased over the years, age groups and occupations. This difference was statistically significant with p-value<0.05 (Table 8). The results of the above table indicated that the rate of breast self-examination in the re-screening group was nearly 20% higher than that of the first-time screening group. This difference was statistically significant with thep-value<0.05 (Table 9).

Table 5: Breast abnormalities detection rate.

Table 6: The relationship between breast abnormalities detection rate and related factors.

* p<0.05, Chi-square test

Table 7: Percentage of breast self-examining.

Table 8: The relationship between breast self-examining rate and related factors.

* p<0.05, Chi-square test

Table 9: The relationship between breast self-examining rate and re-screening rate.

* p<0.05, Chi-square test

Discussion

Breast cancer screening is one of the Vietnam Ministry of Health’s strategies for cancer prevention. Breast cancer screening by clinical examination, breast ultrasound, mammograms make a huge contribution in early diagnosis and effective treatment of breast cancer. In three years from 2015 to 2017, the Nuclear Medicine and Oncology Center has participated in three breast cancer screening programs of the Ministry of Health in collaboration with the Bright Future Foundation and one breast cancer screening program in collaboration with Ha Tinh general hospital. Among 4250 women participating in screening, the majority came from Hanoi (accounting for 50.2%). In addition, most of the subjects had high school educational level and higher (70.7%), mostly working as public administrator (30.5%) and currently married (89.6%). This indicates that screening programs have reached to many women at the age of 40 and over, with different educational levels. However, our study also observed that women with higher level of education are more likely to access to screening program than those with lower educational level. In addition, the policy of universalizing education at all levels has reduced the number of the illiterate and women who had primary and secondary education, which might contribute to affect also contributed to the interpretation of this study results.

Studies showed that 6 to 19% of breast cancer patients were related to family history [3]. In these cases, the disease usually starts at a young age, which high incidence of breast cancer occurs from both sides of the family, with many members suffering from cancer. Based on the incidence of breast cancer in the UK, the probability of breast cancer among person without a family history of cancer was 7.8%while this rate among person having one and two family members with breast cancer were 13.3% and 21.1%, respectively [4]. Currently, genes involved in familial breast cancer, ovarian cancer have been identified as BRCA1, BRCA2, PTEN, TP53; CDH1 [2, 5]. These studies indicate that we also need to focus on communication and encourage women with a family history of breast cancer to seek breast cancer screening and regular examinations every year. However, our study has not found any relation between the family history of breast cancer and breast abnormalities. This may due to the number of women with a personal history of breast cancer and a family history of breast cancer was quite low, accounting for only 4.7% and 5.5%, respectively.

In addition to genetic causes, several other factors are associated with the development of breast cancer such as age, sex, reproductive history, menstruation, menopause, and benign breast disease. Breast cancer is common in the age group of 50-69 [5]. In our study, the age group which was most likely to participate in the screening was 40-49 with 1884 women, accounting for 44.3%, followed by the age group of 50-59, accounting for 29.8% with 1267 participants. The lowest group was an over60yearsold group, with 369 women taking the screening, accounting for 8.7%. Although the program prioritized screening for women who past the age of 40, 17.2% of women under 40 were observed within the screening process. These women were most likely to experience pain in the breast or to feel their own breast lesions, or to have their ultrasound results with cysts, fibrosis, and fibroids in the breast. When they knew about this program, they actively registered for medical examination.

The Ministry of Health’s breast cancer screening program, in collaboration with the Bright Future Foundation, expects women at high risk for breast cancer to have a medical examination every year (as a form of periodic breast cancer screening). After the screening in 2015, the number of women re-screened in 2016 and 2017 was still limited, with 142 people, accounting for 8% of all women in 2016 and 2017. It may be due to the limited knowledge of the women or lack of awareness about breast cancer after the normal results of the previous examination. Another possible reason is that they were unable to register for the screening. In fact, when implementing this screening program, the number of people who wish to apply for free examination is quite high. Many women registered online as well as offline at the Nuclear and Oncology Medical Center – Bach Mai hospital. However, the number of free screening ticket is limited, so many people cannot participate in the program. Therefore, it is urgent to expand the screening program in both time and number of free tickets. In order to do so, actions should be taken to call for more funding from government, donors and social organization.

After the screening of 2015 and 2016, the rate of women reparticipating in breast cancer screening in 2017 was 1.69 times higher than in 2016 (p <0.05) (Table 4). In addition, the study results also showed that there was a significant difference between the follow-up rate in different occupations, education levels and history of cancer (p< 0.05). The rate of re-screening among women with the educational level of high school and above was 1.94 times higher than that of women with lower educational levels (Table 4). Women with a history of cancer or had a family member with cancer had a 1.88- and 2.12-times higher re-screening rate than women without these factors, respectively. This suggested that women who had higher risk of breast cancer were more likely to do regular follow-up examination than women with lower risk of developing breast cancer.

Over 3 years of screening on 4250 women, screening results showed that 811 women were found with abnormalities in the breast, such as cystic lesions, fibroids, and fibrosis, and abces, accounting for 19.1%. Particularly, in 2015, 2016 and 2017, 6 cases, 5 cases and 3 cases of breast cancer were detected respectively. All these cases were early-stage breast cancer and now have been at the stage of stable disease after treatment. This is one of the important goals of the program, which is to early detect disease, and to increase awareness of women in screening for early detection of cancer in general and breast cancer. Patient with a history of breast cancer, ovarian cancer, and peritoneal cancer had a higher risk of breast cancer [1]. Body mass index (BMI) is an independent risk factor for breast cancer, especially in white women. Some studies have shown an association between high BMI and increased risk of postmenopausal breast cancer. This increased risk was due to an increase in the concentration of endogenous estrogens produced from adipose tissue [1, 6].

The screening results showed a statistically significant difference in breast abnormality rate between different groups in the age group, history of self-cancer, occupation, BMI, menopause and abortion status. Our research also showed that women with personal history of cancer were 2.5 times more likely to have breast abnormalities, compared to one without this history. Furthermore, women with abnormal BMI (malnutrition or obesity) were found to be 1.2 times more likely to develop breast abnormalities than women with normal BMI. In addition, women who underwent abortion had a 1.3 times higher risk of developing abnormalities than women who did not. Finally, menopause was also a factor protecting women from the risk of breast abnormalities (Table 6). The proportion of women who had self-examination of breast gradually increased each year. Thus, this proportion is also differencing between different age groups and occupations. These differences were statistically significant with p <0.05. In addition, women with a history of cancer and high levels of education were 1.4 and 2 times more likely to perform routine breast self-examination than those without a history of cancer and lower education level (p <0.05), respectively.

The rate of breast self-examination in the re-screening group was nearly 20% higher than the group for the first-time screening. This difference was statistically significant with p <0.05 (Table 9). Thanks to the screening program with the activities of examination and consulting, women were aware of self-examination and breast screen regularly. This is also one of the objectives of the Ministry of Health’s screening for early detection of breast cancer in coordination with the Bright Future Foundation. This success implies the need of expanding the screening program and making it more public accessible through the help of Government and the Foundation.

Conclusion

In the total of 4250 women participating in the screening, 70.7% had the educational level of high school and higher. 25.8% of them were aware of breast self-examination.4.7% of women had a history of breast cancer while 5.5% of women had a family history of breast cancer. 65.1% of women participating in screening were between the ages of 40-59. The percentage of re-screening was 8%. Women with a high level of education or history of cancer often have a higher awareness of breast cancer screening than those without it. The screening program has recorded 19.1% of women with breast abnormalities, of which the number of newly discovered breast cancer cases were 6, 5, and 3 in 2015, 2016 and 2017, respectively. The incidence of abnormalities was found with statistically significant differences among groups of age, family history of cancer, occupation, BMI, menopause, and abortion. Even though, the screening results after 03 years has quite limited it still makes a great contribution in changing women awareness of breast cancer. Through 03 years of implementing the breast cancer screening program, our study has observed the increasing in the awareness of breast self-examination and breast cancer rescreening among women, especially those with higher risk. Women who had higher risk of breast cancer were more likely to do regular follow-up examination than women with lower risk of developing breast cancer. In addition, after participating in the breast cancer screen, women were more aware of breast self - examination and breast cancer screening. Therefore, expanding the screening program and making it more public accessible is necessary works that need to be carried out in the future.

For more Articles: https://biomedres01.blogspot.com/


Psychotic Reaction Associated with ClomipheneInduced Ovulation


Psychotic Reaction Associated with ClomipheneInduced Ovulation

Introduction

Clomiphene citrate belongs to the selective estrogen receptor modulator (SERM) and has been used as an ovulation inducer for decades [1,2]. It affects the hypothalamus-pituitary-gonadal axis and indirectly stimulates the production of pituitary gonadotropins, follicle-stimulating hormone (FSH) and luteinizing hormone (LH), and subsequently testosterone level. The wide usage of the clomiphene citrate raises a question whether it induces unfavorable psychotic outcomes or not. In normal healthy women, clomiphene induces mood instability in 60-70% of the cases (Table 1). However more serious changes of mood and awareness are very rare. Therefore, this paper aims to highlight some hormonal effects, as it is not yet understood, which may be responsible for the patient’s psychotic state.

Table 1: Clinical studies on clomiphene-induced psychological side effects in female.

Literature review

In a literature review we found 7 single case reports of psychosis secondary to clomiphene therapy in female (Table 2). Many (5 of 7) case repots have a known psychiatric history; but 2 cases do not (Table 2). In these 2 cases, it is likely that a remote preceding episode of subclinical psychiatric issue may have been unreported. For many patients, a former history of mental illness (e.g. bipolar affective disorder and depression) can be subtle if not exhaustively explored, such as the history of transient neurological dysfunction [3] or preceding suicide attempt and lifetime psychotic instability [4]. Grimm and Hubrich [5] describe the case with paranoid delusion even one day after the beginning of clomiphene therapy. In all cases, the temporal association of both the onset and resolution of their symptoms with clomiphene initiation (or during treatment) and discontinuance, respectively, it is plausible to conclude that the development of psychiatric symptoms results from clomiphene treatment.

Table 2: Case reports of psychosis with clomiphene therapy in female.

BPAD: bipolar affective disorder.

Comments

Clomiphene citrate-associated psychotic states may be induced in an analogous manner to estrogen-withdrawal psychosis, a condition observed in peri- and post-menopausal women [6]. A rapid decrease in estrogen activity might lead to drastic changes in neurotransmission. As alternative plausible mechanism of clomiphene-induced psychotic symptoms, by causing negative feedback of estrogen receptor, clomiphene indirectly enhances LH and FSH releases, which ultimately results in increased testosterone levels. An enhanced testosterone-androgen receptor interaction in the brain subsequently changes the emotional conditions. Proposed neurobiological targets include catecholaminergic cells in the hypothalamus and other brain limbic regions [7-11]. The complexity and heterogeneity in this mode account for the broad variety of psychiatric symptoms documented in the future aspects. Patients with an underlying psychiatric history may be particularly wounded to the psychological side effects of clomiphene. Further and large-scale studies are waited to accumulate evidence in greater numbers of cases in further evaluating the potential risks of psychiatric complications associated with clomiphene therapy. The commitment of the attending gynecologists to become familiar with and identify psychological problems may lead to the detection at an early and curative stage and potentially counseling the patients to discontinue taking clomiphene.

For more Articles: https://biomedres01.blogspot.com/


Monday, August 30, 2021

Bupivacaine Continuous Spinal Analgesia Induced Aseptic Meningitis in Systemic Sclerosis Patient: A Case Report


Bupivacaine Continuous Spinal Analgesia Induced Aseptic Meningitis in Systemic Sclerosis Patient: A Case Report 

Introduction

Spinal anaesthesia is a very common technique which surely improves the pain control during and after surgical procedures. Continuous spinal analgesia offers relevant advantages. It allows to reduce the recovery period and to decrease anesthetic concentration, minimizing its potential adverse effects including cardiovascular instability [1]. Nevertheless, it is not free from complications, such as the risk of catheter dislocation, headache, neurological injury, infections. It has been reported that spinal anaesthesia may also cause aseptic meningitis, which is a rare but serious condition [1,2].

Several drugs, including NSAID, Immunoglobulins and Bupivacaine may be responsible for drug-induced aseptic meningitis (DIAM). Two main mechanisms account for it: a direct meningeal irritation caused by the intrathecal administration of drugs and an immuno-mediated hypersensitivity reaction, especially in patients affected by autoimmune diseases. Secondary encephalitis has been also observed [3,4]. DIAM is a diagnosis of exclusion and represents a completely reversible condition after few days from the drug interruption. Here we report a case of Bupivacaine-induced aseptic meningitis in a patient affected by Systemic Sclerosis.

Case Description

A 65 years old patient, affected by Systemic Sclerosis, was admitted to our Autoimmune Diseases Unit for a critical ischemia of the right foot. His medical history included the amputation of I-II-III e IV toes of the left foot for ischemic necrosis, interstitial lung disease, autoimmune hepatitis and hiatal hernia with Barrett’s esophagus. Despite the medical treatment, including prostanoid combined with antiplatelet and anticoagulant therapy, and an endovascular attempt of revascularization, below-knee amputation was needed. Under all aseptic precautions, the lumbar area was prepared using povidone iodine 10% and a sterile drape was placed; bupivacaine 0,1% (5ml) was administrated in L3-L4 interspace. The surgery was carried out without complications and the patient did not present any hemodynamic or respiratory events. In order to control post-operative pain, a lumbar epidural catheter with continuous infusion of Bupivacaine 0,1% was placed.

After 48 hours, the patient showed mental state alteration including agitated behavior, confusion and loss of consciousness. He had fever (38.5 °C) but no focal neurological deficits were recorded. Blood pressure was 140/70 mmHg. Laboratory analysis revealed a hemoglobin concentration at 9.7 g/dL, not differently from the previous days, WBC 16150/mm3 with 14000/mm3 neutrophils and platelets 286.000/mm3 C-reactive protein was 100 mg/L and procalcitonin was negative. Renal function tests, serum electrolytes and ammonia blood test were within normal limits. The lumbar epidural catheter was removed, and, in the suspicion of a septic status, a wide spectrum antibiotic therapy was started. Since the neurological status was very compromised a brain CT scan and MRI were performed. The CT scan did not show anomalies, while the MRI detected a diffuse enhancement of the pachymeninx (Figure 1). The EEG revealed a diffuse and aspecific electrical disorder. A diagnostic lumbar puncture displayed a limpid cerebrospinal fluid (CSF), with normal pressure, and the laboratory analysis showed a protein concentration of 2,73 g/L, a glucose concentration of 1.8 mmol/L and leukocytes 10/microL.

Figure 1: Brain MRI section after contrast administration showed a diffuse signal enhancement of the pachymeninx.

The bacterial cultures were negative and also the polymerase chain reaction (PCR) of the CSF was negative for all the verified microbic genome sequences (HSV1, HSV2, HHV6, HHV8, EBV, CMV, VZV, Human Parechovirus, enterovirus, E.coli, Hemophilus Influenzae, Listeria, Neisseria Meningitidis, Streptococcus Agalactiae, Streptococcus Pneumoniae, Cryptococcus Neoformans and Gatii). Also, the blood and urine microbiological tests did not reveal any bacterial growth. The patient experienced rapid worsening of the state of consciousness with a Glasgow Coma Scale (GCS) of 3 out of 15 points, together with neck rigidity, so he was moved to the Intensive Care Unit. The patient was diagnosed with aseptic meningitis. 48 hours after the symptom’s onset and the suspension of bupivacaine administration, the patient was awake, afebrile, but a mild mental confusion status was observed during the following week. The patient finally experienced a complete remission, without neurological deficits.

Discussion

To the best of our knowledge, here we have reported for the first time a case of aseptic meningitis related to bupivacaine spinal analgesia administration in a patient with Systemic Sclerosis. According to the data reported above, drug-induced aseptic meningitis is a very rare adverse reaction to several drugs and is diagnosed by exclusion. As already described in literature, clinical manifestations during a drug-induce aseptic meningitis are very aspecific. Fever, headache, confusion, agitation, a stupor or a comatose status may represent the main manifestations, without any common sign of meningeal irritation or photophobia. Neuroimaging is usually noninformative; sometimes Brain MRI may show a diffuse hyper intensity of leptomeningeal spaces [2,5,6]. Cerebro-spinal fluid analysis usually show pleocytosis (hundred to several thousand cells per microliter). Polymorphonuclear predominance is very common, but lymphocytes and eosinophilic presence have also been reported. Moreover, the proteins levels are usually elevated, whereas the concomitant glucose levels remain normal. Of course, bacterial cultures and viral genome research are negative [4-7].

To the best of our knowledge, here we have reported for the first time a case of aseptic meningitis related to bupivacaine spinal analgesia administration in a patient with Systemic Sclerosis. According to the data reported above, drug-induced aseptic meningitis is a very rare adverse reaction to several drugs and is diagnosed by exclusion. As already described in literature, clinical manifestations during a drug-induce aseptic meningitis are very aspecific. Fever, headache, confusion, agitation, a stupor or a comatose status may represent the main manifestations, without any common sign of meningeal irritation or photophobia. Neuroimaging is usually noninformative; sometimes Brain MRI may show a diffuse hyper intensity of leptomeningeal spaces [2,5,6]. Cerebro-spinal fluid analysis usually show pleocytosis (hundred to several thousand cells per microliter). Polymorphonuclear predominance is very common, but lymphocytes and eosinophilic presence have also been reported. Moreover, the proteins levels are usually elevated, whereas the concomitant glucose levels remain normal. Of course, bacterial cultures and viral genome research are negative [4-7].

A spontaneous recovery within few days after drug discontinuation is helpful in the diagnosis [8]. In several cases, spinal anaesthesia with bupivacaine was performed [9]. The real pathogenetic mechanisms are still unclear but, in some cases, an immunologic T-cell mediated hypersensitivity reaction has been supposed specially in subjects affected by autoimmune disease. Indeed, the number of reports associating autoimmune conditions, mainly Systemic Lupus Erythematosus, with drug-induced aseptic meningitis is not negligible [10]. Our case report remarks the high risk of adverse drug reactions in patients with autoimmune diseases, probably due to an intrinsic immune-mediated susceptibility.

For more Articles: https://biomedres01.blogspot.com/


Validated HPLC Method with UV Detection for Florfenicol Determination in Bester Sturgeon, A Cultured Hybrid of Huso Huso × Acipenser ruthenus


Validated HPLC Method with UV Detection for Florfenicol Determination in Bester Sturgeon, A Cultured Hybrid of Huso Huso × Acipenser ruthenus

Introduction

The hybrid Bester sturgeon (Huso huso × Acipenser ruthenus) is one of the most important commercial fish species in the world. Farming of sturgeon in worldwide has increased in recent years and becomes an important issue in the wider context of global food supplies [1]. In Taiwan, the techniques for sturgeon culturing have been established in several fish farms. However, the high density of animals grown in agricultural facilities and fish hatcheries in either large- or small-scale fish farms increases the potential for disease outbreak. To minimize the impact of an outbreak spreading across an animal population, the use of drugs, especially antibiotics, in sturgeon aquaculture becomes very important [2]. Florfenicol (FFC), a fluorinated analogue of thiamphenicol and chloramphenicol, has a synthetically produced broad antibacterial spectrum similar to chloramphenicol and stronger than thiamphenicol [3]. It has been widely used in veterinary as well as in aquaculture.

Among 14 antibiotics authorized for application in Taiwan aquaculture, FFC is only available for sturgeon aquaculture. Nevertheless, there is a lack of understanding regarding FFC metabolism kinetics during breeding period. The overall goal is to determine the presence and distribution of FFC residue in Bester sturgeon after treatment to obtain information about FFC withdrawal period for sturgeon culturing. This paper and video describe the stepwise development of a simple, rapid, and reliable method for detecting the pharmacokinetics of FFC in serum, muscle and liver of Bester sturgeon. The details of sampling and assay validation methods as well as the representative results are shown to demonstrate the application of high-performance liquid chromatography (HPLC) method with ultraviolet (UV) detector. The simple and reliable technique can be utilized to design optimal dosage regiments for aquatic veterinary applications.

Materials and Methods

NOTE: All animal experiments were approved by the Institutional Animal Care and Utilization Committee (IACUC) of National Chung-Hsing University, Taichung, Taiwan (approval ID: 98-61). Animal care was performed in compliance with the guidelines of IACUC and the United States National Institutes of Health Guidelines for the Care and Use of Laboratory Animals. All efforts were exerted to minimize the number of animals used and their discomfort.

For the source and sample collection of experimental Bester Sturgeon-There is one session 4:46 min long, divided into the source of experimental Bester sturgeon (the first 2:16 min) and the sample collection of experimental Bester sturgeon (the last 2:30 min)

Experimental ± Fishes

a. Healthy Bester sturgeon, a cultured hybrid of Huso huso × Acipenser ruthenus (1,000  100 g) were obtained from a commercial farm (Han Si Fish Farm, Yilan County, Taiwan).

b. Fish were fed a standard laboratory diet and kept on a 12-h light/dark cycle at 23 ± 1°C in the Central Fish Disease Center, National Chung-Hsing University, Taichung, Taiwan.

c. Animals were randomly assigned to treatment groups and housed in 300 L aquaria with a continuous flow of pH 6.8 ± 0.4 aerated freshwater in the density of 6 fish / 91 cm × 51 cm [the bottom area (length × width) of the experimental cylinder] (Figure 1).

Figure 1: Experimental Bester sturgeon. SS

(A) Healthy Bester sturgeon (1,000 ± 100 g) were obtained from a commercial farm in Yilan County, Taiwan.

(B) Experimental Bester sturgeons were housed in 300 L aquaria with a continuous flow of aerated freshwater in the Central Fish Disease Center, National Chung-Hsing University, Taichung, Taiwan.

Sample Collection

a. After an acclimatization period of at least 1 week, FFC (Sigma-Aldrich) were fed to 42 fish per group daily at dose of 10 mg kg-1 or 20 mg kg-1 via disposable feeding needles (FN-9921, 20G × 1.5”; Kent Scientific, San Diego, CA, USA).

b. Age matched control fishes (n = 42) were administrated with an equal volume of normal saline instead of FFC (Figure 2).

c. At day 3, day 5, day 7, day 10, day 14, day 21, and day 28 after the p.o. FFC administration, fishes were deeply anesthetized with tricaine methane sulphonate (MS222, Sigma-Aldrich).

d. Approximately 0.5 mL of blood samples were obtained from the caudal artery of each fish (Figure 3).

e. Blood samples were allowed to clot at room temperature for 30 min then the coagulated blood samples were centrifuged at 1,300 ×g for 10 min.

f. Sera were collected and stored at -80˚C.

g. The muscle and liver samples were excised and snapfrozen at -80˚C (Figure 4).

h. Frozen muscle and liver samples were homogenized in buffer.

i. The tissue slurry was then centrifuged at 5,000 rpm for 30 min at 4°C, the supernatants were collected and kept at -80˚C for subsequent analysis.

Figure 2: Oral administration with FFC to Bester sturgeon by gavage. Animals were given single oral FFC administration at doses of 10 and 20 mg kg-1 BW per day via disposable feeding needles.

Figure 3: Blood collection from Bester sturgeon. Approximately 0.5 mL of blood samples were obtained from the deeply anaesthetized fish via their caudal artery.

For the assay by using HPLC equipped with UV detector - There is one session 0:54 min long

Apparatus

a. The HPLC system equipped with a quaternary solvent delivery system (model 600e) (Waters, Milford, MA, USA), an autosampler (model 717, Waters), a photodiode array detector (model 996, Waters), and a Cosmosil 5C18-MS column (5 µm, 4.6 × 150 mm i.d.; Nacalai, Kyoto, Japan) (Figure 5).

b. The chromatograms were detected via UV detector with the screening wavelength of 210 to 290 nm and the excitation wavelength of 223 nm.

c. HPLC data were analyzed by Waters Millennium 32 software (Version 4.0, Waters).

Figure 4: Sacrifice, anatomy and tissue/organs collection from Bester sturgeon. At each time point of the experiment (6 fish per time point/group at day 3, day 5, day 7, day 10, day 14, day 21, and day 28 after the p.o. administration), fish were sacrificed, and muscle and liver samples were collected. The supernatant of homogenized muscle and liver were immediately decanted and frozen at -80°C and stored until assay.

Figure 5: Pharmacokinetic study of FFC in cultured Bester sturgeon by HPLC equipped with UV detector. The HPLC system equipped with a Waters model 600e quaternary solvent delivery system, a Waters model 717 autosampler, a Waters model 996 photodiode array detector, and a 5 μm, 4.6 × 150 mm i.d. Cosmosil 5C18-MS column. The chromatograms were detected via UV detector with the screening wavelength of 210 to 290 nm and the excitation wavelength of 223 nm. HPLC data were analyzed by Waters Millennium 32 software version 4.0.

Method Validation [4]

a. Linearity was assayed according to the slopes, intercepts.

b. Correlation coefficients of the calibration curves were calculated by linear regression analysis.

c. The quantitative recovery of FFC was determined by repetitively analysing blank sera, muscle and liver with known amounts of FFC (0.1, 0.2, 0.5, 1, 2, 5, and 10 μg mL-1).

d. After reconstituting the residue with 0.05 M ammonium acetate-acetonitrile-tetrahydrofuran (76: 23: 1, v/v; pH 7.2), added the internal standard at the end.

e. Calibration curve was constructed by extracts of sera, muscle, or liver added to FFC immediately prior to injection, corresponding to 100% recovery.

f. The working standard calibration curve was drawn by plotting the known FFC concentrations against the average peak area.

Quantification [4]

a. Ten mg mL-1 FFC stock solution in methanol was diluted into working solutions of 100, 10, and 1 μg mL-1 with distilled water.

b. Standardization was performed by a high-concentration and a low-concentration range.

c. Blank sera, muscle and liver extract samples were exposed to known amounts of FFC (0.1, 0.2, 0.5, 1, 2, 5, and 10 μg mL-1) and were transferred to autosampler tubes for direct application to the HPLC column.

d. The presence of FFC in serum and tissue samples was screened by HPLC method with ultraviolet photodiode array detection.

e. The internal standard was analyzed as the unknown samples.

f. The FFC concentrations in unknown samples were read from the standard curve.

g. Accuracy was evaluated indirectly because of the lack of certified samples or reference methods.

h. Comparing with the resulting peak area ratios of blank sera, muscle and liver extract samples with known amounts of FFC (0.1, 0.2, 0.5, 1, 2, 5, and 10 μg mL-1) and water samples containing equivalent concentrations of FFC, the difference between these two sets of data was the bias of the method.

i. The limit of detection (LOD) and limit of quantification (LOQ) for FFC were estimated from the size of the FFC peak in spiked samples of blank sera, muscle and liver extract samples. They were defined as the concentrations that resulted in a detectable peak of approximately 4 and 10 times of the noise level, respectively.

Assay Validation [5]

a. FFC concentration in samples was determined using the linear regression line (unweighted) of the concentration standard versus peak area (r2 > 0.995).

b. The precision of the method was expressed as the intra-day and inter-day coefficients of variation (%). FFC at concentrations of 0.1, 1, and 10 μg mL-1 were assayed (three replicates) on the same day and on three sequential days, respectively.

c. The accuracy (% bias) was calculated from the nominal concentrations (Cnom) and the mean value of the observed concentrations (Cobs) as follows: bias (%) = [(Cobs - Cnom) / (Cnom)] × 100.

d. Accuracy and precision values within ± 20% covering the actual range of experimental concentrations were considered acceptable.

e. The relative standard deviation (RSD) was calculated from the observed concentrations as follows: precision (% RSD) = [standard deviation (SD) / Cobs] × 100.

Pharmacokinetic Analysis [4,6,7]

a. Pharmacokinetic parameters were calculated with WiNonlin professional software version 1.0 (Pharsight Coporation, NY, USA) according to a non-compartmental 202 model.

b. Model discrimination was based on the correlation coefficient of the curve fit, and the absolute error was independent of the concentration (weighted regression).

c. The parameters evaluated for serum were half-lives (t1/2, h) at each phase, time to maximum concentration ( Tmax, h), maximum concentration (Cmax, μg mL-1), mean residence time (MRT, h), clearance (L kg-1 h-1), area under the concentrationtime curve from 0 h to infinity (AUC0-inf, h × mg L-1), and the apparent volume of distribution (V/F, L kg-1).

d. Sera FFC concentration vs. time was analyzed using model-independent standard methods (n = 6 per time point).

e. The terminal elimination rate constant (λ) was derived by the unweighted least square regression analysis of at least last four time points of the semilogarithmic sera concentrationtime curves.

Statistical Analysis

Data are shown as mean ± the standard error of the mean (SEM). Student’s t-test was used for statistical analyses. Differences between groups were considered statistically significant at *p < 0.05.

For the Results Presentation- There is One Session 2:40 min Long

Relevant results were adapted from [Aquaculture 495: 558-567] [8].

a. Table 1. Pharmacokinetic parameters of FFC in serum of Bester sturgeon following single oral FFC administration at dose of 10 mg kg-1 BW.

b. Figure 6. Serum FFC concentrations after single oral FFC administration.

i) (A) Serum semilogarithmic concentrations of FFC.

ii) HPLC chromatographs for FFC residue (arrow) in the serum of sturgeon fed with FFC for (B) 48 h and for (C) 72 h.

c. Figure 7. FFC concentration time curve in liver and muscle following single oral FFC administration at doses of (A) 10 mg kg-1 BW and (B) 20 mg kg-1 BW.

d. Table 2. Mean muscle and liver FFC concentrations over time in Bester sturgeon following p.o. administration with FFC at a dose of 10 or 20 mg kg-1 BW, respectively.

Figure 6: Serum FFC concentrations following single oral administration.

(A) Semi-logarithmical serum FFC concentrations against time (1, 2, 3, 4, 6, 8, 10, 12, 16, 18, 20, 24, 48, 72 h) after 10 mg kg-1 BW FFC oral administration.

(B) HPLC chromatographs for FFC residue (arrow) in the serum of sturgeon fed with FFC for 48 h.

(C) HPLC chromatographs for FFC residue (arrow) in the serum of sturgeon fed with FFC for 72 h. This figure has been modified from [Aquaculture 495: 558-567] [8].

Figure 7: FFC concentrations in liver and muscle following single oral administration.

(A) The concentration time curve of FFC in the liver and muscle of sturgeon after single oral administration at a dose of 10 mg kg‐1 BW.

(B) The concentration time curve of FFC in the liver and muscle of sturgeon after single oral administration at a dose of 20 mg kg-1 BW. This figure has been modified from [Aquaculture 495: 558-567] [8].

Table 1: Pharmacokinetic parameters for Bester sturgeon after 10 mg kg-1 BW p.o. administration of FFC.

Table 2: Mean FFC concentrations in muscle and liver of Bester sturgeon over time following p.o. administration of FFC at a dose of 10 or 20 mg kg-1 BW, respectively.

N = 6 per groups; “-” indicated that lower than the lowest concentration of detection; units: μg mg-1.

For the Highlights- There is one session 1:33 min long

a. Using of the accurate HPLC method with UV detection for FFC pharmacokinetics in Bester sturgeon.

b. The developed method technique may be a valuable tool was efficient in detecting the pharmacokinetics of FFC in Bester sturgeon.

c. According to Taiwan law in the allowed amount of FFC residue in the fish meat must be ≤ 1 µg mL-1.

d. The recommended withdrawal period of FFC in sturgeon was suggested for 15 days.

Representative Results

As shown in Table 1, the estimated pharmacokinetic parameters of FFC in serum were calculated according to a non-compartmental 202 model, including half-lives (t1/2, h) at each phase, time to maximum concentration ( Tmax, h), maximum concentration (Cmax, μg mL-1), mean residence time (MRT, h), clearance (CL, L kg-1), area under the concentration-time curve from 0 h to infinity (AUC0-Inf, h × mg L-1), and the apparent volume of distribution (V/F, L kg-1). Following single oral administration with FFC at dose of 10 mg kg-1 BW, estimated serum FFC t1/2 was 12.13 ± 0.33 h, the observed Tmax occurred at 10 ± 0.08 h, the Cmax was 10.95 ± 1.14 μg mL-1 for 24 h, the MRT was 23.7431 ± 0.86 h, CL was 0.0387 ± 0.01 L kg-1 h-1, the AUC0-Inf was 251.64 ± 15.04 h × mg L-1, and V/F was 0.6777 ± 0.1 L kg-1. The mean FFC concentrations in sera were plotted against time (1, 2, 3, 4, 6, 8, 10, 12, 16, 18, 20, 24, 48, 72 h) semi-logarithmically (Figure 6A).

Following FFC administration, the mean concentrations in sera were gradually increased at 1 to 8 hours as 0.45 μg mL-1 (1 h-FFC p.o.), 0.67 μg mL-1 (2 h-FFC p.o.), 1.82 μg mL-1 (3 h-FFC p.o.), 2.35 μg mL-1 (4 h-FFC p.o.), 3.2 μg mL-1 (6 h-FFC p.o.), and 4.33 μg mL-1 (8 h-FFC p.o.) and peaked at 10 hours (10.95 ± 0.58 μg mL-1), followed by a gradual decrease thereafter. In sera collected at 48 h and 72 h after oral administration, an obvious peak (223 nm) of FFC residue was detected at 7.3 min (Figures 6B and C). The concentration time curve in liver and muscle showed the changes in concentration overtime after single oral administration of FFC at doses of 10 and 20 mg kg-1 of BW (Figure 7). FFC concentrations in muscle and liver decreased slowly with time and were below the limit of detection at 10 and 14 days after oral administration, respectively (Table 1).

Discussion

The present work demonstrated a method for determining FFC retention and elimination in sturgeon culturing. The use of HPLC with UV detector successfully detected FFC pharmacokinetics and residual in sera and tissue of Bester sturgeon and developed an efficient tool to understand its metabolism. We demonstrated that FFC in sturgeon was rapidly absorbed in serum with time to maximum concentration value of 10 hrs and slowly eliminated in liver and muscle. In line with our findings, Gaunt et al. indicated a good absorption, distribution, bioavailability, and plasma concentration of FFC via the pharmacokinetic studies of FFC in channel catfish following either intravenous or oral administration of a single dose of FFC [9]. From a therapeutic point of view, the higher oral bioavailability and slower elimination of FFC than that in most antibiotics (amoxicillin, erythromycin, flumequine, lincomycin, oxalinic acid, oxytetracycline, and spiramycin) are important properties for treating with bacterial infections in aquaculture. However, antibiotic residues in animal-derived food stuffs cause multi-drug resistance of pathogens for antibiotics used in human medicine and bear a risk for the food-productionindustry [10].

As a result, the concerns over veterinary drug residues in food are increased globally. Various methods have been described for identifying FFC in animal tissues, including HPLC [11], liquid chromatography-mass spectrometry [12,13], gas chromatography [14], gas chromatography-mass spectrometry [15], and enzymelinked immunosorbent assay [16]. The HPLC and LC-MS/MS methods are widely analytical tools in pharmacokinetic study in several fish species. FFC residues in fish muscle have been monitored by HPLC-UV method, and results were close with those obtained using liquid chromatography-tandem quadrupole mass spectrometry. HPLC-UV method can be employed for the analysis of FFC metabolic kinetics simply and reliably regardless of different species and environmental condition [17]. The total concentration of residues of FFC and FFC amine in fish accepted by European Union were not exceeding 1,000 µg kg-1 [18]. In Taiwan, maximum residue limits for veterinary drugs allowed in fish is 1 μg mL-1. Our results showed that FFC concentrations in muscle and liver decreased slowly with time and were below the limit of detection at 10 and 14 days after oral administration, respectively. Accordingly, withdrawal periods of 15 days after oral administration of FFC in sturgeon are recommended for fish farm. These findings can provide valuable insight for designing optimal dosage regimens for FFC in aquatic agricultural system.

Acknowledgment

Authors wish to thank the Council of Agriculture in Taiwan (Executive Yuan) for supporting this study [93AS-1.8.1-BQ-B1 (3); 94AS-13.2.1-BQ-B1; 98AS-9.2. 4-BQ-B1(21); 99AS-9.2.2- BQ-B1(28)]. Drs. Yu-Wen Hung, Hsuan-Wen Chiu, Ching-Feng Chiu, Chien-Chao Chiu, Shao-WenHung, and Mr. You-Zhou Jiang, the employee of Han Si Fish Farm (Datong Township, Yi Lan County, Taiwan) participated in filming on Sep. 8, 2018. All healthy Bester sturgeon were provided from Han Si Fish Farm. We also thank the permission of Aquaculture to share partly data to Biomedical Journal of Scientific & Technical Research (BJSTR).

For more Articles: https://biomedres01.blogspot.com/


Structural and Pharmacological Properties of Alkaloids with Special Reference to Thebaine Type Alkaloids


Structural and Pharmacological Properties of Alkaloids with Special Reference to The baine Type Alkaloids

Introduction

Alkaloids

Alkaloids are pharmacologically active with two or more fused organic compounds including heteroatoms in it. These atoms determine the properties of alkaloids. Especially, an alkaloid containing one or more nitrogen atoms as primary or another form of amines may provide basicity to the alkaloid. Alkaloids are found mainly in plants, but to the lesser extent in animals and microorganisms [1]. Many alkaloids are toxic, but they often have pharmacological effects. Extraction of alkaloids from plants has been widely used by researchers for therapeutic and recreational purposes. For example, Ephedra, opium poppies, and cocoa leaves have been used medicinally since ancient times. In the nineteenth century, alkaloids were first isolated successfully, and alkaloidcontaining drugs were marketed [2]. The structure of the first alkaloid, namely coniine, was established in the year 1870 by Schiff. Catharanthus alkaloids and paclitaxel came into the market as researchers looked for plant drugs with anticancer properties.

Alkaloids are optically active, bitter in taste (except papaverine), levorotatory (exception is coniine, which is dextrorotatory), colourless (except berberine which is yellow, and harmaline and betanidine, which are reddish), crystalline solids (except nicotine and coniine, which are liquids), and soluble in organic solvents. They are basic and form salts with the acids; some of the alkaloids form as salts called quaternary amines (e.g. cinchona alkaloids with quininic acid), while some exist as free bases (e.g. nicotine). Alkaloids also exist as glycosides (e.g. solanum alkaloids) and esters (e.g. atropine). The biological activity of the alkaloids frequently depends on the amine function being transferred into a quaternary amine at physiological pH by protonation. In summary, alkaloids behave as curare or arrow poisons. Curare alkaloids, which have muscle relaxant properties, are the active ingredients of arrow poisons used by South American Indians.

Alkaloids as Medicines

In general, many alkaloids are pharmacologically active substances which possess various physiological activities in humans and animals. The use of alkaloids containing plants as dyes, drugs, or poisons can be traced back almost to the beginning of civilization [3]. Opium that derived from Papaver somniferum L. was used as medicine in ancient Greece, Egypt and Rome. More recently, China learned about it via Arabian traders in the eighth century A.D. Today, a lot of alkaloids are still in use as drugs, against their poisonous effects. Caffeine, mostly obtained from the decaffeination of coffee species, is used a psychostimulant reagent. Codeine is used as an antitussive. Cocaine is used as a local anesthetic, especially for eye surgery. Morphine is an indispensable analgesic reagent that is used for the treatment of severe pain.

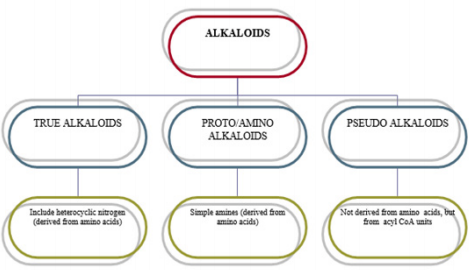
Classification of Alkaloids

Alkaloids containing wide families are classified using different techniques [4]. These techniques: Pharmacological classification is based on the clinical use or pharmacological activity (analgesic and cardioactive alkaloids). Taxonomic classification is based on the family or genus (rauwolfia and cinchona alkaloids). Biosynthetic classification is also based on the type of precursors or building block compounds used by plants to synthesize alkaloids (morphine, papaverine, narcotine and colchicine may be listed as phenylalanine- and tyrosine-derived bases). The last one, chemical classification, is based on the chemical structure of the alkaloid. (Thebaine, for example, is an isoquinoline derivative alkaloids of opium; aspidospermine is an indole alkaloid.). Alkaloids are often classified on the basis of chemical structure. These groups are described in Figure 1.
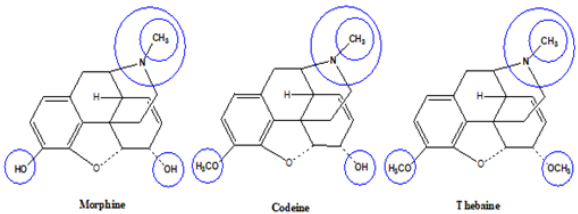
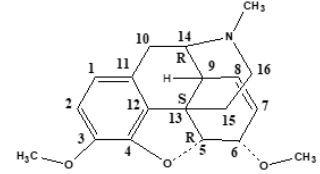
Figure 1: Chemical classification of alkaloids.

Opioid Structure

Morphine includes a benzene ring with a phenolic hydroxyl group at 3-position, an alcohol hydroxyl group at 6-position, and the nitrogen atom in Figure 2. When both hydroxyl groups are converted to ethers, codeine and thebaine as morphine derivatives are obtained. The tertiary form of the nitrogen appears to be crucial to the analgesic properties of morphine. The nitrogen quaternary widely decreases the analgesia, since morphine cannot pass into the central nervous system. Also, if the methyl group on the nitrogen is changed, it will again decrease analgesia. Morphine is also optically active, and only the levorotatory isomer exhibits the analgesic effect. Furthermore, they have many effects on the central nervous system. These are analgesia, respiratory depression, euphoria, and depression of cough reflex. Morphine undergoes strong first-pass metabolism by the liver if taken orally, limiting the effective time of analgesia, unless a sustained-release form is given [5]. The adverse effects of morphine include CNS respiration depression, sedation, dizziness, nausea, vomiting, itching, and constipation. CNS respiratory depression is the serious one among other complications.

Figure 2: Structures of morphine, codine and thebaine.

HRM Data Analysis

HRM data analysis was performed using the LightCycler® 96 SW 1.1 software (Roche Diagnostics, Germany). All analyses were carried out including both positive (on the second and the third plates/SSR marker) and negative controls. The positive controls represented the different groups detected mostly on the first, then the second and then the third plates, and finally on a forth plate in case a new different group was discovered at the third plate. They were used to enable grouping the accessions among the three runs of each marker because the software does not support analyzing all data gathered from these runs together. After normalization, samples having the same melting curves were grouped automatically, with sensitivity settings at the default level 50%. However, grouping was also evaluated by visual inspection of the HRM profiles produced and corrected manually if needed through the adjustment of the pre and post-melting ranges by dragging the two leftmost and the two rightmost vertical sliders to appropriate locations. Generally, they were adjusted as close as possible to the melting temperature.

Apart from these severe effects, morphine is still considered to be the most effective drug clinically available for the management of severe pain associated with cancer. The opium poppy was cultivated in Mesopotamia around 3400 BC. Opium is a mixture of alkaloids from the poppy seed. Opiates are naturally occurring alkaloids such as morphine or codeine. An opioid is a term used broadly to describe all compounds that work at the opioid receptors [6]. The common term narcotic (from the Greek word for stupor) originally was used to describe medications for sleep, and then was used to describe opioids, but now is a legal term for drugs that are abused.

Opioid Receptors

Definition of an Opioid Receptor

Thus, the opioid is a substance that produces the above-listed effects by acting at opioid receptors and whose actions are reversed by naloxone.

a) Extraction/purification of active poppy ingredient: morphine [7].

b) Effects: analgesia, respiratory depression, somnolence, decreased GI motility.

c) Agonist structure-activity relationships: morphine ≥ meperidine > codeine > 0

d) Structurally similar agents such as naloxone act as antagonists; have no effect alone but reverse the effects of an agonist.

e) Opioid binding interactions showed high-affinity binding sites.

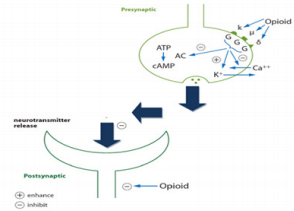
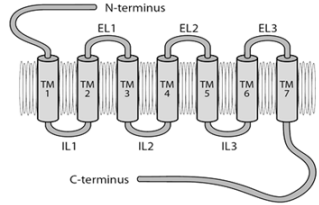
Opioid Receptor Subtypes

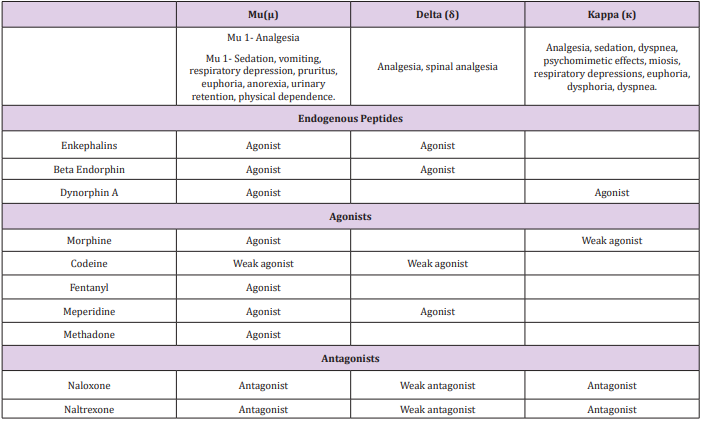
Three types of opioid receptors have been identified so far: mu (µ) receptors, delta (∂) receptors, and kappa (κ) receptors (Figures 3 & 4). Mu (μ) (agonist morphine) Mu receptors are found mainly in the nervous system (brainstem and medial thalamus). Mu receptors are responsible for respiratory depression, supraspinal analgesia, sedation, euphoria, sedation, decreased gastrointestinal motility, and physical dependence. Subtypes of Mu receptors possess Mu1 and Mu2. Mu1 is confined to analgesia, euphoria, and serenity, while Mu2 is concerned with respiratory depression, prolactin release, pruritus, dependence, anorexia, and sedation. These receptors are called OP3 or MOR (morphine opioid receptors). Kappa (κ) (agonist ketocyclazocine) Kappa receptors are found in the limbic and other diencephalic areas, brain stem, and spinal cord, and induce spinal analgesia, sedation, dyspnea, dependence, dysphoria, and respiratory depression. These are also known as OP2 or KOR (kapa opioid receptors). Delta (δ) (agonist delta-alanine-delta-leucineenkephalin) Delta receptors are noticed in the brain, and their effects are not clearly explored.

Figure 3: Locations of opioid receptors [kappa (κ), mu (µ) and delta (∂)].

Figure 4: Opioid receptor structure. EL: Extracellular loop, TM: Transmembrane helix, IL: Intracellular loop [8].

They may be responsible for psychomimetic and dysphoric effects. They are also called OP1 and DOR (delta opioid receptors). Sigma (σ) (agonist N-allyl nor metazocine) Sigma receptors are associated with psychomimetic effects, dysphoria, and stressinduced depression. They are not included as opioid receptors, but rather are the target sites for phencyclidine (PCP) and its analogs.

These receptor types are defined by:

1) Agonist structure-activity relationships in the bioassay (ability to block stimulated contraction of specific smooth muscle tissues) and binding (Table 1).

2) Antagonist activity profile: naloxone blocks all opioid receptors (Table 1).

3) Lack of cross-tolerance.

4) Cloning

Table 1: Analgesic Effects of Opiod Receptors.

Opioid Classes

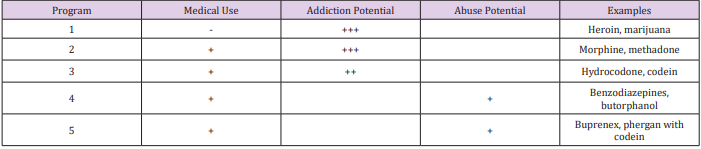
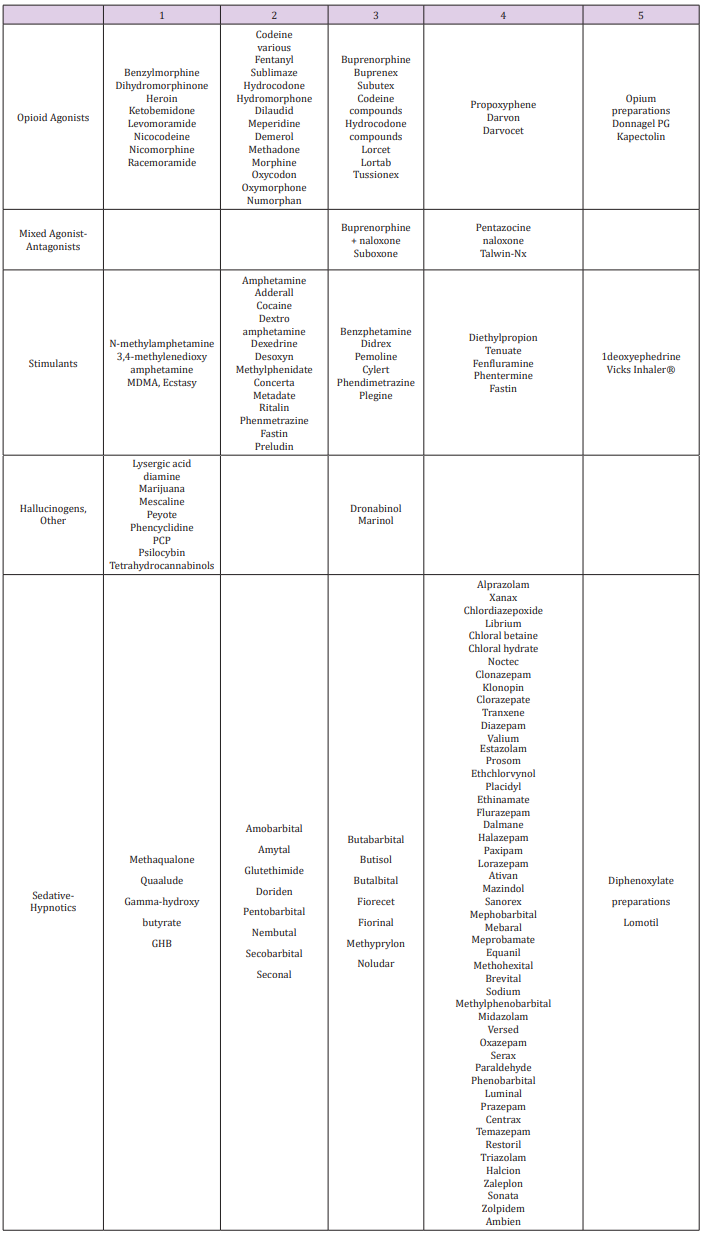
Opioid Classes DEA (Drug Enforcement Agency) classified opioids into schedules as illustrated in Table 2 and Table 3. Four 
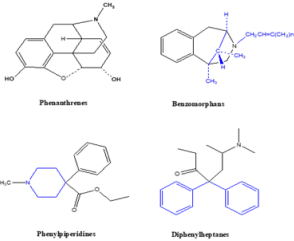
chemical classes of opioids (Figure 5): Phenanthrenes are the prototypical opioids. The presence of a 6-hydroxyl is associated with nausea and hallucinations. Morphine and codeine (both with 6-hydroxyl groups) are associated with more nausea than hydromorphone and oxycodone (which do not possess 6-hydroxyl groups). Opioids in this group include morphine, codeine, hydromorphone, levorphanol, oxycodone, hydrocodone, oxymorphone, buprenorphine, nalbuphine, and butorphanol. Benzomorphans have pentazocine as a member of this class and is an agonist/antagonist with a high incidence of dysphoria. Phenylpiperidines cover fentanyl, alfentanil, sufentanil, and meperidine. Fentanyl has a strong affinity for the mu receptor. Diphenylheptanes include methadone and propoxyphene. Tramadol does not come under standard opioid classes. Tramadol is an atypical opioid, a 4-phenyl-piperidine analogue of codeine, with partial mu-agonist activity, in addition to central GABA, catecholamine, and serotonergic activities.

Figure 5: Chemical classes of opioid.

Table 2: The Drug Enforcement Agency Program of Controlled Drugs.

Table 3: The Drug Enforcement Agency Program of Common Medications.

Opioids can be classified agonist, agonist-antagonist, partial agonist, or partial antagonist. Compounds can have intrinsic affinity and efficacy at receptors, with affinity being a measure of the strength of interaction between a compound and its receptor and efficacy being a measure of the strength of activity. An agonist has both affinity and efficacy; an antagonist has affinity but no efficacy; a partial agonist has affinity but only partial efficacy. Regarding the opioids, the relevant receptors are the mu, kappa, and delta receptors. Compounds can have differing degrees of affinity and efficacy at these various receptors.

Medicinal Uses and Toxicity of Thebaine and its Derivatives

Alkaloids protect plants against bacteria, fungi, insects, and herbivores, as well as other plants by means of allelopathically 
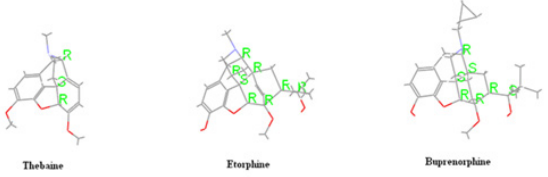
active chemicals. Thebaine, or paramorphine, is a white, crystalline, slightly water-soluble, poisonous alkaloid. This alkaloid type is not used for therapeutic purposes but is converted to other compounds, such as buprenorphine, etorphine, oxycodone, oxymorphone, and naloxone. Thebaine derivatives are used for different purposes. 5[alpha])-6,7,8,14-tetradehydro-4,5-epoxy-3,6-dimethoxy-17- methylmorphinan is more toxic and is about ten times higher than morphine. Also, it is the most poisonous opium alkaloid. Because of this reason, thebaine is used only for synthesis into other pharmaceutical drugs. Usually, thebaine readily undergoes Diels– Alder reactions with various dienophiles to form into adducts.

The diene system of thebaine could potentially be attacked from both sides, but reactions with dienophiles always occur from the same face as the nitrogen bridge (upper face) due to the nitrogen bridge causing the lower face to be hindered through concealment inside a concave system [9]. The nature of a substituent in positions 7,8 of morphine alkaloids is among the most important factor affecting their biological activity [10]. The opioid analgesic buprenorphine, ethorphine possesses a pharmacological profile that may be interesting for development of antinarcotics [11]. Our previous reports show that cinnamaldehyde, a plant derivative, is an allergen, and it induces toxicity [12,13]. In this regard, an attempt has been carried out to evaluate the toxicity of thebaine, an allergen [14].

Assessment of Chemical and Biochemical Activities of Thebaine Derivatives

Hashish capsule (Papaver semniferum L.) contains nearly thirty kinds of alkaloids. Among this morphine, thebaine, papaverin and codeine are important to medicine raw materials that have medicinal value. In pharmacy, thebaine cannot be used directly as a drug because it exhibits toxicity but thebaine has a very important role as the main material with some reasons [15,16]. These reasons include its view availability, its lower cost and chemical structure, containing a conjugated diene system at ring C. The chemical structure of thebaine has allowed the preparation of many pharmaceutical products by Diels-Alder cycloadditions with a large number of dienophiles. Further, classical examples of drugs prepared using this approach are Etorphine [17] (Immobilon), Buprenorphine [18] (temgesic, buprenex, Buprex, Prefin) and many other adducts, reported mainly by Bentley [19-21] (Figure 6). Surprisingly, no references are found in the literature on 
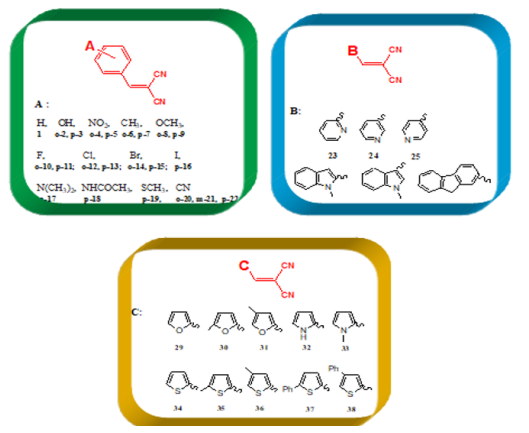
the cycloaddition to thebaine of the dienophile that are various benzylidene malononitrile (1-28) and metilen malononitrile (29- 38), (Table 3).

Figure 6: Three dimensional structures and absolute configurations of thebaine, etorphine and buprenorphine.

Therefore, we firstly performed PM3 and DFT methods to evaluate the best dienophiles by using Gaussian09 [22] and Discovery Studio 3.5, (DS 3.5) [23]. In the meantime, we examined the effect of dienophile substitution (38 molecules) on the reactivity to select the substituents leading to the most favourable suitable reaction conditions. Then, novel and efficient addition products (Table 4) were analysed by using quantum chemical descriptors [24] for investigation of the differences in stereochemistry and determination of the energetically more suitable reactions. The quantum chemical descriptors have proven useful for the prediction of many molecular biological and physicochemical properties of interest to the pharmaceutical industry [25-27]. In 
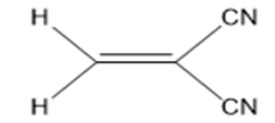
conclusion, the obtained results about the known basic structure, 2-methylenemalononitrile, (MMN) (Figure 7), and the 38 molecules (Table 4) are evaluated to obtain a better understanding of the relationship between structure and activity. The same process is also applied to the novel addition products (Table 5), basing on thebaine and known drugs such as etorphine [17], buprenorphine [18], (Figure 6).

Figure 7: The chemical structure of 2-methylenemalononitrile (MMN).

Table 4: The various benzylidene malononitrile and metilen malononitrile structures, as dienophiles (38 compounds).

Table 5: The Novel Diels-Alder adducts that obtained [4+2] addition of several dienophiles (1-38) and thebaine, such as 2-(4-nitrobenzylidene) malononitrile for which there are eight configurations in D-A adducts.

Materials and Methods

Thebaine has similar anesthetic activity as morphine, but it is very toxic and is obtained very little, compared to morphine. These reasons are generated from different searches on chemical modification of thebaine to eliminate and diminish side effects and also to increase the activity. Firstly, the various benzylidene malononitrile (1-28) and metilen malononitrile (29-38), (Table 4) as dienophiles, and possible semi-synthetic thebaine derivatives, (38*8 = 304 compounds) (Table 4) were designed and optimized with semi-empirical PM3 and B3LYP/6-31G* level of theory in DFT methods by using Gaussian09 [22] and DS 3.5 [23] software. All stationary points were located and characterized as true minima by using both package programs with the semi-empirical PM3 and B3LYP/6-31G* basis sets. The calculated quantum chemical descriptors were total energy (E), the energy of the highest occupied molecular orbital (HOMO), the energy of the lowest unoccupied molecular orbital (LUMO), the global hardness (η), electrophilicity index (ω), electronic charge (ΔN) and dipole moments (DM).

Tables 1 & 2 for various dienophiles and Tables 3 & 4 for novel addition products were shown in Appendix. Furthermore, the calculated results were divided into two parts such as the dienophiles (Table 4) and novel addition products (Table 5). Each part was explained with figs (Figures 2-9). In the first part, the dienophiles were clarified based on 2-methylenemalononitrile (MMN) (Figure 7). In the second part, new thebaine derivatives were interpreted according to the obtained results with comparison to thebaine and known drugs such as etorphine [17], buprenorphine [18] compounds (Figure 6).

Results and Discussion

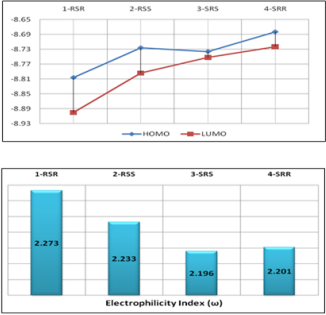
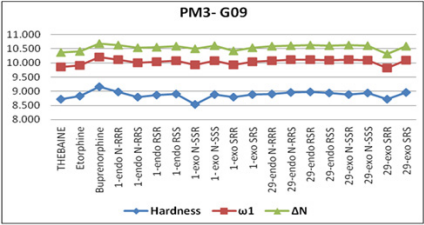
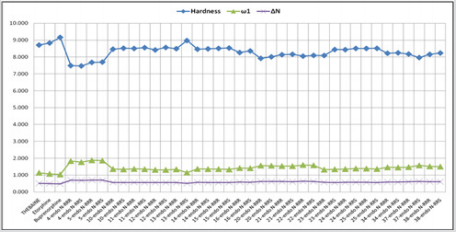
In the literature, the activity value and active configuration of thebaine were 2.51 and RSR form (Figure 8). Because of this, all possible configurations of thebaine were drawn and optimized the PM3 level of a semi-empirical method by using DS 3.5 [23] and Gaussian09 [22]. It is indicated that RSR form of thebaine was more stable than others with the help of various quantum chemical descriptors such as HOMO, LUMO and electrophilicity index,(ω), (Figure 1). Also, the difference between HOMO and LUMO of RSR configuration of thebaine has rather bigger magnitudes. The calculated electrophilicity index value of thebaine is also 2.273. As a result, all descriptors are validated and represent the stability of RSR form of thebaine in all possible configurations of thebaine. In the other words, theoretical calculations favor the experimental results of thebaine in literature (Figure 9).

Figure 8: The absolute stereochemistry of thebaine, (C19H21NO3).

Figure 9: The plots of A. HOMO-LUMO gap B. Electrophilicty index, (ω) of possible configurations of thebaine.

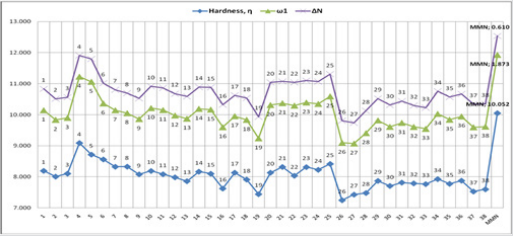
The various dienophiles (1-38):

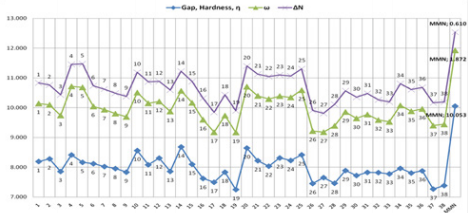
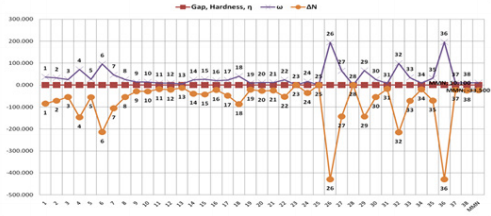
According to the obtained data from Gaussian09 and DS 3.5 software, the global hardness (η), electrophilicity index (ω), and electronic charge (ΔN) values were calculated for the dienophiles (Table 3), and MMN (Figure 7). These results are listed in Figures 10-13. Within Table 1, there are three frames including six or fivemembered aromatic heterocycles monosubstituted by electronacceptor and –donor groups. These frames are entitled A, B and C. The structural as well as electronic characteristics induced by chemical substitution are because of the different responses of the global electrophilicity power. For instance, 2-(4-nitrobenzylidene) malononitrile, (p-5) has a prominent difference for all quantum chemical descriptors in all dienophiles (1-38) and MMN. Because nitro is a strong electron-withdrawing group, it increases the electrophilic character. The -NO2 substituted benzylidene malononitrile structures, (o-4; p-5) have also shown the highest tendency in the electrophilicity index (ω) and electronic charge (ΔN) values. The second higher electrophilicity index (ω) value belongs to –CN-substituted structures (p-22).

Meanwhile, other descriptors favor this opinion, (Figures 10 & 11). On the contrary, the global hardness (η) value shows the lowest trend on A, B, and C frame shapes. In the first structure A, for 2-benzylidenemalononitrile (1), has higher electrophilicity index (ω) and electronic charge (ΔN) values, [ ω: 1,949; ΔN: 0,690] compared to MMN as standard reagent [ ω: 1,873; ΔN: 0,610]. For 2-benzylidenemalonitrile (1), the substitution of a hydrogen atom by a strong electro-donor group, such as -OH, (o-2; p-3) reduces the electrophilic character. Likewise, upon substitution of the hydrogen atom by different electro-donor groups (-CH3 (o-6; p-7) and -OCH3 (o-8; p-9)), the electrophilicity power further decreases. The –I (p-16), –Cl (o-12; p-13), –Br (o-14), –F (o-10), –Br (p-15), and –F (p-11) substituents classified in increasing order of electrophilicity power (ω), (Figure 10). As known, when the chemical substitution in the dienophile groups is increased by electro-donor groups, global electrophilic character decreases.

Figure 10: The global hardness (η), electrophilicity index (ω) and electronic charge (ΔN) of selected compounds, (1-38) and 2-methylenemalononitrile, (MMN) were obtained PM3 method by using Gaussian 09 software.

For example, (E)-2-methyl-3-(1-methyl-1H-indol-3- yl) acrylonitrile (p-27) has the worst behaviour of all quantum chemical descriptors in all dienophiles (1-38) and MMN. On the other hand, when electro-withdrawing groups (-SCH3, -N(CH3)2,- NHCOCH3, and -CN)s’ electrophilicity power further increases, it indicates an increase of reactivity towards a nucleophile. In addition to this, para position in any structure is preferred rather than ortho and meta positions for all dienophiles (1-38). As with the benzylidene analogues, replacement of pyridine (23, 24, 25) , indole (26; 27) and carbazole (28) in second group B, compound 25, which contains nitrogen group is also placed in a para position, exhibits good activity in others, (Figure 10), (see detail information Table 1 in Appendix.). In the last group C, including five-membered aromatic heterocycles monosubstituted by electron-acceptor and –donor groups, (Figure 10) demonstrates the decreasing order of electrophilicity index (ω) and electronic charge (ΔN) values, (thiophene > furan > pyrrole), respectively

For furan and thiophene compounds, the substitution of a hydrogen atom by an electro-donor group, –CH3, gives increase when –CH3 places to meta position instead of ortho position. However, upon substitution of a hydrogen atom on nitrogen by –CH3, decreases the activity based on the pyrrole. If –CH3 is replaced with –Ph group, these structures (37, 38) have the higher increase in group C. In addition, it mentioned nearly the same trend for the dienophiles and MMN at B3LYP/6- 31G* level of theory in 
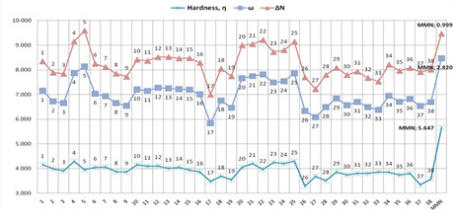
DFT method by using Gaussian 09 software (Figure 11). At the same time, the global hardness (η), electrophilicity index (ω), and electronic charge (ΔN) values were calculated for the dienophiles and MMN by using DS 3.5 software (Figures 12-13). As a result, the same behaviours of investigated compounds are shown (Figure 10 vs. Figure 12). Also, these results are rational and coherent for the various dienophiles and MMN, according to different methods such as PM3 and B3LYP/6-31G* level of theory in DFT methods by using Gaussian 09 software and PM3/VAMP and BLYP/DMol3 methods by using DS 3.5 software.

Figure 11: The global hardness (η), electrophilicity index (ω) and electronic charge (ΔN) of selected compounds (1-38) and 2-methylenemalononitrile, (MMN) were obtained B3LYP/6- 31G* level of theory in DFT method by using Gaussian 09 software.

Figure 12: The global hardness (η), electrophilicity index (ω) and electronic charge (ΔN) of selected compounds, (1-38) and 2-methylenemalononitrile, (MMN) were obtained at PM3/VAMP method by using DS 3.5 software.

Figure 13: The global hardness (η), electrophilicity index (ω) and electronic charge (ΔN) of selected compounds, (1-38) and 2-methylenemalononitrile, (MMN) were obtained at BLYP/DMol3 method by using DS 3.5 software.

In particular, the obtained results with PM3 and PM3/VAMP methods have similar numerical values and trends (Figures 10 & 12). However, there are logical and possible results with B3LYP/6- 31G* basis set (Figure 11). The results with BLYP/DMol3 method by using DS 3.5 software shows inconsistent and lacking correct logical relation data for the dienophiles and MMN (Figure 13). Furthermore, PM3 method in Gaussian 09 program is implemented for additional novel products in the further process of our work, because PM3 and PM3/VAMP methods in Gaussian 09 and DS 3.5 software have similar behaviour. However, BLYP/DMol3 method by using DS 3.5 software also exhibits extraordinary results. In Gaussian 09 software, PM3 and B3LYP/6-31G* levels of theory in DFT methods show consistency in their results, but the additional novel products are not suitable for analysis at B3LYP/6-31G* level of theory in DFT method by using Gaussian 09 program, due to rather huge and steric groups of studied compounds, (molecular weight: 400 – 600 g/mol).

Novel Addition Products

In the second part of the study, we first investigate and understand the differences in stereochemistry and predict the reactivity of thebaine and its novel and efficient addition products (Table 4) by using quantum chemical descriptors [24]. The new thebaine derivatives were evaluated according to the obtained 
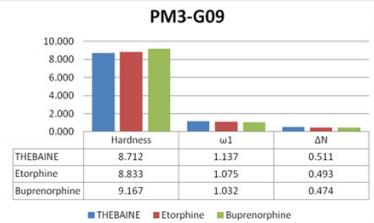
results with comparison to thebaine and known drugs, (Figure 6). The calculated descriptors of thebaine and known drugs were also given in Figure 14. Moreover, the diene system of thebaine 
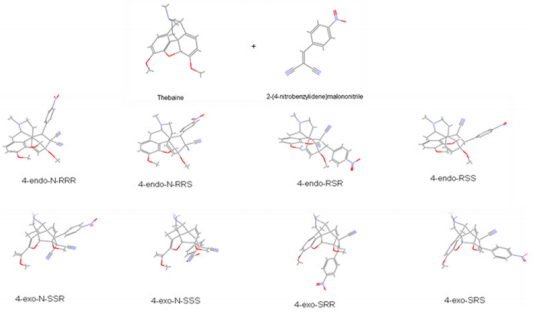
could potentially be attacked from both faces, yet reactions with dienophiles occur from the same face as the nitrogen bridge (upper face) due to the nitrogen bridge causing the lower face to be hindered through concealment inside a concave system. Thus, all possible configurations of additional novel products were computed at PM3 method by using Gaussian 09 software (Figure 15). This method was selected based on its attainable, suitable, and rational results in the former calculations for dienophiles (Table 3). It is known that global hardness provides information about stabilities of compounds [24].

Figure 14: The quantum chemical descriptors’ values of thebaine and known drugs such as thebaine, etorphine and buprenorphine structures.

Figure 15: The global hardness (η), electrophilicity index, (ω) and electronic charge (ΔN) of additional novel products (38*4 = 152 compounds, Table 2) were obtained by PM3 method by using Gaussian 09 software

Electrophilicity index provides comprehensive information about the structure, properties, stability, reactivity, interactions, bonding, toxicity, and dynamics of many-electron systems in ground and excited electronic states [27]. With respect to 
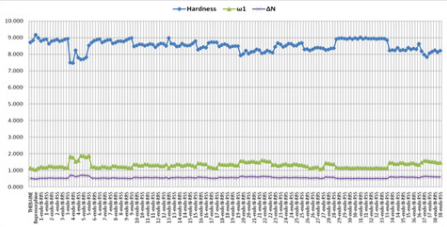
the obtained results, Figure 16 exhibited the trend of three quantum descriptors values of possible eight configurations of 2-benzylidenemalononitrile (1) in 6-ring compounds and 2-furan2-ly-methyl malononitrile (29) in 5-ring compounds in comparison to thebaine and known drugs. (See detail information Tables 3 & 4 for additional novel products in Appendix.) It showed that endoforms of 6- and 5-ring compounds were more stable than exoforms and more effective than thebaine and known drugs. As expressed above, endo forms of novel addition compounds were more stable than exo-form; thus endo forms of the compounds were separated in data. Then, the compounds include electron-withdrawing groups, exhibited better performance than the compounds that include electron-donating groups, such as -NO2 versus –OH. Afterwards, all investigations were applied only to the selected compounds.

These were 4, 5, 10-16, 20-25, 34, 37, 38, given as Table 5 in Appendix and the obtained results were represented in Figure 17. The Figure 17 shows that endo forms of 4 and 5 compounds have predominant properties compared to others in all quantum chemical descriptors. Also, the selected compounds were more effective than thebaine and known drugs (Figure 6).

Figure 16: The global hardness (η), electrophilicity index (ω), and electronic charge (ΔN) values of the possible eight configurations products of 2-benzylidenemalononitrile (1) and 2-Furan-2-ly-methyl malononitril (29).

Figure 17: The global hardness (η), electrophilicity index (ω) and electronic charge (ΔN) of addition novel products (18*4 = 72 Compounds, Scheme 3) were obtained in PM3 method by using Gaussian 09 software.

Conclusion

In summary, the global electrophilicity index introduced by Parr et al. [28-30] becomes a useful means of understanding the substituents in the diene/dienophile interacting pair. It also provides a way to classify the electrophilicity power of a series of dienophiles, the addition novel products of thebaine. Upon increasing dienophile substitution with electro-withdrawing groups, –F, –Cl, -Br, -I, (10-16), –CN, (20-22), and –NO2 (4-5) substituents, there is an increase in ω index, thus reflecting a higher electrophilic character. The structural and electronic characteristics induced by chemical substitution are due to different responses of the global electrophilicity power. The influence of the combination as well as the positional relationship of the substituents of each dienophile and the addition novel products can be analysed to develop most suitable reactions for the design of possible precursor to be integrated into synthetic sequences. Results are in agreement with those experimentally developed for each diene/dienophile pair in D-A reactions. Depending on the observed global hardness (η), electrophilicity index (ω), and electronic charge (ΔN) values, it can be assumed that for various benzylidene malononitrile and metilen malononitrile, the substitution of a hydrogen atom by a strong electro-withdrawing group, such as nitro –NO2 (4-o and 5-p), gives rise to an increase of the electrophilic character.

Acknowledgements

The authors acknowledge Y. Yildirir and F. Sevin Duz for data collection and E. Aki-Yalcin and ESIS research group for technical support.

For more Articles: https://biomedres01.blogspot.com/


Nanomedicine and Nano Formulations for Neurodegenerative Diseases

  Nanomedicine and Nano Formulations for Neurodegenerative Diseases Introduction Neurodegenerative diseases are characterized by the progres...