Monday, December 18, 2023

Omicron (B.1.1.529): Variant of Concern – A Mini Review


Omicron (B.1.1.529): Variant of Concern – A Mini Review

Introduction

Different variants of severe acute respiratory syndrome coronavirus 2 (SARS‐CoV‐2) have been identified since the first coronavirus disease 2019 (COVID‐19) infection appeared in December 2019. Until November 2021, the Delta variant was designated as variant of concern (VOC) because of different characteristics [1]. According to the Centers for Disease Control and Prevention (CDC), the variant responsible for increased transmissibility, severe disease course, reduced effectiveness of treatments, and many other alarming factors is designated as the VOC [2]. On 26 November 2021 the World Health Organization (WHO) Technical Advisory Group on SARS-CoV-2 Virus Evolution named the B.1.1.529 COVID-19 variant, first detected in Botswana and South Africa, as the Omicron variant of concern [3]. This variant carries an unusually high number of mutations, 32, on the spike (S) protein, the main antigenic target of antibodies generated by either infections or vaccination. The B.1.1.529 COVID-19 classification was based on a rapid increase in cases in South Africa, coinciding with an increase in detections of Omicron, a number of concerning mutations and early evidence suggesting an increased risk of reinfections.

The overall threat posed by Omicron largely depends on four key questions:

i. How transmissible the variant is;

ii. How well vaccines and prior infection protect against infection, transmission, clinical disease and death;

iii. How virulent the variant is compared to other variants; and

iv. How populations understand these dynamics, perceive risk and follow control measures, including public health and social measures (PHSM) [4].

Based on the currently available evidence, the overall risk related to Omicron remains very high. Omicron has a significant growth advantage over Delta, leading to rapid spread in the community with higher levels of incidence than previously seen in this pandemic. Despite a lower risk of severe disease and death following infection than previous SARS-CoV-2 variants, the very high levels of transmission nevertheless have resulted in significant increases in hospitalization, continue to pose overwhelming demands on health care systems in most countries, and may lead to significant morbidity, particularly in vulnerable populations [4]. The identification of Omicron as a variant of concern (VOC) by the World Health Organization (WHO) has triggered countries around the world to put in place travel restrictions and precautionary measures. Therefore this work aims to review Omicron variant impacts, transmissibility, viral infectivity, genomics and efficacy of existing vaccines.

Genomics of Omicron Variant

The unique genome features of the Omicron variant make it the most special SARS-CoV-2 variant to date. The genome constitutes 18261 mutations from which more than 97% mutations are present in the coding region, and the remaining 558 are detected in the extragenic region [5]. Mutations in the coding region are 2965 indels and non-synonymous, and synonymous singlenucleotide polymorphisms (SNPs) mutations are 11 995 and 2743, respectively [5]. Thirty mutations have been found within the spike proteins mostly located at the receptor‐binding domain (RBD) of the spike protein of the Omicron variant [6]. The excess number of nonsynonymous mutations in the Spike gene implies that the Omicron variant might evolve under selection pressure, which may come from antibodies or adaptation to new hosts. Reports show that there are three other deletions and one insertion mutation outside the spike protein (Figure 1). Preliminary data analyzed from the Global Initiative on Sharing All Influenza 101 Data (GISAID) showed that NTD contains 11 mutations, including six deletions and one insertion, with mutations N211 and ins214EPE being unique [7]. Interestingly, some of the mutations were already found in the previous VOC that helps in neutralizing antibodies [8,9]. Five different variants of SARS‐CoV‐2 have been considered VOC at different times [10]. Investigations performed by epidemiologists in South Africa identified the mutational data that manifests some of the concerning mutations (N501Y, D614G, K417N, and T478K) along with new mutations present in the Omicron variant, which increased the overall risk of reinfection, partial resistance to existing vaccines [10].

biomedres-openaccess-journal-bjstr

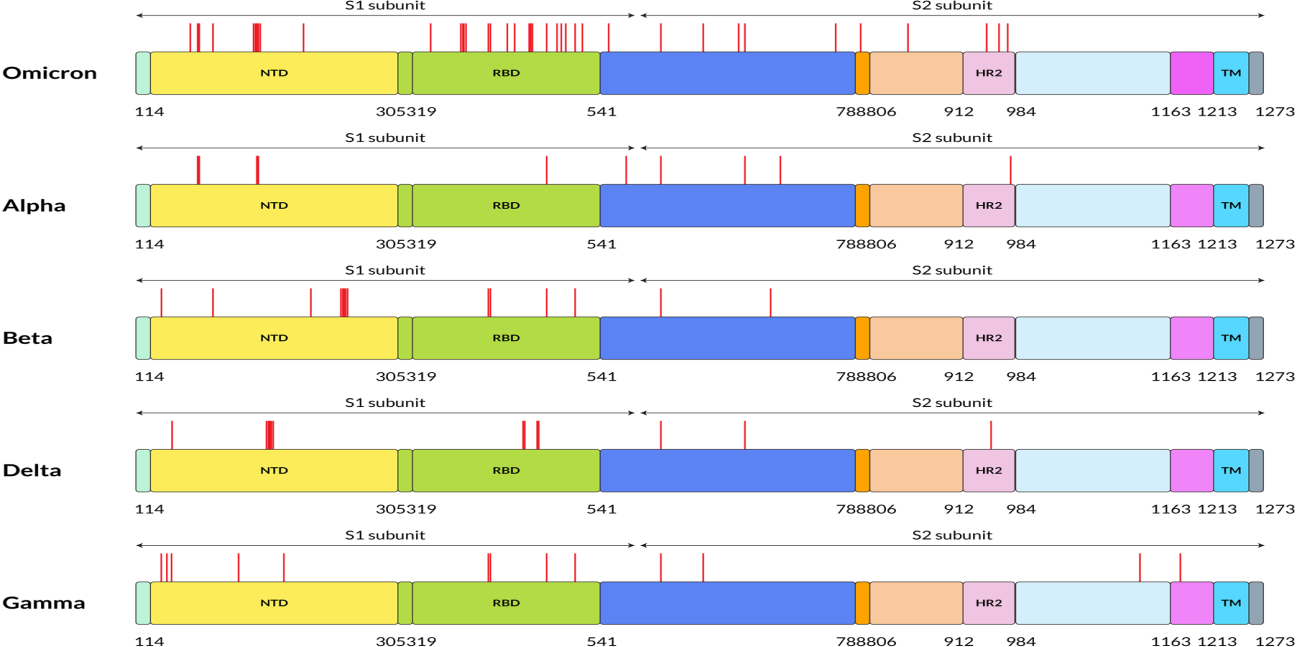
Figure 1: Five SARS-CoV-2 variants have different amino acid mutation locations on their S proteins. On this figure, red lines indicate the mutation locations on the S protein of SARS-CoV-2 at the specified positions. FP stands for fusion peptide, and pink color specifies HR2: heptapeptide repeat sequence 2, TM: transmembrane domain, which showed in sky shade, NTD: N-terminal domain shown in yellow and green color denotes RBD: receptor-binding domain.

Omicron variant is known to boost affinity for ACE2 receptors found on the surface of various human cells, including the lungs [11]. Even though Wuhan‐Hu‐1 has 1273 amino acids, the Delta variation has 1271, and the Omicron variant has 1270, both contain fewer residues than the wild‐type due to sequence loss [12]. Genome analysis by Kandeel et al. reported that the Omicron variant of SARS‐CoV‐2 forms a new monophyletic clade [13]. On the other hand, Wang et al. showed that the Omicron variant of SARSCoV‐ 2 evolved from the 20B clade and formed two sub-clades [14]. On the other hand, many of the variants were observed with the different protein sequences of the genome. The alpha (B.1.1.7), beta (B.1.351), gamma (P.1), delta (B.1.617.2), and omicron (B.1.1.529) variants are among the variants. These variants have different protein sequences as shown in Figure 2.

biomedres-openaccess-journal-bjstr

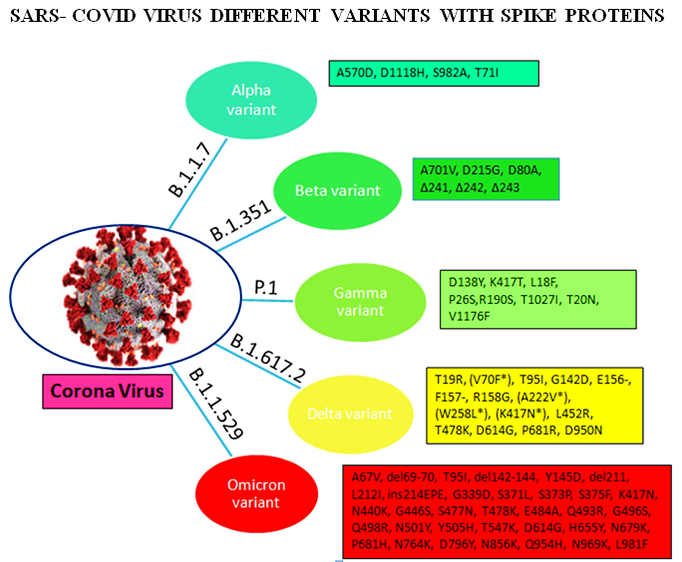
Figure 2: Different variants with their spike proteins

Transmissibility and Infectivity of Omicron variant

There is still a scarcity of sufficient essential data regarding the infection rate to analyze the transmissibility of the new heavily mutated Omicron variant. However, analysis from the early data of South Africa manifested that the Omicron variant can spread way more easily from person to person, though experts could not draw any conclusion within this short period [15]. The concern of Omicron variant transmissibility increases as it spreads worldwide within a few days, and cases have been increasing dramatically [16]. According to the report of CDC, a 2.5% increasing capacity of Omicron variant has been observed in the US within 2 weeks. However, in New York/New Jersey area, the infection rate is around 13%. On the other hand, in Britain, Omicron variant cases doubled every 2–3 days [15]. The infection rate of the Omicron variant in South Africa is increasing faster than any other country’s three previous waves. On November 30, the number of cases was 10.3%, shifting to 16.5% within two days. Surprisingly, on December 2 and 3, cases were 22.4% and 24.3%, respectively [17]. When the linear regressions of each pseudo virus were compared to the wild type over the entire range, it was discovered that while the Gamma variant had similar infection rates to the wild type, the Beta variant had less infection, and Delta was nearly twofold more efficient at infecting target cells. Infection rates were four times higher in the Omicron variant than in the wild type and twice as high in the Delta variant. These findings indicate that spike sequence influences infectivity, with the Omicron variant displaying more effective ACE2‐mediated infection than the wild type or other variant strains [18].

The infectivity of SARS-CoV-2 is mainly determined by the binding affinity of the ACE2 and RBD complex, although the furin cleavage site plays a crucial role as well [11]. Omicron has three mutations at the furin cleavage site and 15 mutations on the RBD, suggesting a significant change in its infectivity. Due to natural selection, the virus enhances its evolutionary advantages at the RBD either by mutations to strengthen the ACE2-RBD binding affinity or by mutations to escape antibody protection [12]. Since the virus has optimized its infectivity in human cells, one should not expect a dramatic increase in the viral infectivity by any single mutation. An effective infection pathway is for the virus to have multiple RBD mutations to accumulatively enhance its infectivity, which appears to be the case for Omicron. Furthermore, the new variant Omicron gives a false negative result in polymerase chain reaction tests because of the “S gene target failure,” which paves the way of spreading the infection at a higher speed worldwide [19]. Numerous factors can influence the high transmissibility of the Omicron variant. Genome sequenced data of the Omicron variant demonstrated more than 30 mutations in the spike protein by which the SARS‐CoV‐2 protein recognizes host cells [20]. Analysis of these mutations data indicates the chance of increased transmission by evading the immune response [21]. The N501Y mutation increases the binding affinity with the ACE2 receptor, which is a major influencer of increased transmission, and in combination with Q498R, the binding affinity gets stronger, and the Omicron variant gets easy access into the host [21]. Moreover, the risk of reinfection of previously COVID‐19 infected patients with the Omicron variant is very evident, indicating higher transmissibility [8]. Omicron variant mutations H655Y and N679K are present near the furin cleavage site (FCS) and can increase spike cleavage, making the virus more contagious [22,23]. On the other hand, P681H can multiply transmissibility by increasing the spike protein cleavage [24].

Disease Severity

Globally, there has been a 4% increase in the number of new deaths from in week 2 (10 – 16 January 2022) compared to the previous week, with highest increases in the South-East Asia Region (12%) and the Region of the Americas (a 7% increase). Data on case severity (including hospitalization, need for oxygen, mechanical ventilation, or deaths) are increasingly becoming available, improving our understanding of the impact of Omicron on severe cases, hospitalization and deaths. Surveillance trends from most countries show a decoupling between incident cases and hospitalizations in many countries, with proportionally lower incidence of hospitalization, given the level of community transmission, than what was observed with other variants. This decoupling appears to be driven partially by a lower intrinsic severity of Omicron compared to Delta, as well as by more preserved vaccine effectiveness against severe disease than against infection. Several studies have looked at the risk of hospitalization and severe disease with Omicron compared to Delta. The most recent analysis from the United Kingdom Health Security Agency with the Medical Research Council (MRC) Biostatistics Unit, University of Cambridge showed a 47% reduction in the risk of presentation to emergency care or hospital admission with Omicron compared to Delta and 66% reduction in the risk of admission from emergency departments [25]. A report by Imperial College London on 22 December 2021 [26] calculated a 41% reduced risk of a hospitalization resulting in a stay of one or more nights. Similarly, using a record linkage approach [27], a study in South Africa found that laboratoryconfirmed SARS-CoV-2 infected individuals with SGTF, as a proxy for Omicron, had lower odds of severe disease.

COVID-19 Vaccine Efficacy on Omicron Variant

The Omicron variant of SARS‐CoV‐2 was identified from the COVID‐19 vaccinated patients, suggesting the new variant’s immune invasion and demanded updated vaccines [28]. Saxena et al. analyzed the mutations reported in the RBD of the spike of Omicron variant of SARS‐CoV‐2 and hypothesized that currently, available entry inhibitors might not be effective for emerging variants [29]. The heavy mutation in the spike protein of the Omicron variant is related to increased infectivity and antibody evasion [30]. In SARSCoV‐ 2 convalescent or vaccinated people, the amount of neutralizing epitopes targeted by polyclonal antibodies is a significant predictor of the genetic barrier to viral escape. Single monoclonal antibodies are susceptible to escape mutations, but combinations targeting non-overlapping epitopes are more resistant [31]. Surprisingly, Omicron variant neutralization was undetectable in the majority of vaccines [7]. The computational approach also demonstrated that antigenic properties of the Omicron variant are ominous and correlated with its mutations [32]. Although various investigations have been performed to create effective vaccines, the emergence of new VOCs has raised concern over the efficacy of neutralizing antibodies induced by COVID‐19 vaccines as the Omicron variant has already infected vaccinated individuals in South Africa, Hong Kong, and many other countries [30,33,34].

The potential impact of the COVID‐19 vaccine is still being analyzed against this new variant. Two BNT vaccinations, which can provide more than 90% protection against serious disease when infected with the Delta variant, maybe significantly less effective against the Omicron type of SARS‐CoV‐2 [7]. However, the effect of COVID‐19 vaccines against the previous VOC, such as Delta, manifested the vaccine’s potential in reducing severe disease and death [35]. Moreover, multiple Delta transmissions from and between completely vaccinated persons were confirmed using genomic and epidemiological data [36]. As vaccine‐induced immunity is targeted through the spike proteins of the virus, heavily mutated Omicron variant spike protein is capable of reducing the neutralization activity of sera of vaccinated individuals that indicated less protection from Omicron variant [21].

Various Impacts of Omicron Variant

The current evidence on the potential impact of the Omicron variant reported by World Health Organization is explained briefly [4].

Impact on Epidemiology: As of 20 January 2022, the Omicron variant had been identified in 171 countries across all six WHO Regions. Omicron has a substantial growth advantage over Delta, and it is rapidly replacing Delta globally. There is now significant evidence that immune evasion contributes to the rapid spread of Omicron. Data on clinical severity of patients infected with Omicron are increasingly available. Epidemiological trends continue to show a decoupling between incident cases, hospital admissions and deaths, compared to epidemic waves due to previous variants. This is likely due to a combination of the lower intrinsic severity of Omicron, as suggested by a number of studies from different settings, and that vaccine effectiveness is more preserved against severe disease than against infection. However, high levels of hospital and ICU admission are nevertheless being reported in most countries, given that levels of transmission are higher than ever seen before during the pandemic. This is particularly important given that current evidence about severity and hospitalization has largely been shared from countries with high levels of population immunity, and there remains uncertainty about the severity of Omicron in populations with both lower vaccination coverage and lower prior exposure to other variants.

Impact on Diagnostics and Testing: The diagnostic accuracy of routinely used PCR and the WHO emergency use listing (EUL) approved antigen-detection rapid diagnostic tests (Ag-RDT) assays does not appear to be significantly impacted by Omicron. Most Omicron variant sequences reported include a deletion in the S gene, which can cause an S gene target failure (SGTF) in some PCR assays. As a growing minority of publicly shared sequences (including all BA.2 sub-lineage sequences) lack this deletion, using SGTF as proxy marker to screen for Omicron will miss Omicron lineages lacking this deletion.

Impact on Immunity: Current evidence consistently shows a reduction in neutralizing titres against Omicron in individuals who have received a primary vaccination series or in those who have had prior SARS-CoV-2 infection. In addition, increased risk of reinfection has been reported by South Africa, the United Kingdom, Denmark, and Israel. There is a growing body of evidence on vaccine effectiveness (VE) for Omicron, with data available from 15 observational studies from five countries (the United Kingdom, Denmark, Canada, South Africa, and the United States of America), evaluating four vaccines (mRNA vaccines, Ad26.COV2.S, and AstraZeneca-Vaxzevria). Available preliminary data should be interpreted with caution because the designs may be subject to selection bias and the results are based on relatively small numbers. Early data suggest that the effectiveness of studied vaccines is significantly lower against Omicron infection and symptomatic disease compared to Delta, with homologous and heterologous booster doses increasing vaccine effectiveness. Despite this, follow-up time after booster doses for most studies is short, and there is evidence of waning of VE in months following booster doses. VE estimates against severe outcomes, usually defined as hospitalization, are lower for Omicron than Delta, but mostly remain greater than 50% after the primary series and improve with a booster dose to above 80%. There are no effectiveness data for several vaccines, particularly the inactivated vaccines.

Impact on Host Tropism, Virus Fitness and Pathogenicity: Preliminary evidence suggests a potential shift in tropism of the Omicron variant towards the upper respiratory tract, as compared to Delta and the wild type (WT) virus that have a tropism for the lower respiratory tract. There is also evidence of less severe pathogenicity in the Syrian hamster (M. auratus) model, but this needs to be confirmed by peer-reviewed evidence and larger studies.

Impact on Therapeutics and Treatments: Therapeutic interventions for the management of patients with severe or critical Omicron-associated COVID-19 that target host responses (such as corticosteroids, and interleukin-6 receptor blockers) are expected to remain effective. However, preliminary data from nonpeer reviewed publications suggest that some of the monoclonal antibodies developed against SARS-CoV-2 may have impaired neutralization against Omicron. Monoclonal antibodies will need to be tested individually for their antigen binding and virus neutralization, and these studies should be prioritized. Preliminary in vitro data suggests that antivirals retain activity against Omicron.

Conclusion

Omicron (B.1.1.529) which has been designated as variant of concern (VOC) by World Health Organization (WHO) is distinct from the previous variants of SARS-CoV-2 (Alpha, Beta, Gamma, and Delta). Hence, the scientific community is searching for the impact of this new variant on the SARS-CoV-2, such as transmissibility, disease severity, diagnostic method, efficiency of existing vaccines and other COVID-19 protocols. This mini review has provided the latest data on the genomics, transmissibility and infectivity, diseases severity, vaccine efficacy and the current evidences on the variant impacts on epidemiology, diagnostics and testing, immunity, host tropism, virus fitness and pathogenicity and therapeutics and treatment. Meanwhile, the previous recommendations to tackle the COVID‐19 pandemic need to be maintained worldwide along with the newly improvised directions, such as genome sequencing of all the samples, maintaining social distance, continuing vaccination for everyone, and isolating the Omicron variant positive patients in a different place. WHO recommended countries strengthen surveillance and adopt necessary actions since the Omicron variant has been designated as a VOC.


For more Articles on: https://biomedres01.blogspot.com/

Friday, December 15, 2023

The Challenge Management of a Child with Cervical Spinal Cord Injury with Ultrasound Assessment of Respiratory Muscle: A Pediatric Case Report


The Challenge Management of a Child with Cervical Spinal Cord Injury with Ultrasound Assessment of Respiratory Muscle: A Pediatric Case Report

Introduction

Traumatic spinal cord injury (SCI) is commonly encountered and managed in the emergency department and the intensive care unit (ICU). More than 80% of traumas are caused by falls from height and road traffic accidents [1,2], and approximately 50% of the SCI are sustained at the cervical level that leads to severe high-level quadriplegia. Many of these patients develop respiratory compromise and respiratory failure, which require prolonged mechanical ventilatory support. Compromise in respiratory function remains the most common cause of mortality following a SCI [3]. The abdominal muscles comprise of transversus abdominis (TrA), internal oblique (IO), external oblique (EO), and rectus abdominis (RA). Together with the diaphragm, these muscles play a key role in regulating intra-abdominal pressure and assisting in activities including defecation, vomiting, coughing, sneezing, and childbirth [4,5]. Therefore, the evaluation of the function of the diaphragm and abdominal muscles is paramount in the management of SCI.

Studies have reported that the diaphragmatic and abdominal muscular functions can be assessed indirectly by ultrasound scan, which has the advantages of being a non-invasive, radiation-free, easily implementable, and reproducible assessment tool [6,7]. Here, we described a patient with SCI at the cervical level resulting in high-level quadriplegia and respiratory failure, which was complicated by pulmonary infection. We demonstrated the use of the point-of-care ultrasound (POCUS) in the management of this patient at the department of critical care medicine (CCM), which was beneficial in the monitoring of diaphragmatic and abdominal muscular functions and predicting the ultimate clinical outcome.

Case Presentation

A 12-year-old Chinese male sustained a cervical SCI (odontoid fracture associated with atlantoaxial dislocation) following a fall. Consequently, he developed high-level quadriplegia and was dependent on invasive mechanical ventilatory support. The physical examination revealed muscle strength grade 0 in the extremities, partially sensory but not motor function is preserved below the neck [ASIA (American Spinal Cord Injury Association) B classification]. He underwent an emergency open reduction and internal fixation for the odontoid fracture of C2. He was then transferred to the department of CCM for continuing respiratory support [synchronized intermittent mandatory ventilation with pressure support (SIMV+PS), respiratory rate (RR) 16/ min, pressure control (PC) 10cmH2O, PS 10cmH2O, positive endexpiratory pressure (PEEP) 5cmH2O, FiO2 30%] and further management. The arterial blood gas analysis revealed pH 7.378, PaO2 121.2mmHg, PaCO2 41.2mmHg, HCO3- 23.7mmol/L, and lactate 0.8mmol/L. The thoracic CT (computed tomography) scan showed a few infectious lesions and infiltrating shadows of both lungs (Figure 1).

biomedres-openaccess-journal-bjstr

Figure 1: CT images of the patient demonstrating a few infectious lesions and infiltrating shadows of both lungs.

Considering the requirement for prolonged mechanical ventilator support, a tracheotomy was performed on day-4 following the admission to the department of CCM. On day-5, an ultrasound scan was performed to measure the diaphragmatic motion (convex-array transducer [3-5 MHz] in M-mode) at the level of the midclavicular line of the subcostal region, and the diaphragmatic thickness (linear-array probe (>10 MHz) in B-mode) and thickening rate (linear-array probe (>10 MHz) in M-mode) at the mid-axillary line of the thoracic cage [5,8]. As demonstrated in Figure 2A, the diaphragm showed little movement and was depicted as a straight line in M-mode. The motion was almost zero. The diaphragm thickness measured approximately 0.22 cm during expiration (Figure 2B), which remained constant with respiratory movement, with both the thicknesses at the inspiratory phase and respiratory phase measuring at 0.2cm in M-mode (Figure 2C). The muscle thicknesses of TrA (0.23cm), IO (0.32cm), EO (0.33cm), and RA (0.35cm) were clearly observed and measured in B-mode (Figures 3A & 3C) at the midpoint between the inferior angle of the rib cage and the iliac crest and 2cm above the umbilicus at the level of the midclavicular line [5,9].

biomedres-openaccess-journal-bjstr

Figure 2: Ultrasound imaging of the patients’ diaphragm. A, Diaphragmatic motion during breathing at rest in M-mode. The echogenic line (blue arrow) indicated the diaphragm. B, Diaphragmatic thickness (the distance between A-A) during expiration in B-mode. C, Diaphragmatic thickening rate in B-mode. The A-A points indicated the diaphragm thickening during inspiration, and the B-B points indicated the diaphragm thickening during expiration.

biomedres-openaccess-journal-bjstr

Figure 3: Ultrasound imaging of the thickness of the abdominal muscles measured in B-mode at rest at day-5 (A, C) and day- 15 (B, D) following admission to the department of CCM. A, The external oblique (EO, A-A points), internal oblique (IO, B-B points), transversus abdominis (TrA, C-C points), and C, the rectus abdominis (RA, A-A points). B, the external oblique (EO, A-A points), internal oblique (IO, B-B points), transversus abdominis (TrA, C-C points), and D, the rectus abdominis (RA, A-A points).

Upon weighing the potential risks and benefits, with the supports of an external fixator, the patient was assisted to improve expectoration by changing the body position, patting the back, application of vibration row phlegm, and other measures, in addition to daily external electrical phrenic nerve stimulation, guided breathing exercises, and optimization of nutritional support to enhance the strength of the patient’s diaphragmatic and abdominal muscular function to the maximum. On day-15 following the admission to the department of CCM, a repeat scan was performed to re-assess the diaphragmatic and abdominal muscular function during breathing at rest. The muscle thicknesses of the diaphragm, TrA, IO, EO, and RA were 0.26cm, 0.63cm, 0.34cm, and 0.47cm, respectively (Figures 3B & 3D), while the diaphragmatic motion was measured at 0.74 cm (Figure 4A). The dynamic graph of the patient’s diaphragmatic motion was shown in video 1. During expiration, the diaphragmatic thickness was approximately 0.23 cm (Figure 4B).

biomedres-openaccess-journal-bjstr

Figure 4: Ultrasound imaging of the patients’ diaphragm at day-15 following the admission to the critical care unit. A, Diaphragmatic motion during breathing at rest in M-mode. The echogenic line (blue arrow) indicated the diaphragm. The distance between A-A indicated the diaphragm excursion. B, diaphragmatic thickness (the distance between A-A) during expiration in B-mode.

video 1.

When comparing with the initial measurements, the muscle thicknesses of IO and RA had markedly increased, together with a significantly higher diaphragmatic motion during breathing at rest. At the same time, arterial blood gas analysis was reviewed and the results were normal. Further clinical evaluation revealed that the patient could be weaned off the ventilator [ventilator mode: continuous positive airway pressure (CPAP), PS 8cmH2O, PEEP 5cmH2O, FiO2 21%]. Following the repeat scan, the patient was successfully weaned off the ventilator and was discharged from the department of CCM, after a total of 17 days of stay.

Discussion

Many patients with respiratory failure following a cervical SCI are dependent on chronic mechanical ventilation despite intensive respiratory rehabilitation. Our case highlighted the value of POCUS during the period of postoperative rehabilitation, enabling dynamic evaluation of the function of the diaphragm and abdominal muscles. The information generated from the POCUS provided objective recovery status of the patient’s respiratory function, which guided the clinician in decision making in weaning the patient off the ventilator. Respiration is a complex process mediated by the concerted action of the thorax and the abdomen. Normal breathing requires an open airway, intact and well-expanded thorax, lung tissue with good compliance and matching pulmonary artery blood flow, sensitive respiratory nerve center and neurotransmission system, and sound respiratory muscles. The respiratory muscles including the inspiratory muscles (the diaphragm and external intercostal muscles), the expiratory muscles (internal intercostal muscles and abdominal muscles), and the accessory respiratory muscles are essentials in the mechanistic of breathing through mediating intrathoracic pressure thereby altering the lung volume [10,11].

The respiratory compromise in SCI is secondary to the loss of movement of the respiratory muscles below the level of the injury [3]. The diaphragm and abdominal muscles are often overlooked in the ventilatory management and rehabilitation following SCI. The weakness in the action of the diaphragm and abdominal muscles leads to dyspnea and activity intolerance. In addition to generating forces that maintain the stabilization and support the movement of the spinal column, the abdominal muscles collectively pressurize the abdominal cavity. This not only is essential in active exhalation but also partakes in the cough mechanism for the removal of respiratory secretions. Furthermore, the diaphragm represents the main respiratory muscle, which when contracts, the thoracic cavity expands to enable active inspiration. On the contrary, when the diaphragm relaxes, the volume of the thoracic cavity decreases to facilitate exhalation. Synchronized contraction of both the diaphragm and abdominal muscles increases the intra-abdominal pressure, which assists in defecation, cough, removal of respiratory secretions, and other activities [5].

The deficiency in these functions is usually difficult to be ascertained and often delayed in the diagnosis, given that most screening tools for dyspnea do not encompass the assessment of the functions of the diaphragm and abdominal muscles. Consequently, this is not addressed early and represents a common cause for the failure of patients to be weaned off the ventilator and mortality from severe respiratory complications [12]. In recent years, the use of POCUS has become increasingly popular to assess the diaphragm and abdominal muscles in critically ill patients. Studies have shown that POCUS could accurately assess the thickness of the abdominal muscles and the diaphragm in addition to its thickening rate and motion. Moreover, it is a readily available tool in the critical care unit for performing bedside assessment, which is non-invasive and easily applicable. In our case, POCUS has been utilized to dynamically evaluate the daily functions of the diaphragm and abdominal muscles, guiding the clinicians in making decisions on respiratory rehabilitation and accurately weaning the patient off the ventilator and eventually almost complete recovery.

Conclusion

The optimal function of the diaphragm and abdominal muscles is paramount for effective lung ventilation that is often overlooked in the management of SCI. The routine and repetitive application of POCUS allows the clinician to objectively and dynamically evaluate and monitor the global function of the respiratory muscle pump, which predicts the risk for difficult weaning, weaning failure, and ultimate clinical outcome.


For more Articles on: https://biomedres01.blogspot.com/

Wednesday, December 13, 2023

Evaluation and Implementation of Health Quality Indicators in Anesthesia at Accredited SUS Hospital


Evaluation and Implementation of Health Quality Indicators in Anesthesia at Accredited SUS Hospital

Introduction

Quality and safety in anesthesia are generally monitored by analyzing perioperative mortality-morbidity and incidents [1]. However, these methods limited both sensitivity and specificity for quality and safety issues. Perioperative mortality and morbidity of patients are not always related to anesthesia. Incidents largely depend on employees’ willingness to report them. Consequently, several additional measures are increasingly promoted, mainly clinical indicator tools, and evidence suggests that the quality of care in hospitals can be improved [2]. Methods to evaluate performance from industrial engineering can be broadly applied to efforts to improve the quality of healthcare [2]. When reviewing the history of measurement of anesthesia-related outcomes, 72 anesthesiologists were asked, 56 (78%) completed the questionnaire asking for the opinion of anesthesiology experts on the results attributed to the anesthesia care that patients value [3]. The main results perceived by patients suggest significant variability among patients in what they believe is most important to avoid. Aiming to improve these results, the prospective collection and analysis of scientific data conducted by physicians and through and feedback is likely to improve patient care.

In recent times, numerous innovative efforts have been made globally by anesthesia experts to improve the methodology of measuring and reporting the quality of care provided to patients. One of the important methods involves feedback from patients and surgeons to improve the quality of anesthesia [4]. Continuous surveillance over quality measurement is essential, which can be carried out through effective monitoring and, therefore, can contribute to the maintenance and improvement of standards of care [5]. The study aims to create an easily accessible tool to assess indicators, monitor and assess the incidence of perioperative events related or not to anesthesia, monitor and assess the incidence of events in the posanesthetic care unit (PACU), verify the adherence of the tool in a hospital of the SUS accredited, and identify points to improve patient outcome. The secondary objective is the possibility of implementing such a computer program for smartphones after the initial study.

Methods

This is an observational, prospective, descriptive study, based on the application of a form to assess quality and health indicators in the anesthesia service at Hospital Municipal Clinical de São Bernardo do Campo, São Paulo, which has all the specialties, being recently accredited by the Canadian company Qmentum. The study protocol was developed with two types of forms on the Google platform: one for intraoperative assessment, and another for assessment at the PACU, to be filled out by the entire Anesthesia service team in order to assess and quantify adverse events, in order to prevent them or create ways to improve the quality of care. The population for the research will be formed from the completion of the form by health professionals involved in the Anesthesia service at the hospital. Due to the implementation of a service quality questionnaire during anesthesia and in the PACU, there was no need to fill out the free and informed consent form.

Results

The evaluation of the results was carried out monthly from July to December of the year 2019. In the hospital, 9,675 surgeries were performed, of which 1,693 (17.5%) were reported. Regarding the anesthetic technique used, 702 (41.4%) general anesthesia, 152 (8.9%) sedation, 155 (9.1%) spinal anesthesia and 684 (40.4%) combined technique. There were 96 records of complications, 40 (41.6%) referring to the respiratory system, 18 (18.7%) to the cardiovascular system, 8 (8.30%), to the neurological system, 7 (7.2%) to material and equipment and 10 (10.4%) to hospital systems and protocols. Only one report of death was observed. Twenty-nine facts do not present in the form were also reported, such as 2 (6.8%) records of 5 punctures to perform spinal anesthesia and 1 (3.4%) spinal needle with punctured cannon. Regarding PACU, there were only 525 properly filled out forms. The following were reported: 67 (12.8%) acute pain, 11 (2.1%) nausea or vomiting and 2 (0.2%) hypothermia. The time spent at the PACU averaged 1:33 hours.

Discussion

The quality and safety of anesthesia is usually analyzed based on the incidence and mortality related to the perioperative period through the reports of the involved anesthesiologists. Therefore, it depends on the doctors’ willingness to report the facts that occurred, which ends up affecting the way in which the data are analyzed. In this study, an easily accessible tool was created in the form of a form and requested by all anesthesiologists in the service to complete it, but there was little adherence to the method. Aiming to improve the quality of health, whether individual, community, regional or national, the increasing development of information has increased and communication technologies in virtually every area of health [6]. Technologies are used in research and education, knowledge transfer, social support, and various health services. Mobile technology is increasingly used in telemedicine, wireless monitoring of health outcomes in disease management and delivery of health interventions. Cell phones have been shown to be an important method of encouraging better patient-to-patient communication [6]. The use of smartphones is growing exponentially across the world. Their use by healthcare professionals and patients is increasing dramatically [7]. These facts led to the creation of this evaluation system during anesthesia and in the PACU, with a much greater adherence during anesthesia compared to PACU. In recent research, variation in the quality of apps and lack of user and physician involvement in their development were found across all pain apps in this one [8]. The usability test identified a range of user preferences. The six-month usage test at our hospital clearly showed that physicians (staffs and residents) have little affinity with these programs to improve the quality of their services.

Despite the low adherence, the form created for use during anesthesia and in the PACU collected important data. Regarding the anesthetic technique, a preference for general anesthesia over other techniques was observed. Otherwise, it will be possible to use this data to calculate the cost between the different techniques. However, this was not the object of implementation. The system implemented was able to assess the quality of the service, as a small failure rate was observed in the blocks, both in the peripheral nerve and for spinal anesthesia, in a significant number of such techniques. A greater number of complications related to the respiratory system was observed, which may be related to the fact that general anesthesia is the team’s main choice, however, further studies are needed to make this statement precisely. Regarding the cardiovascular system, there were four cardiac arrests in the period, and only one death. Material reports can help hospital management to purchase or exchange materials used to improve service delivery. Regarding the PACU there was a much lower adherence of the participants with only 31%, but it allowed to collect important information. Only 12.8% patients reported acute pain, 2.1% nausea or vomiting and 0.2% hypothermia. The average length of stay at the PACU was 1:33 hours. Such data allow us to observe the anesthetic quality of the team, since the vast majority of patients do not have complaints during recovery, which, in addition to providing wellbeing, can generate greater turnover in the operating room.

Conclusion

Quality and safety indicators are a useful tool to diagnose and prevent problems related to the perioperative period. The form used in this study is simple, free of cost and easy to perform, however, there was low adherence among the team. Even so, the information collected can help to prevent complications and, in addition, it can be used to demonstrate the quality that the anesthesiology service provides for the hospital and patients.


For more Articles on: https://biomedres01.blogspot.com/

Tuesday, December 12, 2023

Value of BI-RADS 3 Audits


Value of BI-RADS 3 Audits

Introduction

Screening mammography is a vital element of breast cancer detection that has helped to reduce disease mortality [1-4]. With the current screening strategy, yearly cancer detection rate in the US is approximately five per 1000 screens and fewer than 2% of screens prove suspicious and require biopsy [5-7]. In an effort to improve specificity, decrease cost, and reduce harm the American College of Radiology (ACR) established the Breast Imaging Reporting and Data System (BI-RADS) category 3 - probably benign designation to be used for short-term surveillance instead of immediate biopsy [8-10]. The morphological criteria for BI-RADS 3 include a solitary circumscribed mass with a solid ultrasound (US) correlate, focal asymmetry without an US correlate, and grouped, round calcifications [8,9,11]. Typically the designation of BI-RADS 3 is made after an initial diagnostic work-up and should not be assigned on a screening mammogram. The assignment of BI-RADS 3 activates a short-term (6-, 12-, and 24-months) follow-up protocol which has been demonstrated to reduce false-positive findings at biopsy, while also retaining a high sensitivity for earlystage breast cancer [9].

The designation of BI-RADS 3 is meant to indicate that a finding has a 2% or less risk of malignancy [8] and a recent retrospective report of 45,202 BI-RADS 3 cases from the National Mammography Database suggests that this expectation is concordant with reality [12]. However, institution-level evidence still suggest that in practice 0.9 – 7.9% of BI-RADS 3 lesions are upgraded to BI-RADS 4 and sent for biopsy [9,13-15]. Additionally, as the BI-RADS 3 designation is afforded some flexibility there is an appreciable amount of interobserver variability within each modality [16- 18]. As a result, monitoring adherence to imaging criteria can be challenging and there are relatively few established benchmarks for auditing BI-RADS 3 assignment. Herein, we share BI-RADS 3 audit results from our own institution over a four-year period and propose discrete auditing criteria that may help to establish performance benchmarks. We introduce the following metrics while on surveillance and which may serve as useful benchmarks:

(i) Percentage of initial BI-RADS 3 to total screens
(ii) Percentage of initial BI-RADS 3 to screen-recalled cases (BIRADS 0)
(iii) BI-RADS 3 upgrade rates within 24 months
(iv) Positive predictive value (PPV3) of lesions biopsied within 24 months
(v) Distribution of imaging morphology assigned a BI-RADS 3 category
(vi) Cancer yield.

Materials and Methods

Our institute is a large tertiary academic medical center (a NAPBC accredited and a breast imaging center of excellence by the ACR) in the northeast United States with an effective catchment area of nearly 1 million individuals. This retrospective study was approved by the Institutional Review Board (IRB) and is compliant with the Health Insurance Portability and Accountability Act. Information regarding the annual number of screening mammograms and the specific number of BI-RADS 0, and BI-RADS 3 cases were obtained from the Radiology Information System (RIS). All relevant BIRADS 3 Medical Record Numbers (MRNs) were identified with the assistance of the institute’s translational science core. All cases were reviewed in the electronic medical records at our institution. All data was extracted and compiled in Red Cap [19] by study personnel. Efforts were taken to standardize the data extraction process and to minimize inter-observer variability. A sample of ten records was collaboratively reviewed by all study personnel to standardize the data extraction and compiling of records from radiologist’s interpretation. Subsequently, the data were extracted from the remaining charts independently by four study personnel.

Subjects

The study included all women over 40 years of age recalled (BI-RADS 0) from screening and assigned BI-RADS 3 at a followup diagnostic evaluation from January 2014 through December 2017 at our institution. Our inclusion criteria were women who were assigned BI-RADS 0 on initial screening exam, and, assigned BI-RADS 3 from a diagnostic follow-up exam performed within 90 days of the screening exam, and, had at least one follow-up visit in the subsequent 24-month period. Exclusion criteria were women under 40 years of age at the date of their initial screening exam, or, BI-RADS 3 assessment following diagnostic assessment in a symptomatic patient, or, the follow-up diagnostic evaluation from a screening mammogram exceeded the 90-day time limit, or, did not have one or more evaluations in the 2-year follow-up period. The study was limited to mammographic and ultrasound evaluations only. All of the digital mammograms were performed at our multiple clinical sites on Hologic (Bedford, MA) Selenia® or Selenia® Dimensions™ units. Both full-field digital mammograms (2D) and Digital Breast Tomosynthesis (DBT) techniques [20] are employed at the time of the screening examinations. There are no clearly defined criteria with regards to who is offered a 2D mammogram and who is offered a DBT study.

All breast ultrasounds were performed on a Phillips (Bothell, WA) iU-22 unit by a dedicated breast sonographer, and when necessary, the radiologist will also personally scan the patient. At our institute BI-RADS 3 cases are evaluated at 6 months (ipsilateral breast), 12 months (bilateral) and 24 months (bilateral). At each time point, supplemental ultrasound as indicated was also performed. The data abstracted from the chart included the patient age at time of BI-RADS 3 designation as well as if the preceding BIRADS 0 mammogram was their baseline. We also recorded whether the BI-RADS 3 designation was made via diagnostic mammogram, or ultrasound, or both. The radiologist who assigned the BI-RADS 3 designation, the breast density category (A-D), the quadrantbased location, and the morphology of the BI-RADS 3 finding from mammography and ultrasound were recorded. The presence of follow-up imaging at 6, 12, 24 months was recorded and was used to calculate the follow-up rate. If a patient was deemed to be lossto- follow up at 24 months, the last known finding was recorded. If a biopsy was completed, the duration (months) after BI-RADS 3 assignment, modality used image guidance, and the histopathologic findings from the biopsied specimen were all captured.

Statistical Methods

The quantitative measures in this study are all reported as proportions/percentages. The Clopper-Pearson exact 95% confidence interval was computed. One sample tests of proportions were used to determine if the quantitative metrics differed from values reported in literature. All tests were two-tailed. Effects associated with p<0.05 were considered statistically significant. All analyses were conducted using statistical software (SAS version 9.4, SAS Institute, Inc., Cary, NC).

Results

Demographics

A total of 135,765 screening exams were performed during the four-year period from which 13,453 were recalled (Figure 1). A total of 1,360 women were assigned BI-RADS 3 of which 1,037 women met the study eligibility criteria during the four-year period. There were 24 unique radiologists who assigned BI-RADS 3 category during the study period. Eight out of the 24 radiologists were fellowship-trained in breast imaging and each of these eight radiologists assigned 50 or more BI-RADS 3 studies and accounted for 93% (n=969) of all included BI-RADS 3 cases. The mean age at time of initial BI-RADS 3 assignment was 56.6 ± 11.1 years with range of 40–94 years (Table 1). For 165 (15.9%) women, the BIRADS 0 mammogram that preceded their BI-RADS 3 assignment was the patient’s first mammogram. In terms of breast density, nearly half (49.6%, n=514) of all of the breasts studied were category B, followed by 37.1% (n=385) in category C, 8.29% (n=86) in category A, and 4.82% (n=50) in category D.

biomedres-openaccess-journal-bjstr

Figure 1: Flowchart describing the assignment and follow-up of probably benign findings and the associated quantitative metrics for clinical practice management.

biomedres-openaccess-journal-bjstr

Table 1: Patient demographics, prior mammograms, and breast density of BIRADS 3 patients (n =1,037).

BI-RADS 3 Features: Morphology, Laterality and Location

Nearly all (95.9%, n=994) of the BI-RADS 3 cases were assigned BI-RADS 3 on either mammogram/DBT alone, or mammogram/ DBT with ultrasound. The remainder (3.95%, n=41) of cases were assigned BI-RADS 3 on ultrasound (Table 2). The imaging morphology breakdown of the 1037 cases were asymmetry/ architectural distortion (n=512, 49%), grouped calcifications (n=398, 38%), and non-calcified circumscribed mass (n=90, 9%). The remaining 37 BI-RADS 3 cases (4%) were called at the discretion of the radiologist and the electronic records did not document the classic descriptors for a BI-RADS 3 assessment. The assignment of BI-RADS 3 lesions was relatively even with 49.8% (n=516) in the left breast, 44.6% (n=462) in the right breast, and 5.70% (n=59) of cases bilaterally. The upper outer quadrant had the greatest number of lesions in both the right (n=232, 38.0%) and the left (n=195, 35.3%) breasts, followed by the subareolar/central region in the right (n=140, 22.9%) and left (n=115, 20.8%) breasts.

biomedres-openaccess-journal-bjstr

Table 2: Imaging characteristics including modality that resulted in BIRADS 3, lesion location and lesion morphology, and followup.

Follow-up of BI-RADS 3 Lesions

The follow-up rate at 6 months was 97.1% (1,007/1,037) and decreased progressively to 95.8% (979/1,022) at 12 months and 86.6% (876/1,011) at 24 months (Table 2). The denominator is adjusted for lesion downgrade due to benign pathology from biopsy at prior follow-up. Among the 1,037 BI-RADS 3 patients, 7.4% (n=77) of all the cases underwent biopsy, of which n=23, n=40 and n=14 cases were biopsied at 6 months, 12 months and 18-24 months, respectively. A majority of the biopsies (n=47, 61%) of the biopsies were performed under ultrasound guidance and the remainder (n=30, 39%) using stereotactic mammography. The distribution of biopsies at different follow-up periods was as follows: 23/77 (30%) at 6 months, 40/77 (52%) at 12 months, and 14/77 (18%) were performed between 18-24 months.

biomedres-openaccess-journal-bjstr

Table 3: Quantitative benchmarks for clinical practice management.

Quantitative Benchmarks

The quantitative benchmarks suggested for routine clinical practice management are summarized in Table 3. The percentage of initial BI-RADS 3 to total screens was 0.76% (1,037/135,765) and the percentage of initial BI-RADS 3 to screen-recalled cases (BIRADS 0) was 7.7% (1,037/13,453). Within the 24-month follow-up period, the BI-RADS 3 upgrade rate was 7.4% (77/1,037). Among the 77 lesions biopsied within 24 months following BI-RADS 3 assignment, there were 26 malignancies, resulting in positive predictive value (PPV3) of 33.8% (26/77). Among the 26 cancers, 62% (n=16) were biopsied under ultrasound guidance, while 38% (n=10) were biopsied under stereotactic mammography. The cancer yield within the 24-month follow-up period was 2.51% (26/1,037). Among these 26 cancers, 30.8% (8/26) were detected at 6 months, 57.7% (15/26) at 12 months and 11.5% (3/26) at 18-24 months. The most frequently identified cancer type was ductal carcinoma in situ (DCIS) with 46% (12/26) of the cases. This was followed by invasive ductal carcinoma (IDC) at 42% (n=11) and invasive lobular carcinoma (ILC) at 12% (n=3).

Discussion

The purpose of introducing the BI-RADS 3 categorization in the BI-RADS atlas [8] was to reduce the harms of screening by decreasing the number of false positives biopsies, reducing the cost of health care and yet maintaining sensitivity for early detection of breast cancers. Although the BI-RADS atlas specifies the probability of cancer in this subset as 2% or less, there has been no established routine audit in recent times for various clinical practice settings [17,21]. We therefore conducted a retrospective review of our own data as a quality assurance project to better guide clinical practice management. In our study over a 4-year period of 1,037 BI-RADS 3 cases following an inconclusive (BI-RADS 0) screening mammogram, the cancer yield was 2.5% (n=26) during the 2-year surveillance period. The observed cancer yield was not statistically different (p=0.243) from the 2% probability of malignancy as described in the BI-RADS atlas. Our cancer yield did not significantly differ with the 1.86% cancer yield reported by Berg, et al. [12] (p=0.123) but was significantly higher than the 1.47% reported by Micheals, et al. [21] (p=0.006), the 1.02% reported by Lehman, et al. [22] (p<0.001), and the 0.8% reported by Baum, et al. [23] (p<0.001).

Among the 26 cancers detected within the 2-year follow-up period, 8/26 (30.8%) were detected within the first 6 months and supports the value of the short-term (6 months) follow-up. The ratio in our series was different from Berg, et al. [12], where 58% cancers were identified at 6 months (p=0.005). During the first 12 months of follow-up, 23/26 (89%) cancers were detected and is comparable to the 73% reported by Chung, et al. [24] (p=0.076). In keeping with multiple prior studies [11,12,21] most of our cancers were DCIS 12/26 (46%). There were 11/26 (42%) invasive ductal carcinomas and 3/26 (12%) invasive lobular carcinomas in our series. The invasive cancers were early-stage cancers. In our study, during the 2-year surveillance, 77/1,037 (7.4%) cases were upgraded to BIRADS 4/5 and were biopsied. This rate was higher than the 5.9% reported by Michaels, et al. [21] (p=0.037) and 0.88% reported by Vizcaino, et al. [15] (p<0.001). The positive predictive value (PPV3) in our series was 26/77 (34%), which is larger than the 16.6% in Berg, et al. [12] (p<0.001) and comparable to the 25% in Michaels, et al. [21] (p=0.076). In our study, the proportion of BI-RADS 3 to the number of recalls (BI-RADS 0) was 10.1% (1,360/13,453) among all women and 7.7% (1,037/13,453) among study eligible women. In our literature search on PubMed, we could not identify any publication that reported on the use of this metric. We suggest including this metric as part of routine audits for clinical practice management.

To establish a benchmark across different practice settings, there is need for sharing recent data from varied clinical settings (academic and private, dedicated and non-dedicated breast imaging practices). The above referred indices could serve as a useful benchmark of a practice’s quality assurance. Age, ethnicity, lack of transport, education, and cost of care all result in disparities and barriers that contribute to a poor follow-up. Poor compliance to follow-up would directly impact the cancer yield in BIRADS-3 cases. While the literature [12,21,23,24] describes loss to followup as a major concern, in our series the follow-up rates were good with 97% at 6 months, 94% at 12 months and 84% at 24 months. In Michaels, et al. [21] the compliance for follow-up progressively declined from 83% at 6 months to 54% at 24 months. In Baum, et al. [23], the studied cohort only had a 71% compliance with follow-up. The current edition of BI-RADS atlas clearly discourages assignment of BI-RADS 3 from a screening examination without a complete diagnostic workup. However, prior literature did not make that clear distinction [12]. The BI-RADS atlas clearly outlines the morphology criteria for assignment of BI-RADS 3 under mammogram, ultrasound and MRI; however, it also mentions that the radiologist’s experience and discretion could determine the assignment.

The distribution of the different morphologies contributing to a BIRADS-3 assignment in our study was asymmetry/focal asymmetry/architectural distortion was 49% (512/1,037), microcalcifications 38% (398/1,037), non-calcified circumscribed mass on mammogram or ultrasound or both was 9% (90/1,037) and 4% (37/1,037) of the assignments were at the discretion of the interpreting radiologist without one of the above descriptors in the report. In most studies [13,14,15,21] calcifications accounted for greater than 50% of the BI-RADS 3 assignments, except in Varas, et al. [14], where calcifications accounted only for 19% of the BI-RADS 3 assignment. Institutional policies, reader variability and access to care may be contributing to these differences. Also, radiologist’s experience and fellowship-training may influence interpretation [18]. Dedicated fellowship-trained breast imagers and general radiologists performing breast imaging are known to differ in their evaluation and assessment of breast lesions [17,18]. Literature also mentions of varying cancer yields depending on whether dedicated breast imagers or general radiologists interpret breast exams [2,18,21]. The majority of our BIRADS 3 cases at our facility were reviewed by dedicated fellowship-trained breast imagers. Another factor contributing to variability that has been recently reported is the patient’s age with cancer yield exceeding 2% for women older than 60 years of age [25].

Also, after the introduction of DBT, there is literature indicating better visualization of architectural distortion, some of which lack an ultrasound correlate [26]. During the early stages of DBT adoption in clinical practice, there was lack of a DBT-guided biopsy device and hence consensus among the radiologists on the management of these lesions. Further, there is also variability among radiologists [16] in terms of lesion descriptors that could contribute to variability in assigning BI-RADS 3 category. Ambinder et al [18], refers to the decreasing incidence of BI-RADS 3 post-DBT implementation. All of these factors contribute to inter-reader and inter-facility variability and have resulted in wide variability across practices in the assignment of BIRADS 3 as a percentage of the total screens. We feel that larger data set from across the country may help us define some benchmarks necessitating practices to review their policies should there be large variances from established benchmarks.

Limitations

Our study had limitations. The study was retrospective in nature. Only mammographic and ultrasound features were considered. Prior to mid-2016 when we acquired the capability to perform tomosynthesis guided biopsies, architectural distortion without an ultrasound correlate were assigned BIRADS 3 at our institute. On review of our records, architectural distortion and asymmetry, though distinct morphologies, were sometimes used interchangeably in the report. Hence, we merged the two categories for analysis rather than attempt to distinguish them. We did not specifically account for downgrades to BIRADS 1 and 2 during follow-up, which is likely a very small proportion, since a majority of our breast imagers continue to follow up cases assigned a BIRADS-3 for the entire 24-month surveillance.

Conclusion

Audit of BIRADS 3 metrics has the potential to provide additional insights for clinical practice management. Many of the criteria referred to in this paper (cancer yield, BI-RADS 3 as a percentage of screens, as a percentage of BI-RADS 0, distribution of the morphology of BI-RADS3 assignments, upgrade rates, positive biopsy rates) may serve a useful role in monitoring clinical practice and for establishing the optimal range for the appropriate use of the BI-RADS 3 category. Larger data sets from varied clinical settings, with inputs from an expert committee could help establish benchmarks for these metrics.


For more Articles on: https://biomedres01.blogspot.com/

The Skin Aging Process and Anti-Aging Strategies

  The Skin Aging Process and Anti-Aging Strategies Introduction Appearances play a vital role in society as it is how one communicates to ot...