Monday, October 30, 2023

Influence of Abrasive Peeling of Wheat-Tritical Grinding Grain Mixture on the Yield of Intermediate Grinding Products and Flour


Influence of Abrasive Peeling of Wheat-Tritical Grinding Grain Mixture on the Yield of Intermediate Grinding Products and Flour

Introduction

Current directions of development of one of the most important branches of the processing industry - flour milling is both the improvement of technologies for processing traditional crops (wheat and rye), and the development of new technologies for processing non-traditional crops, such as triticale [1-2]. One of the main directions of development of the industry is the development of new and improvement of traditional technologies and the creation of processed products of various types of grain with a given composition and properties, including products of deep processing [3-5,6,7]. In addition, the direction of joint processing of grain of various crops, including wheat and triticale, is very promising. Triticale is the first grain crop created by man and obtained by crossing wheat (Latin Triticum) and rye (Latin Secale). The use of triticale as a food crop is an interesting, promising direction not only for the flour milling, but also for other branches of the food and processing industries. This is confirmed by the increased interest in this culture, both from researchers and from food producers not only in our country, but also abroad. Bakery products using processed products from the central part of the endosperm of triticale grain are characterized by increased nutrition due to a higher protein content and essential amino acids, in particular the main limiting acid - lysine [8-11]. The combination of positive properties of rye - a high content of biologically active aromatic substances and wheat - the rheological properties of the dough, allow making food products of mass consumption from processed products of triticale grain and mixtures based on it.

At the same time, the technological properties of baking flour obtained from various grain mixtures, including wheat-triticale grain grinding mixture, remain poorly understood. Peeling of the wheat-triticale grain mixture during varietal bakery grinding is carried out for maximum cleaning of the grain surface from dust, dirt, mold, bacteria, as well as reducing and simplifying the length of the technological scheme [12-14]. Removal of surface shells with the use of peeling machines allows, in addition, to reduce the number of peeling and grinding systems and reduce the technological process of processing the milling wheat-triticale grain mixture into flour.

When using abrasive peeling in the finished product, the number of shell particles is reduced, and its appearance is improved [15,16]. The ash content of the milling grain mixture of wheat and triticale decreases after peeling. Removal of membranes allows: - get a more solid and hygienic clean product; - to obtain from the stripped systems bakery flour with a higher index of whiteness; - significantly reduce the number of grinding and sieve systems, simplify the technological scheme of grinding. In addition, it should be noted that in the process of peeling from the surface of the grain, not only impurities are removed, but also part of the fruit and seed shells. This, on the one hand, has a positive effect on reducing the process of moistening the grain, but on the other, due to the exposure of the endosperm and injury to the germ of the grain, it can lead to a loss of its viability, which is not given enough attention.

In this regard, additional studies of the peeling process and its effect on the properties of wheat grain are required [14]. The purpose of our research is to determine the effect of abrasive peeling on the yield of intermediate products of grinding and flour in the processing of peeled wheat-tritical grain mixture in varietal bakery grinding.

Research Materials and Methods

In studies conducted at the Department of Grains, Bakery and Confectionery Technologies of the Federal State Budgetary Educational Institution of Higher Education “MSUPP” and at the Department of Food Technologies and Organization of Restaurant Business at the I.S. Turgenev Oryol State University, experiments were conducted to determine the effect of the degree of peeling of the wheat-triticale grain mixture on the output of intermediate grinding products. The objects of research were wheat of the “Radmira” variety and triticale of the “Nemchinovsky 56” variety, bred by breeders of the Federal Research Center “Nemchinovka” and differing from other wheat varieties by the increased protein content of the 2020 harvest. The main physical, chemical and chemical parameters of the initial wheat-triticale grain mixture are as follows: humidity - 11.2%, ash content - 1.83%, protein content - 13.2%, gluten content - 23.8%, gluten quality - 79 units of the device, vitreousness - 46% and drop rate - 354 seconds. When preparing the wheat-tritical grain mixture for laboratory grinding as a hydrothermal treatment (GTO), a mandatory operation for varietal grinding, cold conditioning was used as the most common method and the cheapest method. After hydrothermal treatment, abrasive peeling was carried out before grinding wheat-tritical grain mixtures. For grinding, a laboratory grinding mill MLP-4 with rifled rollers with a groove arrangement of the back along the back was used.

The main mechanical and kinematic indicators of the mill MLP- 4 with rifled rollers are as follows: productivity - up to 100 kg / h, the speed of the fast-rotating roller is 4.5 m / s, the differential is 1.75, the location of the backrest grooves, the number of grooves on the 1st linear centimeter - 8 pieces, the slope of the grooves is 8%.

The intervalian clearance on the I drain system was 700 μm, on the II drana system - 300 μm, on the III drana system - 150 μm and on the IV dranaya system - 100 μm. When conducting studies to determine the effect of the number of removed shells in abrasive peeling of wheat-triticale grain mixtures on the yield of intermediate products of grinding, laboratory grindings of shelled wheat-triticale grain mixtures were carried out with preliminary removal of shells in the amount of 2.5%, 5.0%, 7.5%, 10% and a control sample without peeling.

Next, laboratory grindings were carried out and 4 of the 5 main, cereal-forming dredge systems were modeled when grinding the initial wheat-triticale mixture and peeled wheat-triticale grain mixtures. The data obtained to determine the effect of abrasive peeling on the grain-forming ability of peeled wheat-triticale grain mixtures are presented in (Tables 1-5).

As can be seen from (Table 1), the yield of intermediate grinding products during the processing of the initial wheat-triticale grain mixture without peeling, sent for grinding to grinding systems, was 63.6%, the yield of wheat-triticale flour was 12.0%, the yield of a similar product sent to the V draught system was 19.3%. As can be seen from Table 2, the yield of intermediate grinding products during the processing of a peeled wheat-triticale grain mixture with a removal of 2.5%, sent for grinding to grinding systems was 67.4%, the yield of wheat-triticale flour was 12.1%, the yield of a similar product sent to the V strip system was 17.8%.As can be seen from (Table 3), the yield of intermediate grinding products during the processing of a peeled wheat-triticale grain mixture with a removal of 5.0%, sent for grinding to grinding systems was 65.3%, the yield of wheat-triticale flour was 12.5%, the yield of a similar product sent to the V strip system was 17.1%. As can be seen from (Table 4), the yield of intermediate grinding products during the processing of a peeled wheat-triticale grain mixture with a removal of 7.5%, sent for grinding to grinding systems was 67.6%, the yield of wheat-triticale flour was 13.3%, the yield of a similar product sent to the V draught system was 16.9%. As can be seen from (Table 5), the yield of intermediate grinding products during the processing of a peeled wheat-triticale grain mixture with a removal of 10.0%, sent for grinding to grinding systems was 68.7%, the yield of wheat-triticale flour was 14.1%, the yield of a similar product sent to the V strip system was 15.4%. Thus, according to the results of the studies, it was found that the greatest yield of intermediate products of grinding and flour during the processing of the wheattriticale grain mixture is obtained by removing 10% of the shells and is 82.8%, which is 6.9% more compared to the original nonpeeled grain.

biomedres-openaccess-journal-bjstr

Table 1: Yield of intermediate products of grinding and flour of the initial wheat-triticale grain mixture without peeling.

biomedres-openaccess-journal-bjstr

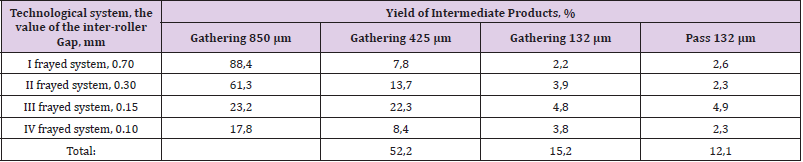
Table 2: The yield of intermediate products of grinding and flour during the processing of hulled wheat-triticale grainmixtures with the removal of 2.5% of the shells.

biomedres-openaccess-journal-bjstr

Table 3: The yield of intermediate products of grinding and flour during the processing of hulled wheat-triticale grain mixtures with the removal of 5.0% of the shells.

biomedres-openaccess-journal-bjstr

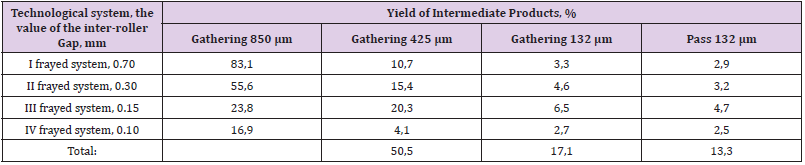
Table 4: The yield of intermediate products of grinding and flour during the processing of hulled wheat-triticale grain mixtures with the removal of 7.5% of the shells.

biomedres-openaccess-journal-bjstr

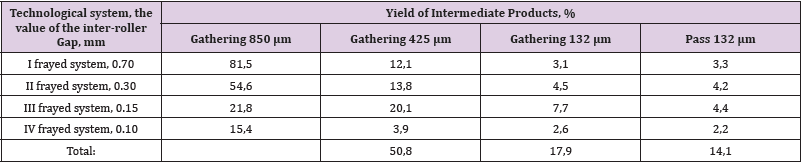
Table 5: The yield of intermediate products of grinding and flour during the processing of hulled wheat-triticale grain mixtures with 10% shell removal.

Findings

Thus, according to the results of the studies, it was found that abrasive peeling with the removal of up to 10% of the shells of wheat-tritical grain mixtures before grinding into varietal baking flour has a positive effect on the cereal-forming ability and leads to an increase in the yield of intermediate cereal grinding products and an increase in the yield of flour on the pulled systems. The greatest yield of intermediate products of grinding and flour during the processing of the initial wheat-tritical grain mixture is obtained by removing 10% of the shells and is 82.8%, which is 6.9% more compared to the original non-peeled wheat-tritical grain mixture.


For more Articles on: https://biomedres01.blogspot.com/

Saturday, October 28, 2023

Evaluation of Clinical Transfusion Practices in Neonatal Intensive Care Unit


Evaluation of Clinical Transfusion Practices in Neonatal Intensive Care Unit

Introduction

Appropriate transfusion of neonates is vital to balance the transfusion benefits against risk. Sick neonates are heavily transfused groups of patients in critical care medicine. The rational utilization of blood components is very consequential in this age group. It, consequently, remains an important tool to continuously improve, amend and implement the most appropriate transfusion protocols for blood components utilized in neonates within the constraint of the evidence-based guidelines. Because of the length of their stay in the neonatal intensive care unit (NICU) and the frequent monitoring of parameters through blood sampling neonates experience iatrogenic blood loss and may require multiple transfusions. Majority of the neonatal transfusions are often prescribed on expert clinical opinion rather than concrete documented guidelines [1]. Lack of perspective patient blood management (PBM) program in neonates accentuates the blood management and best transfusion practices in the neonatal intensive care unit (NICU). Due to the lack of sufficient data from India focusing on transfusion needs, patterns, indications, and short-term outcomes in preterm neonates prompted the requisite for this study.

Materials & Methods

Study data were collected retrospectively over 19 months from June 2019 to December 2020. All preterm and term neonates admitted to the Neonatal Intensive Care Unit (NICU) at All India Institute of Medical Sciences (AIIMS) Jodhpur, Rajasthan, India, for whom blood requisition form was sent for component transfusion, i.e., Packed Red Blood Cells (PRBC), Random Donor Platelets (RDP), Fresh Frozen Plasma (FFP), Cryoprecipitate, Reconstituted Whole Blood, were included in the study. Data was collected from NICU medical records and review of the NICU blood order forms at the AIIMS Jodhpur blood center. According to British Society for Hematology (BSH) guidelines [2]. Those blood order forms were considered appropriate and satisfied all the transfusion criteria required to evaluate transfusion needs according to the BSH guidelines [2]. Inappropriate blood order forms are those which deviate from the guidelines and include incomplete documentation (i) for PRBC transfusion missing Hemoglobin (Hb), Weight of newborn (wt.), Saturation status (SpO2), (ii) for RDP transfusion missing platelet count, comorbidity or surgical or invasive procedure patient is undergoing, and (iii) for FFP transfusion coagulation parameter, bleeding at present and patient is undergoing some invasive procedure. Data analysis was done with descriptive statistics. Perpetual variables will be summarized as mean & standard deviation. Nominal/categorical variables will be summarized as the proportion (percentage) and analyzed by utilizing the Chi-Square test/Fisher exact test. P-value < 0.05 was considered as significant (Tables 1-4).

biomedres-openaccess-journal-bjstr

Table 1: Blood component issued as per Birth weight, maturity, gender, mode of delivery & gestational age.

biomedres-openaccess-journal-bjstr

Table 2: Transfusion Parameter of neonates.

biomedres-openaccess-journal-bjstr

Table 3: Outcome assessed based on no of transfusion.

biomedres-openaccess-journal-bjstr

Table 4: Reason for inappropriate request order form.

Results

Data were analyzed retrospectively from June 2019 to December 2020. There were 390 NICU admissions during the study period, and 303 blood order forms were received. PRBC was the most frequently ordered blood component (165), followed by RDP (91), FFP (34), reconstituted whole blood (12), and cryoprecipitate (1) (Figure 1). Out of 303 received blood order forms, blood was issued for 225 requisitions (74%). Most frequent blood component issued was PRBC (113/225, 50%) followed by RDP (80/225, 35.5%), FFP (26/225, 11.5%) and reconstituted whole blood (6/225, 0.02%). NICU’s overall crossmatch to transfusion ratio (CT ratio) was 1.46 suggesting a significant utilization of blood components. During the study period, male admissions outnumber female admissions (251 vs. 139 respectively), and male requisitions received outnumber females (166 vs. 137 respectively). Females received more transfusions (p-value 0.000, chi-square 16.2), with PRBC accounting for the majority of transfusions in terms of gender predisposition. Out of the 303 requisitions received, the majority of the neonates were born through lower segment cesarean section (LSCS) compared with vaginal delivery and required frequent PRBC transfusions (166 v/s 137).

Out of the 390 NICU admissions, 187 were preterm (<37 weeks), and the rest were term. Requisitions received were higher for preterm neonates than term neonates (163 vs. 140 respectively). Out of the 163 preterm requisitions, 125 were issued and transfused (125/163; 77%), while for term babies, out of 140 requisitions, 94 were issued and transfused (94/140; 67%). Out of all the preterm transfusions, PRBC was the most frequent blood component transfused (73/125; 58%), followed by RDP (37/125; 30%) and FFP (15/125; 12%). While in term babies, RDP was the most frequent blood component transfused (43/94; 46%), followed by PRBC (40/94; 43%) and FFP (11/94; 12%). However, no significant association between transfusion requirement and maturity status (extreme preterm, very preterm, late preterm, and term patients) was seen (p-value 0.210).

biomedres-openaccess-journal-bjstr

Figure 1: Component order form appropriateness ( p value 0.001).

In terms of birth weight, out of the 390 NICU admissions, LBW (birth weight 2500 to 1500 gm) were 111, VLBW (birth weight 1500 to 1000 gm) was 50, while ELBW (birth weight <1000 gm) were 24. Out of the 303 requisitions 101 (33%) were received from LBW neonates, 94 (31%) form NBW, 68 (23%) ELBW and 40 (13%) from VLBW neonates. In our study, ELBW neonates were more transfusion-dependent (Chi-square 18.8, p-value 0.000), and the most frequent blood component transfused was PRBC.

The outcome was assessed only for 87 patients (Chi-square 12.7, p-value 0.005), and the extremely premature neonate mortality was higher. In terms of maturity, mortality was higher in late preterm neonates when the number of transfusions increased by more than 2 (p-value =0.004). As per the gestational age, out of 303 requisitions, 140 (46%) were from small for gestational age neonates (SGA) while 163 (54%) were from appropriate for gestational age neonates (AGA). PRBC and RDP transfusions requirement were more in SGA neonates compared with AGA with mean number of transfusions being 2.92 for preterm neonate and 3.45 for SGA. Out of 303 blood requisitions 127 were found to be appropriate while rest 176 were inappropriate. Most frequent inappropriate component requested was FFP 76.4% (26/34), followed by PRBC 63.6% (105/165), reconstituted whole blood 50% (6/12) and RDP 41.75% (38/91) (Figure 1) Chi square =17.8, p value 0.001. A single request was received for cryoprecipitate for deranged coagulopathy during study period but component was not issued. Most frequent reason for inappropriate blood order forms demanding FFP was missing indication for transfusion (n=23;88%) and information against dose directed transfusion (n=3;12%). Similarly for inappropriate blood order forms received for RDP, majority (n=24;63%) do not have pre transfusion platelet count (needed to calculate percentage recovery and corrected count increment), 21% (n=8) do not have Weight mentioned and for rest 16% (n=6) order forms patient had no indication for transfusion.

Most common indication for reconstituted whole blood was exchange transfusion for the management of hyperbilirubinemia. Exchange transfusion was done only when serum bilirubin exceeds its target limit based on maturity status of newborn and live days. Out of 12 blood order forms received, 50% required the transfusion support and in rest jaundice was subsided by use of phototherapy. Out of 105 inappropriate blood order forms received for PRBC transfusion 12% (n=13) have missing Hb, 19% (n=20) have missing Weight, 17% (n=18) demand for inappropriate volume and 6% (n=6) can’t justify the transfusion need because of missing other parameters like comorbidity and saturation status. Forty six percent (n=48) blood order forms were those which were not issued and where transfusion was not needed. Most common indication for PRBC transfusion was anemia (63/113: 56%), for RDP transfusion thrombocytopenia and for FFP transfusion deranged coagulopathy with bleeding tendencies. Other indication for PRBC transfusion were during surgery (21/113:19%), shock (12/113:11%), blood loss (11/113: 10%), pathological jaundice (6/113: 0.05%) in decreasing order.

Discussion

Blood transfusion has a pivotal role in modern medicine. Despite being a lifesaving drug, it has deleterious effects also. This becomes important in neonates who have small blood volume and immature organ system. Both restrictive and liberal transfusion are well described in literature. Because of the lack of National Clinical Transfusion guidelines and varied transfusion practices among clinicians, most transfusions are based on expert clinical opinion. We advocate that neonate transfusions should be critically analyzed in terms of maturity, gestational age, disease effect, blood volume, appropriateness and clinician’s transfusion practice which is neglected in majority of the times. Between June 2019 and December 2020, 390 neonates were hospitalized with 225 requiring transfusions and 303 blood order forms received. In our study, the incidence of transfusion was 58.4 % (225/384) with PRBC being the most frequently requested blood component (113/303; 37.29 percent). Several studies have found that the incidence of neonatal transfusion ranges from 20% to 90% [3,4]. The fact that some studies included only extremely low birth weight newborns while others included term neonates explains the wide variance in transfusion. The majority of preterm and extremely low birth weight neonates in the NICU are transfused based on laboratory criteria. It should be emphasized that while transfusions offer an instant benefit in tissue oxygenation, it also inhibits the neonate’s immature bone marrow, delay newborn neurodevelopment outcomes, and lengthen hospital stays [5-9]. In our study, we observed that ELBW neonates are an extensively transfused patient population, with PRBC being the most often requested component. Thus, it may be concluded that frequent transfusion to maintain a higher hemoglobin level in ELBW infants gives no further benefit [5-9]. As a result, a restricted transfusion approach may be adopted. In our study, we found that the mortality was more in extremely preterm newborns than the term neonates (p value 0.005). The association is significant when frequency of transfusion is more than 2 and mortality was higher in late preterm neonates (p value 0.004). Thus, RBC transfusions may have a negative impact on neonatal survival.

In our study, we found that SGA neonates required more transfusions than AGA neonates (mean of 3.45). Conti et al. found similar findings, with the majority of transfused newborns being between 24 and 29 weeks of gestation and weighing less than 1000g [10]. Iatrogenic anemia occurring due to repeated blood sampling in the NICU is a leading cause of anemia [11,12]. It is estimated that in NICU mean sample volume range between 0.8-3.1 ml/kg/day which corresponds to 30%-300% of neonates blood volume [11]. Phlebotomy loss alone in first 24 hours of NICU admission is around 3-10ml corresponding up to 25% of the blood volume [12]. For us establishing a temporal relationship between iatrogenic blood loss and requirement for PRBC transfusion is difficult because no documentation ever made regarding the number and amount of neonatal blood samples collected.

Necrotizing Enterocolitis (NEC), a complication of red cell transfusion, is one of the leading causes of newborn death. Marin et al. found that alterations in mesenteric oxygenation during PRBC transfusion might be linked to transfusion-related NEC. In our study we report NEC in 3 patients, one having single episode of transfusion and rest had 7 and 19 transfusion episodes. All the patients were preterm and mortality was found only in one patient received multiple transfusions and had long hospital stay. Though we haven’t found any relation of NEC with transfusion but several other studies have found that PRBC transfusions are an independent risk factor for NEC with VLBW neonates being more vulnerable as early as 48 hours after the transfusion [13]. As a result, it is necessary to explore pharmacological agents to reduce the need for transfusions. The use of erythroid stimulating agents, such as recombinant erythropoietin or longer acting darbepoetin, might potentially reduce the need for transfusions. Recently, the PENUT study shown that erythropoietin treatment can maintain a much higher Hb level, reduce the need for transfusions, and expose fewer donors [13]. Our findings are consistent with other research that show anemia is the most prevalent reason for PRBC transfusion. A review of the literature reveals that a greater blood transfusion/ unit volume ratio in newborns puts them at risk of metabolic derangement. This is due to immature liver’s decreased ability to metabolize anticoagulant and sense hypoxia, and the immature kidney’s inability to handle electrolytes, leads to hypocalcemia, hyperkalemia, acidosis, and hypomagnesaemia. With multiple or large transfusions, these potential hazards are compounded. Though it is uncommon with top-up transfusions, hyperkalemia can develop if the neonate receives more than 20 ml/kg of transfusion volume, has underlying hyperkalemia, or has renal disease.

Potassium levels in these patients should be regularly checked. Cardiac arrest has been observed after receiving a large blood volume transfusion due to hyperkalemia, particularly in neonates receiving exchange transfusion. Because of the stored blood and high body surface area, exchange transfusion can potentially cause hypothermia. Hypothermia can aggravate coagulopathy and result in a fatal triad [14]. We found no negative effects from transfusion in our study. This might be because patient blood management is tightly enforced at our center, and every transfusion is scrutinized. The amount of coagulation protein in the neonate varies with gestational age. Premature babies have prolonged prothrombin time and activated partial prothrombin time (PT/aPTT) due to underdeveloped hepatic function. Unless there are bleeding symptoms, FFP is not recommended to restore a prolonged international normalized ratio (INR). The development of disseminated intravascular coagulation (DIC) in the absence of current bleeding does not warrant the use of FFP. The use of FFP in liver disease is also debatable, because FFP may not always result in a complete correction of the coagulation abnormality [15]. In our study we analyzed that FFP was the most inappropriately requested component. This can be explained by the fact that parameters required for assessing the FFP transfusions were missing on the requisition form. Majority of the platelet transfusions in neonates were done prophylactically as neonatal guideline have higher platelet transfusion threshold as compared to adult. Improved outcome was seen with platelet transfusions for hemorrhage secondary to thrombocytopenia [15].

Conclusion

Evaluation of clinical transfusion practices is intended to bring a realization among clinicians’ expert in their field about the need to evaluate their own practices regularly. The two primary risk factors identified that lead to numerous blood transfusions are low birth weight and preterm. Transfusion has been linked to an increase in mortality, therefore studies towards reducing newborn transfusion needs, particularly PRBC, which is commonly prescribed for anaemia correction, is necessary. The most inappropriately requested component was fresh frozen plasma, and the indication was abnormal coagulation profile; however, there is no basis for using FFP for coagulation profile correction in neonates except bleeding.


For more Articles on: https://biomedres01.blogspot.com/

Friday, October 27, 2023

Study of the Hypothalamic Pituitary Adrenal Axis Stress Effect on Spiny Projection Neurons by Pathophysiological Computing Modelling of Basement Metabolism, An in Silico Study


Study of the Hypothalamic Pituitary Adrenal Axis Stress Effect on Spiny Projection Neurons by Pathophysiological Computing Modelling of Basement Metabolism, An in Silico Study

Introduction

Medium spiny neurons (MSNs) are a type of inhibitory neuron of the GABAergic type that plays a key role in initiating and controlling body movements so that today these neurons play an important role in the development of neurogenic diseases. Despite the importance of these neurons, there is no accurate information about the effect of stress on them. The subject of this research is a study on the effect of seven stresses include; hypoxia stresses, thermal stress, mTOR stress, oxidative stress, HPA axis stress, aging stress, and electrochemical stress on MSNs by modeling the pathophysiology of these neurons at the system biology level.

Materials and Method

This research can be divided into five stages (Figure 1). In the First step, prefabricated models related to MSN-related stresses, structures, and pathways were reviewed and extracted from biomodel, Vcell, and Reactome databases, and then screened, selected, and archived in SBML format. In the second stage, pathways were merged by COPASI software and a united model was created. In the third stage, the model was implemented on the Vcell platform and the results of the simulation were archived in SBML (level 3, version 1) format. At this stage, the variables were determined to simulate normal and stressed conditions, according to Table 1, and finally, after running the simulator based on solver stiff, the results were plotted by WPS office spreadsheet software and analyzed manually.

biomedres-openaccess-journal-bjstr

Figure 1: Simulation steps.

biomedres-openaccess-journal-bjstr

Table 1: Initial concentrations.

Results & Discussion

biomedres-openaccess-journal-bjstr

Figure 2: Results of model implementation under Vcell software.

According to Figure2(C), CYP RNA in stress increased. Cytochrome P450 3A4 (EC 1.14.13.97) is an important enzyme in humans, found mainly in the liver and intestines. This Cytochrome oxidizes small foreign organic molecules (xenobiotics) such as toxins or drugs so that they can be eliminated from the body. While many drugs are inactivated by CYP3A4, some drugs are activated by this enzyme. Some substances, such as grapefruit juice, and some medications interfere with the function of CYP3A4. Use of these drugs with drugs that are modified and enhanced or attenuated by CYP3A4. CYP3A4 is a member of the Cytochrome P450 family. Several other members of this family are also involved in mixed metabolism, but CYP3A4 is the most common [1]. According Figure 2(A,B,F,H,I,P) Dexamethasone metabolites in stress increased. Dexamethasone is a corticosteroid drug. It is used to treat many conditions, including rheumatic problems, some skin conditions, severe allergies, asthma, chronic obstructive pulmonary disease, croup, brain swelling, eye pain following eye surgery, and in combination with antibiotics for tuberculosis.

In adrenergic insufficiency, it should be used with a drug that has more mineral effects (including fludrocortisone). In preterm labor, it may be used to improve outcomes in the baby. It may be taken orally, by injection into a muscle, or intravenously. The effects of Dexamethasone often last for a day and last for about three days. Prolonged use of Dexamethasone may lead to thrush, osteoporosis, cataracts, bruising, and muscle weakness. It should not be consumed while breastfeeding. Dexamethasone has antiinflammatory and immunosuppressive effects [2].

According to Figure 2(G, M, N, O), cortisol metabolites in stress increased. Cortisol is a steroid hormone, a type of glucocorticoid hormone. When used as a medicine, it is known as hydrocortisone. In many animals, it is produced mainly by the adrenal cortex in the adrenal gland [3]. This substance is produced in smaller quantities in other tissues [4]. It is released during the circadian cycle and its release increases in response to stress and low blood glucose concentrations. It also reduces bone formation [5]. This gene encodes the alpha globulin protein with the corticosteroid-binding property. This protein is the major transporter for glucocorticoid hormones in the blood of most vertebrates [6]. PXR (Pregnane X receptor & Glucocorticoid receptor) is a nuclear receptor whose main function is to monitor the presence of foreign toxins and belongs to a family of nuclear receptors whose members are transcription factors that are transcribed by a domain into a ligand and by a Domains are attached to DNA. PXR is a transcription regulator of the Cytochrome P450 CYP3A4 gene.

It is activated by a combination of compounds including Dexamethasone and rifampicin and stimulates CYP3A4 [7,8] The glucocorticoid receptor (GR), also known as NR3C1, is a receptor to cortisol and other glucocorticoid GR is expressed in almost every cell in the body and regulates genes that control growth, metabolism, and the immune response, and because the receptor gene is expressed in different ways, it has different effects in different parts of the body. (Pleutropic) When glucocorticoid hormones bind to GR, the main mechanism of action is to regulate gene transcription [9,10]. After binding to the glucocorticoid, the activated glucocorticoid receptor complex expresses anti-inflammatory proteins in the nucleus. Regulates and suppresses the expression of inflammatory proteins in the cytosol (by preventing the transfer of other transcription factors from the cytosol to the nucleus [11,12]. Steroid Hormone Receptors (SHRs) are transcription factors that are activated in the presence of steroid hormones.

While estrogen receptors are predominantly nuclear, unbound Glucocorticoid (GR) and Androgen (AR) receptors are mostly located in the cytoplasm and are transported to the nucleus only after hormone binding. This Progesterone Receptor (PR ) in humans is encoded by a gene (PGR) on chromosome 11, which has two forms (PRA) and (PRB), that (PRA) is more in the cytoplasm and the form (PRB) in both the cytoplasm and There is in the core. Understanding the mechanism of ATPase activity of HSP90 is largely derived from structural and functional studies of Saccharomyces cerevisiae complexes. Binding of PTGES3 (p23) to the HSP90 complex and, finally, its combination stabilizes the hormone. It is worth noting that GR-importin interactions can be ligand-dependent or independent. In nuclear ligand-activated SHR, specific sequences in DNA called Hormone Responsive Elements (HRE) are created [13]. Albumin is a family of globulin, the most common of which is serum albumin.

All proteins in the albumin family are soluble in water and relatively soluble in concentrated saline. Albumin is usually found in the blood plasma and is not glycosylated. Albumin-containing substances are called albuminoids. Some transfusion proteins are evolutionary linked to the albumin family (including serum albumin, alpha-photo protein, and vitamin D-binding proteins. This family is found only in vertebrates [14-16].

Tyrosine aminotransferase (or tyrosine transaminase) is an enzyme present in the liver that catalyzes the conversion of tyrosine to 4-hydroxyphenylpyruvate [17]. Deficiency of this enzyme in humans can lead to what is known as type II tyrosinemia, in which there is an accumulation of tyrosine (resulting in accumulation of tyrosine due to a lack of aminotransferase reaction) [18].

Conclusion

According to their results and analysis, in general, it can be said that stress caused by the Hypothalamic-pituitary-adrenal axis increases Dexamethasone and cortisol metabolites and increases cellular metabolism and catabolism over anabolism, and therefore can It has a destructive effect on MSNs and other similar cells and thus aggravates the symptoms of MSN-related diseases. It is suggested that researchers investigate various aspects of the destruction of these neurons by researching this subject, and therefore future research could be a follow-up to this research. In this study, we examined only part of the basal metabolism on MSNs, so it is recommended

a) Examine other metabolic pathways not only on MSNs but also on other neurons.

b) Use other bioinformatics software to simulate stress on MSNs and other neurons.

c) Simulation of the effects of different drugs on cell metabolism using relevant software

d) Design of different drugs based on the feedback we receive from the simulator.

Investigation of bio transformation using Biomodel and Vcell.


For more Articles on: https://biomedres01.blogspot.com/

Thursday, October 26, 2023

ABO Blood Group Profile Frequencies and Relationship in COVID-19 Disease Susceptibility and Severity in Lagos, Nigeria


ABO Blood Group Profile Frequencies and Relationship in COVID-19 Disease Susceptibility and Severity in Lagos, Nigeria

Introduction

COVID-19 caused by the Severe Acute Respiratory Syndrome Coronavirus-2 [SARS-CoV-2] was first described as a serious infection leading to significant morbidity and mortality in Wuhan, China in January 2020 Zhou, et al. [1]. The number of deaths was increasing due to the catastrophic effect of the emerging new strains. Research has shown that there are predicting factors of COVID-19 severity such as demographic, clinical, immunologic, haematological, biochemical, and radiographic factors Benjamin, et al. [2]. According to Samra, et al. [3] ABO groups can play a role in COVID-19 severity and susceptibility. The rapid global spread of the novel coronavirus SARS-CoV-2 has strained existing healthcare and testing resources, and it is causing COVID-19 severe cases in some people than in others. While some people experience only mild symptoms, others are being hospitalized Samra, et al. [3]. The pathogenesis of severe COVID-19 and the associated respiratory failure are still unclear, but the higher mortality rate is consistently associated with older age and being male Samra, et al. [3]. Many studies have shown that the ABO blood type is a potential risk for various diseases such as cancer, myocardial infarction, acute kidney injury, and venous thromboembolism Dentali, et al. [4,5]
Apart from comorbidities and other predicting factors, findings have shown that the ABO blood group has a correlation with COVID-19 susceptibility and severity. Biological factors that determine susceptibility to SARS-CoV-2 and severity of COVID-19 are yet to be fully understood Samra, et al. [3]. The ABO blood grouping may influence the susceptibility of COVID-19 and severity of the disease Zhao, et al. [6]. As reported by Nagla, et al [7], patients from three hospitals in Wuhan, Shenzhen, and China showed the likelihood of association between ABO blood groups and the susceptibility to COVID-19 exposure after the outbreak of the COVID-19 infection. The study results showed that individuals with blood group A had a markedly greater risk of COVID-19 exposure, while those with blood group O had a significantly reduced risk of COVID-19 infection. In a meta-analysis of two different case-control cohorts, blood group A was reported to confer a greater risk of aggravated COVID-19, while blood group O offer protection against COVID-19 infection WU, et al. [8].
However, A, B and O blood group are antigenic complex oligosaccharide molecules located on the extracellular surface of the red blood cell membrane Storry JR, et al. [9]. ABO blood group are also expressed on the surface of other human cells and tissues, including the epithelium, sensory neurons, platelets, and the vascular endothelium Eastlund [10]. The ABO blood group have been reported to play a key role in various human diseases such as diabetes, cardiovascular, neoplastic, carcinoma and other infectious disorders Cheng et al. [11-13]. ABO and Rh blood groups polymorphism are valuable and indispensable tools in contemporary medicine, population genetics and anthropology. The distribution of these two blood groups has been reported different populations of the world and they showed considerable variation in different geographic locations, reflecting the underlying genetic and ethnic diversity of human populations Garratty ,et al. [14,15] reported the distribution and gene frequencies of ABO and Rh [D] blood group systems in six geopolitical zones of Nigeria. Their data revealed that the ABO blood group frequencies were found in the order O [52.93%] A [22.77%] B [20.64%] and AB [3.66%] respectively among Nigeria population. This was in agreement with other studies from other parts of the world from different race and ethnic groups in USA having [O; 46.6%, A; 37.1%, B; 12.2% and AB; 4.1%] Garratty, et al [14]. Another report from a study done in Mauritania, Morocco, Cameroun, Tunisia, Ethiopia and Iran is also consistent with the Nigerian study showing [O > A > B > AB] Hamed, et al. [16-21]. The report from Madagascar and Guinea showed slightly different result [O > B > A > AB]. However, Nigerian ABO blood group results are slightly different from the study in Madagascar and Guinea that reported this trend [O > B > A > AB] Randriamanantany, et al. [22,23]. Reports from studies in India and Bangladesh showed blood group B having highest prevalence followed by O and the least was AB [B > O > A > AB] Dewan, et al. [24,25]. In Nigeria, there is a limited information of association between ABO blood groups and the susceptibility to COVID-19 in Nigeria. This study therefore, evaluated the role of ABO blood group in SARS-CoV- 2 infection susceptibility and disease severity in Lagos, Nigeria.

Methods

Study Design and Participants

This study is a case series that includes patients that are evaluated between June and August 30, 2020, and diagnosed with COVID-19.With ethical approval obtained from the Institutional Review Board [IRB] at the Nigerian Institute of Medical Research [NIMR], Yaba, Lagos, Nigeria, patient data were obtained and reviewed at the Mainland Infectious Disease Hospital and the Nigerian Institute of Medical Research, Yaba. Informed consent was also obtained from the study participants before their health records were obtained. They were confirmed to have been infected with SARS-CoV-2 by a positive reverse transcriptase polymerase chain reaction test [Qpcr] of nasopharyngeal, throat and blood samples. Clinical outcomes were also monitored and recorded.
Data Collection and Statistical Analysis: Clinicians and trained research assistants retrospectively reviewed and copied patients’ health records out to a standardized data collection form. Health records copied out include demographic information, signs and symptoms presented with, co-morbidities, and patient outcome. A formal sample size was not calculated for this study because the objective of the study was to describe the clinical characteristics of the patients and their Blood group profile of participants who had enough information in their health records for analysis. Records were double entered into the forms before merging to reduce errors during data entry. Descriptive analyses were performed using Statistical Package for the Social Science [SPSS] version 25 [IBM, USA].

Results

A total of 697 COVID-19 patients were included in this study. The mean age [S.D] of the study participants is 41.32 [12.917]. COVID-19 was common in males [66.1%] than in females [33.9%]. Out of the 697 participants, 43.6% were asymptomatic while 56.4% were symptomatic showing symptoms like breathing difficulty, fever, dry cough, running nose, sore throat and others as shown on Tables 1 & 2. The most frequently detected blood group in the population was O accounting for [59.2%], followed by A 155[22.2%], B 105[15.10%] and the least is AB 24[3.4%]. Figure 1 showed the blood groups that accounted for COVID-19 severity: blood group B 11 [10.5%] followed by A 14 [9.0%], O 35 [8.5%] and AB 1 [4.2%]. There was no significant statistical difference between the blood groups in relation to COVID-19 severity [p=0.358].

biomedres-openaccess-journal-bjstr

Table 1: Baseline Characteristics and Symptoms of COVID-19 among the Patients.

biomedres-openaccess-journal-bjstr

Figure 1: Profile of Blood Groups and Percentage of SARS-CoV-2 Disease Conditions.

biomedres-openaccess-journal-bjstr

Table 2: Symptomatic patients (56.4%). The most common symptoms were: dry cough (27.5%), Fever 185 (26.5) and breathing difficulty (18.5%).

Tables 3 & 4 showed five [5] persons having blood group O were among the deceased [55.6%]. Four out of the 5 deceased had severe COVID-19 and were males. Their age, ranged from 53 to 65 years. The youngest being 53years was a woman who had a mild symptom of COVID-19. Three [3] women having blood group A were among the deceased [33.3%]. Aged ranged 66-75 years. Two out of these three women had mild cases and one severe COVID-19 case. This is a proof to show that old age and co morbidities are risk factors to COVID-19 disease complications and death. Five [5/ 55.6%] persons having blood group O were among the deceased four out of the 5 deceased had severe COVID-19 and were males and aged 53 to 65 years. The youngest being 53 years was a woman who had a mild symptom of COVID-19. Three [3/ 33.3%] women having blood group A were among the deceased. Their age ranged from 66 to 75.

biomedres-openaccess-journal-bjstr

Table 3: Co-Morbidities in covid-19 patients at presentation, N = 697.

biomedres-openaccess-journal-bjstr

Table 4: Blood Group Disease Condition Cross Tabulation and Percentages.

Discussion

A person’s blood group [A, B, AB and O] is determined by the presence or absence of specific antigens on red blood cells which trigger an immune response. Reports from some recent studies, suggests that ABO blood group may play a role in the immunopathogenesis of COVID-19 disease with group A conferring a higher susceptibility to infection and or severe disease and group O individuals less likely to test positive (Geol, et al. [26]) and Fan, et al. [27]. However, reports are in contrast to our current study which shows no statistical ssignificant evidence [p = 0.358] that individuals with the blood group profile A were associated with increased risk to severe cases of COVID-19. Furthermore, in moderate cases of Covid-19 infection, group B [41.9%] individuals were more represented and may have increased risk to COVID -19 susceptibility when compared to other blood groups. We also observed that most of the deceased persons [5/ 55.6%] had blood group O, were males and age 53 to 65 years. Three [3/ 33.3%] women having blood group A were equally among the deceased aged 66 to 75 years with co-morbidities which include Pneumonia, Diabetes, LRTI , Hypertension in both severe and mild cases confirming that both age and comorbidities can lead to death with COVID-19 disease.
A recent study that supported our data reported that a significantly increased risk was associated with blood group B Almadhi, et al. [28], which is also comparable to findings by Latz, et al. [29] and meta-analysis by Liu, et al. [30]. In Nigeria and other parts of the globe, blood group O Rhesus positive has consistently been the most common, followed by A, then B, and AB being the least [Anifoweshe et al 2016]. According to [Geol et al 2021], group O originated in Africa before early human migration, and has anti‐A and/or anti‐B antibodies present in group O individuals which binds to the corresponding antigens on the viral envelope and contribute to viral neutralization, thereby conferring some protection by preventing target cell infection. However, our data proposed that group B and or O individuals may be more likely to be infected with COVID-19 disease suggesting that COVID -19 in Nigeria and few other studies from other parts of the world may not be affected by the anti A or B that has been proposed to confer protection to these that have it. Furthermore, ABO blood group is determined by inheritance, natural selection, showing underlying genetic and ethnic diversity which may have influenced the current frequencies of ABO types among Nigerian populations based on susceptibility to particular diseases or disorders. Hospitalization, higher infection chances, and death were found among those with blood group A and O, and ethnicity was also a factor considered to weigh COVID-19 risks in this study.

Conclusion

The ABO blood group was not associated with the presentation and recovery period of COVID-19 disease during the period of this study. However, the patients of blood group B profile seem to have higher risk of COVID-19 disease susceptibility. To further detect the susceptibility and severity of COVID-19 infection, more samples of individuals with confirmed exposure to COVID-19 infection should be conducted.


For more Articles on: https://biomedres01.blogspot.com/

The Skin Aging Process and Anti-Aging Strategies

  The Skin Aging Process and Anti-Aging Strategies Introduction Appearances play a vital role in society as it is how one communicates to ot...