Saturday, April 29, 2023

Endo-Parasitic Infestation in Captive and Free-Living Rhesus Macaques (Macaca mulatta) in Bangladesh


Endo-Parasitic Infestation in Captive and Free-Living Rhesus Macaques (Macaca mulatta) in Bangladesh

Introduction

Primates are noticed to be one of the severely threatened animals in the world, with approximately 50% of species currently at risk of extinction (IUCN [43]). More than 70% of primates are classified on the IUCN Red List as critically endangered, which in the near future they could disappear forever from Asia (IUNC [44]). Therefore, there is a growing recognition that it is very significant to better understand infectious disease dynamics in wild primate populations (Chapman, et al. [1,2]). Parasites play a significant role in the ecosystems, influencing the ecology and evolution of species interactions, host population growth and regulation (Hudson, et al. [3,4]) and even community biodiversity (Hudson [5]). Parasites and infectious diseases can trigger or accelerate population declines and have become a big alarm in conservation biology (Altizer, et al. [6]). Primates are susceptible to various protozoa and helminth parasites (Wanert, et al. [7]). Thus, parasites are an integral part of the natural history of mammals and are always of interest.

Natural infections of gastrointestinal protozoa and helminths have been exhibited in a variety of species of monkeys. Gastrointestinal parasitism in the colonies of non-human primates (NHPs) is often addressed as a research topic (Sano, et al. [8-10]). Strongyloides sp., Oesophagostomum sp., and Trichuris trichiura were previously considered among the most common pathogens causing poor development, anemia, and diarrhoea in macaques and other NHPs (Honjo, et al. [11-13]). Recently, captive NHPs were resulted pathogenic for their hosts and found that they can be frequently affected by several species of intestinal protozoans (Lee, et al. [14- 17]). Several studies have demonstrated that non-human primates may be carriers of human gastrointestinal parasites. Moreover, most parasites noted in NHPs represent a high zoonotic risk for researchers and caretakers in breeding centers (Loomis [18]).

Thus, people living in close proximity of such animals or individuals involved in game parks, animal orphanages or research stations may be at risk of acquiring pathogens from infected animals. Moreover, non-human primates are often valuable in studies of either human diseases processes or vaccine and drug development. It is therefore important that animals used in such studies should not harbour parasites since results obtained using parasitized animals may not reveal the true picture. Additionally, these animals play an important role in natural ecosystems; hence heavy parasite loads may have a negative impact on their population sizes. The rhesus macaque is well known to science due to its relatively easy upkeep in captivity, wide availability and closeness to humans anatomically and physiologically. It has been used extensively in medical and biological research on human and animal health-related topics. However, no previous works on endoparasitic infections of rhesus monkeys in Bangladesh were found in the literature. This article, therefore, highlights the exploratory and descriptive study on the different types of gastrointestinal parasites that affect populations of both wild and captive monkeys.

Materials and Methods

Sample Collection and Preparation

A total of 190 fecal samples were collected randomly from two study areas, the Shadhana Awshadhalaya factory area, Gandaria, Dhaka and the National Zoo of Bangladesh, Mirpur, Dhaka between March 2014 to February 2016. The monthly sampling covered the seasons of summer (March to June), fall (July to October) and winter (November to February). The samples of free-living monkeys were collected from Gandaria region and captive monkeys from Zoo with the permission of the authority. Only fresh, non-dry samples were collected and, whenever possible, when defecation was observed. As far as possible faecal samples were usually collected in the morning and then brought to the Parasitology laboratory of the Department of Zoology, University of Dhaka for microscopic examination.

Formalin-Ethyl Acetate Sedimentation Technique: Preserved faecal samples were processed using the formalin-ethyl acetate sedimentation technique (Cheesbrough [19]). Samples were collected into sealable, plastic bags immediately after defecation is observed. Within 8 h of collection, the collective sum of 2 g taken from each sample was transferred to 2-ml plastic tubes containing 0.75 ml 10% buffered formalin solution. Fixed faecal samples of Rhesus macaques were later transported to the Parasitological laboratory of the Department of Zoology, University of Dhaka, Bangladesh. All faecal samples were examined via a modified formalin–ether sedimentation protocol, substituting ethyl acetate for ether, as the former is less volatile (Hernandez, et al. [20]). Approximately 1 g of formalized faeces was diluted in 5 ml formalin, and centrifuged at 1,500 rpm for 3 min. The supernatant was then discarded, and the concentrated pellet was weighed (Muller-Graf, et al. [21]). To identify and quantify parasitic infection, an aliquot was removed from the homogenous suspension, placed in the chamber of a McMaster slide, and examined at 100x magnifications. It was counted all helminthes eggs and larvae were observed within the chamber’s 0.15-ml grid to calculate the number of eggs per gram of feces (EPG) from each sample.

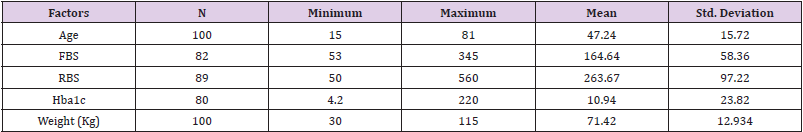
Epidemiological Parameters: For each parasite, the prevalence and mean intensity were recorded. Prevalence was counted as the number of infected macaques per sampled subset of the population (Margolis, et al. [22-25]). Mean intensity was defined as the average number of infective stages (Table 1), among the infected members of each population.

Taxonomic Identification of the Parasites: Eggs of various gastrointestinal parasites were identified and the references and published articles such as Yamaguti [46-49], Cheng, et al. [26,27], other references, etc. were consulted. Representatives of each parasite were photographed by a digital camera.

biomedres-openaccess-journal-bjstr

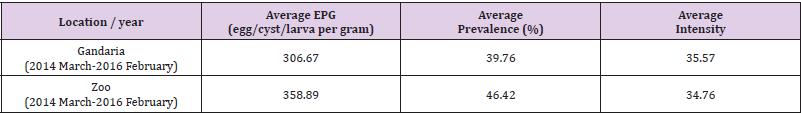
Table 1: Average prevalence, intensity and EPG (egg/cyst/larva per gram) of parasites by location from March 2014 to February 2016.

Statistical Analysis: All statistical tests were carried out using SPSS (Version 22) and R software (Version 3.1.3). A nonparametric repeated-measures analysis of variance (ANOVA) was conducted. The variance ratio with the p-value was used to compare the dispersion of parasites between the Gandaria and Zoo samples. For each case, it was considered the parametric (Welch) and nonparametric (Wilcoxon) tests to study if the two population means for each of the parasites was the same for the two study areas. It was also found the 95% confidence interval of the differences between the two population means for each of the parasites.

Results

This paper aims to determine the parasite community of the host rhesus monkeys (Macaca mulatta), to estimate the prevalence and intensity of rhesus macaques in two study areas, the National Zoo (captive) and Shadhana Awshadhalaya factory area (freeranging) Dhaka, and to study the seasonal prevalence of helminth and protozoan parasitic infestation. Eggs, cysts and larva of parasites were identified based on their taxonomy, morphology and characteristics. Parasites belonging to 30 species were identified, 6 species of protozoa (Entamoeba coli, Eimeria sp., Isospora sp., Toxoplasma gondii, Chilomastix mesnili and Gregarina sp.), 5 species of cestodes (Taenia sp., Moniezia sp., Reillietina sp., Bertiella sp. and Amoebataenia sp.), 11 species of nematodes (Ascaris lumbricoides, Toxocara sp., Trichuris trichiura, Strongyloides sp., Ancylostoma sp., Ascarops sp., Gongylonema sp., Gnathostoma sp., Subulura sp., Enterobius sp. and Capillaria sp.), 7 species of trematodes (Neoglyphe sp., Watsonius watsoni, Schistosoma mansoni, Paragonimus sp., Clonorchis sinensis, Brachylaemus sp. and Gastrothylax sp.). The pentastomida (Linguatula sp.), was the first record in Bangladesh on the species of gastrointestinal parasites affecting monkeys in both captivity and the wild. This article compares the prevalence and intensity of parasites from two study areas which covered two study periods- the first study period (2014-2015) and the last study period (2015-2016).

Overall Estimate of Parasites Prevalence, Intensity and EPG (Egg/Cyst/Larva Per Gram): In the present study, from March 2014 to February 2016, the average prevalence and EPG of parasites were higher in Zoo than that in Gandaria. The average prevalence and EPG of parasites in Zoo were 46.42% and 358.89 respectively. The overall estimates of EPG prevalence and intensity of parasites for free-ranging and captive areas were averaged over the two study periods in both cases. It was observed that on average the number of eggs per gram of Gandaria samples was 306.67 and for that of Zoo, samples were 3888.89. While the average intensity of parasites was estimated to be around 35% in both the areas, the overall prevalence of parasites in Zoo (46.42%) was significantly higher (P-value <0.1) than Gandaria (39.76%) (Table 1).

Estimated Prevalence, Mean Intensity and EPG (Egg/Cyst/ Larva Per Gram) of Parasite Groups by Location and Study Year: In the present study, it is evident that nematoda was the most dominant parasite. In both, the study areas, the prevalence of nematoda among others was the maximum during 2014-2015 and 2015-2016. In 2014-2015 samples showed the prevalence of nematoda was 77.78% in Gandaria and 80% in Zoo. In 2015-2016, the prevalence of nematoda in Gandaria and Zoo were 72% and 74% respectively. Unlike a very low prevalence (around 2%) of pentastomida was observed in Zoo (2014-2015). The study did not find any parasites of pentastomida in Gandaria. (Table 1, Figure 1). The study further observed the mean intensity of parasite groups among the two study periods and study areas. the estimated mean intensity of protozoa was maximum (76.06) in Zoo (2015-16). On the other hand, the mean intensity of pentastomida was absent in Zoo for both study years.

biomedres-openaccess-journal-bjstr

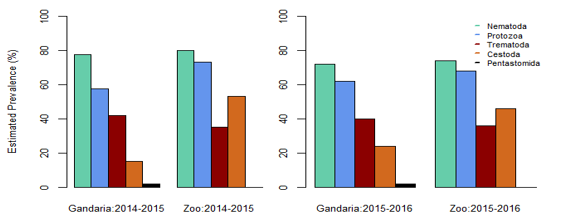
Figure 1: Estimated prevalence of parasite groups by location and study year.

In Gandaria, the mean intensity of nematoda was 65.41 in 2014-2015 and that was 66.17 in Zoo at that time. In 2015-2016, the intensity of nematoda in both Gandaria and Zoo were 66.76 and 67.51 respectively. However, the mean intensity of trematoda and cestode (35.85) was found in Gandaria, Dhaka (2015-16) samples. (Table 1, Figure 2). The estimated EPG was the highest for nematoda in both study areas and both study periods. In 2014-2015, the EPG of Gandaria and Zoo were 879.17 and 791.67 respectively. Moreover, in 2015-2016 those were 970.83 and 937.50 accordingly. On the contrary, in 2014-15, the estimated EPG of trematoda was higher in Gandaria than that of Zoo and the opposite situation was seen in 2015-16. In the first study year, the EPG of cestoda in Gandaria was 50 and that was 138.89 in Zoo. On the other hand, in 2015-2016 those were 95.83 and 250 in Gandaria and Zoo respectively (Figure 3).

Box plots for the prevalence of parasites in the Gandaria samples (2 years data).

biomedres-openaccess-journal-bjstr

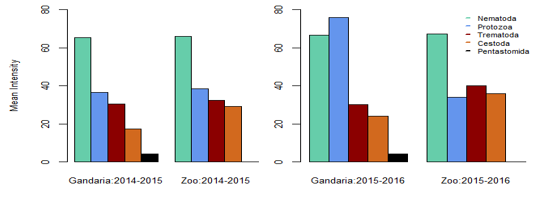
Figure 2: Mean intensity of parasite groups by location and study year.

Using the combined data of Gandaria the Box plot for each of the parasites demonstrate that the prevalence of Entamoeba sp. was centered higher than all other parasites in the protozoa group. Both the Entamoeba sp. and Toxoplasma sp. showed higher spread and positive infections.The prevalence of Ascaris sp. was centered higher than other nematode parasites. Most of the parasites in this group were highly spread out. Four parasites in protozoa and five in nematoda group had very negligible prevalence (Figure 4a). The prevalence of most of the parasites of trematoda, cestoda and pentastomida were centered near zero. All most all the parasites occurred with less than 50% of prevalence in Gandaria. Only the Taenia sp. among the cestoda group had few non zero observations (Figure 4b).

biomedres-openaccess-journal-bjstr

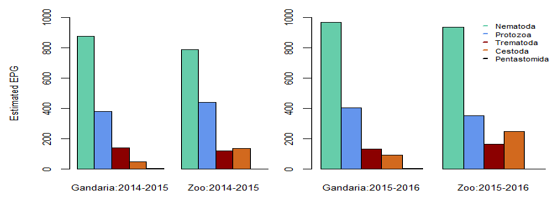
Figure 3: Estimated EPG of parasite groups by location and study year.
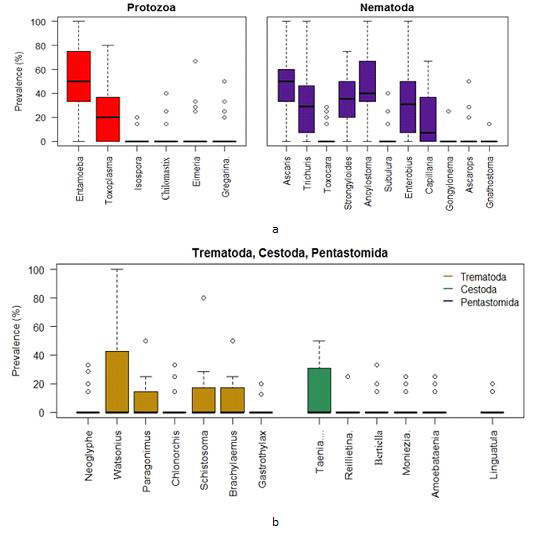
biomedres-openaccess-journal-bjstr

Figure 4:

a. Box plots for the prevalence of parasites (protozoa & nematoda) in the Ganderia samples (2 years data).

b. Box plots for the prevalence of parasites (trematoda, cestoda & pentastomida) in the Gandaria samples (2 years data).

Using the combined Zoo data, the Box plots indicate that the prevalence of Entamoeba sp. was centered the highest followed by Toxoplasma sp. among the protozoa group. The Entamoeba sp. prevalence was negatively skewed while that of Toxoplasma sp. was positively skewed. The spread of Toxoplasma sp. prevalence was higher than other protozoan parasites. On the other hand, the prevalence of Ancylostoma sp. was centered the highest among the nematoda parasites. Most of the parasites in this group were highly spread out in terms of prevalence (Figure 5a).
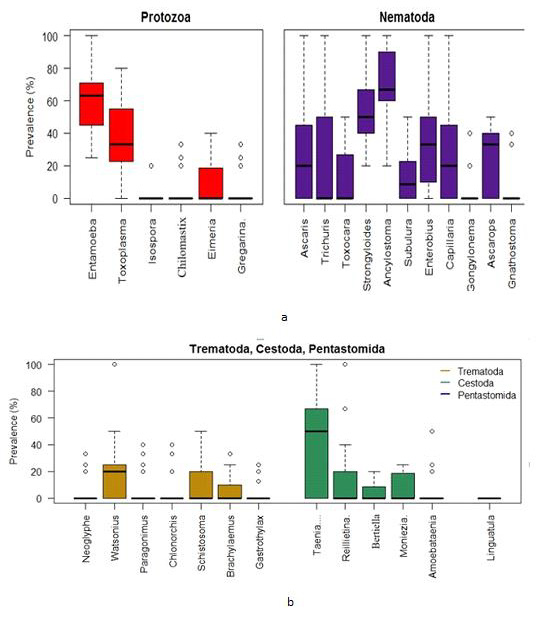
biomedres-openaccess-journal-bjstr

Figure 5:

a. Box plots for the prevalence of parasites (protozoa & nematoda) in the Zoo samples (2 years data).

b. Box plots for the prevalence of parasites (trematoda, cestoda & pentastomida) in the Zoo samples (2 years data).

Discussion

The present analyses reveal significant richness and diversity of gastrointestinal parasites in the rhesus monkeys in Gandaria and Zoo. Parasites belonging to 30 species were identified, 6 species of protozoa (Entamoiba coli, Eimeria sp., Isospora sp., Toxoplasma gondii, Chilomastix mesnili and Gregarina sp.), 5 species of cestodes (Taenia sp., Moniezia sp., Reillietina sp., Bertiella sp. and Amoebataenia sp.), 11 species of nematodes (Ascaris lumbricoides, Toxocara sp., Trichuris trichiura, Strongyloides sp., Ancylostoma sp., Ascarops sp., Gongylonema sp., Gnathostoma sp., Subulura sp., Enterobius sp. and Capillaria sp.), 7 species of trematodes (Neoglyphe sp., Watsonius watsoni, Schistosoma mansoni, Paragonimus sp., Clonorchis sinensis, Brachylaemus sp. and Gastrothylax sp.) and 1 species of pentastomida (Linguatula sp.). This was the first record in Bangladesh on the species of gastrointestinal parasites affecting monkeys in both captivity and wild; and also their prevalence.

By comparison, 21 gastrointestinal parasites were identified in Kenya’s Tana River mangabey (Mbora, et al. [28]) and 14 parasite species were identified in monkeys of Uganda’s Kibale Forest (Gillespie, et al. [29]). Thirteen parasite species were found in Mahale National Park of Tanzania (Kooriyama, et al. [30]). Total 14 species were found in Rubondo Island National Park of Tanzania (Petrzelkova, et al. [45]) and a total of 23 gastrointestinal parasites were recorded in the Taï monkeys, African nonhuman primates (Kouassi, et al. [32]); recorded 23 gastrointestinal parasites with relatively high prevalence. However, no cestode species were recovered. According to the present work a total of 30 parasites with 5 species of cestodes were recorded. Jha, et al. [33] a prevalence survey of gastrointestinal parasites of Rhesus Monkeys was conducted in three temples Pashupatinath, Swyombhunath and Tripureshwor of Kathmandu. Total 121 fresh faecal samples, were collected randomly from these areas, and three species of protozoa and ten species of helminths were detected by microscopical examination of faecal samples.

A total of 30 gastrointestinal parasites were recorded in the present observation which represents the greatest parasite richness documented to date for Rhesus monkeys. Therefore, the diversity indices demonstrate considerable species diversity and equitable distribution of gastrointestinal parasites in monkeys. Faecal samples of monkeys (captive and free-living) were collected from the Shadhana Awshadhalaya factory area, Gandaria and the National Zoo of Bangladesh, Mirpur. Primates living in complex habitats are infected by a greater intensity and diversity of parasites (Poulin, et al. [34]; Nunn,et al. [35]; Nunn and Altizer [36]). Poor quality habitat and disturbed habitats are much more likely to harbor a greater intensity and diversity of parasites relative to host populations in optimum habitats (Poulin, et al. [34]; Nunn, et al. [35]; Nunn and Altizer [36]). In parasites with multi-stage life cycles, or with infective stages transmitted through the environment, the habitat of the host-parasite interaction plays a more direct role in the transmission of that parasite (Altizer [36]; Combes, et al. [38] and Grutter [39]).

Thus, the environmental conditions and management practices in the study areas (captive and free-living), such as food, cleanliness, overcrowding and deworming among others may influence the prevalence of parasitic infections and are responsible for the parasite richness in rhesus monkeys. In the present study, nematoda was the most dominant parasite in both study areas (captive and free-ranging). In contrast, the majority of the enteric parasites of captive non-human primates are protozoans, (Lane, et al. [40]; Ye,et al. [41]; da Silva Barbosa, et al. [10]). In this study, the average prevalence and EPG of parasites were higher in Zoo (captive) monkeys than that in Gandaria (free-living) monkeys. According to Kouassi, et al. [32], captive non-human primates are frequently infected with parasites having a direct life cycle and show a lower number of parasitic species in comparison with wild NHPs. Therefore, the environmental conditions of zoo and the life cycle pattern of parasites might be the reason for the higher prevalence of parasitic infections in Zoo than in Ganderia. According to Altizer, et al. [42], seasonality affects free-living stages of parasites through changes in temperature, humidity and rainfall, and host susceptibility and exposure through variations in physiology and behavior. Thus, environmental factors such as temperature, humidity and rainfall may influence the seasonal variation of parasites in Macaca mulatta.

Conclusion

This is the first report on endo-parasitic infection of the rhesus monkey in captive and free-ranging populations. The prevalence, EPG and intensity of helminth and protozoan parasites of the gastrointestinal tract in populations of free-ranging and captive monkeys were noted which provides baseline data on the gastrointestinal parasites in both study areas. The average prevalence of parasites was higher in captive monkeys than that in free-ranging monkeys. Seasonal fluctuation of parasitic infection was found from the captive and free-ranging monkeys which suggests environmental factors may affect the seasonal variation of parasites in monkeys. Rhesus macaques (Macaca mulatta) constitute an integral part of biodiversity and a cognizable link between humans and nature. Therefore, the findings of this study will serve as a guide to establish the necessary preventive measures to favor the conservation of this species.


For more Articles on: https://biomedres01.blogspot.com/

Friday, April 28, 2023

Frequency of Blood Glucose Monitoring in Relation to Glycemic Control in Patients with Type-2 Diabetes


Frequency of Blood Glucose Monitoring in Relation to Glycemic Control in Patients with Type-2 Diabetes

Introduction

Diabetes is among the principal sources of morbidity and mortality around the World. Diabetes prevalence has been increased from 108 million cases in 1980 to 422 million cases of diabetes in 2014, and this trend of increasing burden has been speculated to raise from 425 to 629 million diabetic people from 2017 to 2045 [1]. Diabetes is among the major health problems facing the human population around the world today. It also poses economic problem because it is estimated that 10% of National Health Service (NHS) expenditure is spent on diabetes which is equal to £1 million per hour. Presently, 2.3 million people have been reported with diabetes and above 500,000 people with type-2 diabetes are not aware of their diabetic status. It is expected that more than 4 million people will have diabetic till 2025 and probably a large number those will have type-2 diabetes, leading to an increase in aged, overweight and obese individuals. It is alarming that growing unhealthy lifestyle has been a key reason of type-2 diabetes, once observed only in the over-40s, being diagnosed in a increasing number of younger people and even children [2]. Diabetes is manifested when blood glucose concentration reaches the higher level than normal blood sugar level. Blood sugar is a main source of energy found in foods which we eat. Insulin is hormone which is made by the pancreas which facilitates glucose from food get into cells for its use as energy. At times body doesn’t make sufficient or any insulin or doesn’t use insulin properly, then glucose remains unused in blood and doesn’t enter cells.

Three types of diabetes are commonly found as type-1, type-2 and gestational diabetes. In type-1 diabetes the body doesn’t make insulin and the patient immune system attacks and damages those cells in pancreas which are responsible for making insulin. Type-1 diabetes is typically detected in children and young adults, though it can appear in every age. Individuals in type-1 diabetes need to take insulin every day for his/her survival. In type-2 diabetes, which is most common type of diabetes the body doesn’t produce or use insulin properly. Type-2 diabetes can start at any age, even during childhood. However, this type of diabetes takes place mostly in middle-aged and older people. Gestational diabetes is caused in certain women when they are pregnant. Most of the times, this form of diabetes goes away after the birth of baby. There are some other less common types of diabetes including monogenic diabetes, which is an inherited form of diabetes, and type of diabetes associated with cystic fibrosis [3]. Type-2 diabetes has a number of causes but most important are known as genetics and lifestyle, but the combination of both factors can create insulin resistance, when body doesn’t use insulin as it should. Insulin resistance mostly causes type-2 diabetes. Genes do play important role in type-2 diabetes, but lifestyle also play important role. Lifestyle choices that affect the development of type-2 diabetes includes lack of exercise, unhealthy meal planning choices, overweight or obesity [4]. Some risk factors of diabetes include being overweight or obese, hypertension (high blood pressure), and low level of “good” cholesterol (HDL), elevated level of triglycerides in blood, sedentary lifestyle and family history of diabetes. Symptoms of diabetes include increase urination, excessive thirst, weight loss or gain, hunger, fatigue, skin problem, blurred vision, nausea, vomiting etc. Diabetes can cause microvascular (damaged to small vessels) and macrovascular (damaged to large vessels) diseases [5].

Self-monitoring of blood glucose (SMBG) refers to check blood glucose of diabetic patient at home. SMBG is an important modern therapy of diabetic patients. It is used to attain a specific level of glycemic control and to avoid hypoglycemia. The aim of SMBG is to gather detailed information about blood glucose concentration at various times. SMBG can be used to help in the fixing of a therapeutic regimen in response to blood glucose values and to assist individuals in adjusting their dietary intake, physical activity, and insulin dosages to improve glycemic control on a daily basis [6]. SMBG can be measured by strips or by glucometer before meal (fasting blood sugar, FBS) or anytime (random plasma sugar, RBS). Hba1c refers to glycated hemoglobin is actually the protein in the RBCs carrying oxygen all over the body joins with glucose and become glycated. Through measuring hba1c we are able to get the whole status of average blood glucose level over a period of weeks/ months. The normal Hba1c is below 42mmol/mol or below 6.0%. Prediabetics have 42-47mmol/mol or 6.0%-6.4% and diabetic have 48mmol/mol or over and/or 6.5% or over. There is a difference between hba1c and blood glucose level. In hba1c we know about the how high sugar level has been over a period of time, it provides a longer-term trend. While blood glucose, is the concentration of glucose in blood at a single point in time. It is measured as FBS and RBS [7]. Study reported that that SMBG concentration is linked with improved glycaemic control in patients and rise in rate of SMBG with growing HbA1c value was proportional to the higher ratio of insulin- treated patients in higher HbA1c categories [8,9]. Also, the better quality of metabolic control demonstrating self-monitoring of blood glucose improved glycemic control in the majority of non– insulin-treated and also insulin treated type-2 diabetic patients [10-12]. Studies have reported that substantial numbers of diabetic patients have poor glycaemic control and older age, duration of diabetes, poor dietary habits, rural lifestyle, poor medication and low education are the eliciting elements of poor glycaemic control [13-15]. Inadequate glycaemic control prevailed in the majority of aged Pakistani diabetic subjects. SMBG levels have been reported to be associated with clinically and statistically improved glycaemic control irrespective of diabetes types or therapies. Eliciting factors of poor glycaemic control and increase awareness on the significance of SMBG and strongly promote this practice among diabetic patients should be taken seriously by the healthcare authorities in targeting multidimensional interventions to accomplish good glycaemic control [8,9]. In the year 2017, about 6.9% (7,474,000 individuals) of the Pakistani population were suffering from diabetes and the country was on 10th position (projected to be on 8th position in 2045) among high burden diabetes countries all over the world [1]. Numerous studies on SMBG have been done in different countries and also in Pakistan but there is no such study conducted in Mardan district of Khyber Pakhtunkhwa province (KP) in Pakistan [8,9]. Therefore, the present study is aimed at investigating the association between blood glucose, measured as Hba1c and frequency of SMBG in diabetic patients from Mardan Pakistan [16].

Materials and Methods

Study area: This study was conducted in District Mardan of Khyber Pakhtunkhwa. Data were obtained from patients with diabetes from District Mardan. The Mardan city is on 23rd position in the list of big cities of Pakistan and the second largest city of Khyber Pakhtunkhwa with human population size of 331,837. Mardan is located in the southwest of the district at 34°12’0N 72°1’60E and at altitude of 283 metres (928 ft). An economic zone is planned as a part of the multi-billion-dollar China-Pakistan Economic Corridor (CPEC) near Rashakai. Mardan features a hot semi-arid climate. The average temperature in Mardan is 22.2°C, while the annual rainfall averages 559 mm. (https://en.wikipedia.org/wiki/Mardan).

Study Population

The data were collected from 100 diabetic patients of Mardan including male, female and children related to different age groups. These patients were suffering from type-2 diabetes. Data collection: Data were collected from the patients of diabetes diagnosed in Mardan Medical Complex, private clinics and private hospitals in District Mardan. during January 2019 to March 2019 through convenience survey. Information was obtained by structured questionnaires on diabetes therapy and blood glucose self-monitoring. All the participants were briefed about the study and then their written consent was obtained. All the subjects were subjected to interview for filling the questionnaire proforma regarding the study. Data regarding glycemic values, socio demographic and clinical characteristics of the patients were recorded. All those subjects with severe illness, having accidental physical disabilities, unable to comprehend this study, those having life threatening diseases and those suffering from cholera, dengue or malaria.

The Questionnaire Proforma Encompassed the Following Parameters

General Information: Patient name, age, gender, weight, ethnicity, type of diabetes, duration of diabetes, diabetes therapy, fasting plasma glucose, random plasma glucose, Hba1c.

Additional Information: Family history, additional disease with diabetes, allergies, hypoglycemic episodes, education, income and employment.

Study Variables: These variables included glycemic control parameters including FPG, RPG and HbA1c. Socio-demographic and clinical features, depression, cognitive status, physical status, weakness, nutritional status, pain and level of self-care were independent variables. The target value for HbA1c was <7%, FPG was 80–130 mg/dL and RPG was <180 mg/dL [17]. Subjects having HbA1c, FPG, and RPG levels above the upper threshold of the target levels were declared as having poor glycemic control.

Statistical Analysis: SPSS version 21.0 was used for statistical analyses of collected data. Descriptive statistics and bivariate correlation were applied. Mean and standard deviation were computed for quantitative variables. Qualitative variables were subjected to frequencies and percentage analyses.

Results and Discussion

Descriptive analysis showed that age of subjects was between 15-81 years with mean ± SD as 47.2±15.7. almost equal number of subjects belonged to urban (52%) and rural (48%) areas. Most were females (60%) subjects, and 82% subjects were suffering from years. Overall, 44% of the patients used to check their diabetes less than twice a week and 22% check their diabetes once daily. Stratification for frequency and percent of patients who test their FBS and RBS was 82% and 89% among which some people couldn’t test either FBS or RBS. The recorded FBS value was 53-345mg/dl with mean ± SD of 164.6±58.4 and of RBS was 50-560mg/dl with mean ± SD of 263.7±97.2. The frequency of hba1c was 80 with recorded value of 4.20-16.90% and mean ± SD was 10.9±23.8. Most of the people (67%) used medications along with insulin from years. Maximum of the (52%) people were not following diet to control it. Majority of the patients (78%) had high blood sugar. Weight of the patients was between 30-115kg with average between 60-70kg. Most (67%) subjects were not doing regular exercise. Maximum of the patients (73%) were consuming tea 42% showed no family history of diabetes while 40% subjects had one parent affected and 18% had both parents affected. Most of the patients (98%) had other problems like vision problem, nausea, numbness etc. Sixty percent subjects were literate with majority of unemployed, and 55% were middle class (Table 1). By using bivariate correlation, we performed Pearson correlation coefficient. The values p˃0.05 and p˃0.01 show significant linear relationship. From this correlation analysis a linear relationship between age and weight was determined as well as between gender and SMBG, insulin, diet and weight. There was no correlation between SMBG and Hba1c (Table 2).

biomedres-openaccess-journal-bjstr

Table 1: Descriptive Statistics of factors associated with diabetes.

biomedres-openaccess-journal-bjstr

Table 2: Bivariate correlation among the study variables.

In past few decades, huge rises in diabetes prevalence have been confirmed in almost all areas of the world, with 415 million people worldwide now living with diabetes [17]. Diabetes is among the metabolic disorders characterized by elevated blood sugar levels for a long time period. Diabetes afflicts various complications like diabetic ketoacidosis, hyperosmolar hyperglycemic state, or death. Other severe complications can be cardiovascular disease, stroke, chronic kidney disease, foot ulcers, and eyes damage. (https:// en.wikipedia.org/wiki/Diabete). In 2000 the global prevalence of diabetes was estimated to be 151 million by International Diabetes Federation (IDF). In 2003 the number reached to 194 million, in 2006 the number increase to 246 million, in 2009 it reached to 285 million, in 2011 it increased to 366 million, in 2013 it reached to 382 million, in 2015 it reached to 415 million. In recent study it was estimated that in 2017 about 425 million cases of Diabetes in age group 20-79 years throughout the globe, If the age range is increased to 18-99 the estimated case of diabetes rises to 451 million, the number of diabetes cases are increased day by day and reached to 629 million people for age range 20-79 years [17].

According to a recent study in Pakistan, 11.77% prevalence of type-2 diabetes mellitus has been recorded. Males were more affected (11.20%) than females (9.19%). Likewise, this trend was reported in 3 provinces of Pakistan as well reporting 16.2%, 12.14% and 13.3% prevalence in males as compared to females as 11.70 %, 9.83% and 8.9% respectively in Sindh, Punjab and Baluchistan province respectively. While in Khyber Pakhtunkhwa (KP) Province, females (11.60%) were more affected than males (9.2%). This prevalence was higher in urban areas (14.81%) as compared to that reported from rural areas of Pakistan (10.34%) [18]. In our study we focused on the frequency of blood glucose monitoring in relation to glycemic control in patients with type- 2 Diabetes. This kind of study was first reported from Scotland by Evans et al. [10] to investigate patterns of self-monitoring of blood glucose concentration in diabetic patients and to determine whether frequency of self-monitoring is related to glycaemic control. Further studies are conducted in different countries. In Pakistan similar study has been reported from Agha Khan University Karachi by Khowaja, et al. [8], to explore the association between selfmonitoring of blood glucose (SMBG) levels and improved glycaemic control (HbA1c level) among type-2 diabetic patients.

Our study revealed that 89% subjects were suffering from type- 2 diabetes, 5% from type 1 diabetes, 1% from gestational and 5 from other types of diabetes. Out of 100 cases 40% were male and 60% were female. Stratification for frequency of normal blood glucose in patients suffering with diabetes mellitus with regards to duration of diabetes mellitus was recorded which shows that out of 100 cases 82 subjects have diabetes from years, 15 have from months and 3 subjects have diabetes from days. Overall, 52% belonged to urban areas and 48% from rural. Frequency of Hba1c was 80%. Seventy nine percent did not develop any types of allergies. The normal blood glucose in patients suffering with diabetes with regards to financial status shows that out of 100 cases 10% were of lower class (10,000-20,000), 60% were of middle class (20,000- 40,000) and 30% were from upper class (> 40,000). Frequency of control of blood glucose in patients suffering with diabetes mellitus with regards to educational status showed that 60% patients were literate, and 43% were employed. By using bivariate correlation, we performed Pearson correlation coefficient. Basically, this was performed the extent to which two variables are linearly related. The value p˃0.05 and p˃0.01 show significance. From this correlation we found that there is significance association between age and weight. There is also significance link between gender and SMBG, insulin, diet and weight. According to frequency of and time of doing SMBG, the results of the participants who did SMBG were above or below the target for glycemic control. This means that doing SMBG is not currently associated with better glycemic control. There is no liner relationship between self-monitoring blood glucose and Hba1c.

Evans et al. [10], have reported a direct relationship of haemoglobin A1c level with the number of strips collected during previous 6 months in diabetic patients. They have not found any association of HbA1c level and SMBG in diabetic patients using insulin. It may be due to the fact that SMBG is more effective in true insulin deficiency unlike the insulin resistant state. Or diabetic patients might have no aware of insulin use, more worried about the risks of hypoglycaemia, and hence less likely to act on the results of tests. Our study is similar to Harris [11] who evaluated the association of SMBG and HbA1c. They reported no such association between the frequency of SMBG and HbA1c level of those diabetic patients treated with insulin, oral agents, or diet alone. More educated, having a diabetes patient education class, and frequent visitor to physician were found frequently practicing self-monitoring. However, SMBG was not associated with higher economic status or to having health insurance. Our study was quite contradictory to the study of Khowaja and Waheed [9] because they examined that self-monitoring of blood glucose concentration is associated with improved glycaemic control, which prevents complications resulting from diabetes. Their study indicated that there was a significant association of self-monitoring of blood with glycaemic control. It was contradictory may be because their sample size was 5 times higher in number than our study samples. Davis, et al. [15] also determined, like our study that both cross-sectional and longitudinal Fremantle Diabetes Study (FDS) data revealed that Hba1C was not statistically different between SMBG users and nonusers. This study is also similar to Alzahrani, et al. [18] establishing that the results of the patients who followed SMBG were beyond the target for glycemic control which reveals that SMBG is not linked with improved glycemic control. In our study we do not support the association of SMBG to glycemic control. The results of our study reveal that SMBG is important, but it also indicates that majority of subjects were checking their blood sugar occasionally. It was also observed that participants doing SMBG, were managing their diabetes well and self-monitoring may be recommended particularly in those patients who are the most difficult to control.

It is established that education and economic status are also the possible effect modifiers for controlling the blood glucose levels. Besides regular checking of blood glucose, lifestyle reform also needed to be done in diabetic patients including diet and regular exercise. The results of this study may be handy for creating awareness of blood glucose control during diabetes ultimately reducing the morbidity level in due to diabetes [19].

Conclusion

According to the result of our study, regular self-monitoring in patients with diabetes is uncommon and the self-monitoring of blood glucose is not associated to glycemic control among type- 2 diabetes. There is a lack of knowledge about SMBG and Hba1c testing and control in public.


For more Articles on: https://biomedres01.blogspot.com/

Thursday, April 27, 2023

Premature Mortality due to Breast Cancer in a Mountainous Province of Vietnam from 2005 to 2018


Premature Mortality due to Breast Cancer in a Mountainous Province of Vietnam from 2005 to 2018

Introduction

Breast cancer has been worldwide recognized to have a high mortality rate among women despite wide variations in ethnicity, culture, and economics. It was reported that breast cancer is the most commonly diagnosed cancer among women in 140 of 184 countries worldwide [1]. More than one million new cases of female breast cancer are diagnosed each year. Approximately one in 4 of all new cancer cases diagnosed in women worldwide are breast cancer, followed by 6.6% of cancer death in 2018 [2]. The breast cancer mortality rate has been substantially increasing in the world during the past 25 years [3]. According to the American Cancer Society, the overall breast cancer incidence rates increased among Asian/ Pacific Islander (1.7% per year), non-Hispanic back (0.4% per year), and Hispanic (0.3% per year) [4]. In China, mortality from breast cancer rose progressively during the past three decades in both rural and urban areas [5]. An estimated 268 600 women were diagnosed and 69 500 died of breast cancer in 2015, accounting for 15.1% of all new cancer cases and 6.9% of all cancer deaths in Chinese women, respectively [6].

Vietnam, situated in Southeast Asia, is a developing country with a GNP per capita of USD 2,540 in 2019. Social health insurance is voluntary of approximately US$20.00 per annum, which is paid by individuals and their households. In Vietnam, breast cancer is reported to be the most common cancer in Vietnamese women [7]. There were 15,229 cases of breast cancer were diagnosed in 2018, accounting for 5.3% of all cancer deaths [2]. In response to this situation, the Vietnamese government has introduced nationwide breast self–examination education as the method for early detection [8]. Moreover, the usage of mammography and hormone therapy for patients with estrogen-receptor-positive breast cancers has been improved the life expectancy of patients with breast cancer [9]. However, lacking population-based studies about this fatal disease hindered the establishment of focused primary prevention strategies. The mortality rate is a basic and critical indicator for the development of appropriate and effective intervention programs and monitoring the health of patients with breast cancer. Lang Son is a mountainous province in the Northeast region with a natural area of 8,187.25 km2, bordering Guangxi province in China.

The population of the province in 2019 is 782,811 people, mainly living in rural areas (accounting for 80.7%). Lang has a high proportion of ethnic minorities (84.74% of the province’s population). Currently, there are 30,583 poor households, accounting for 15.83%; 21,267 near-poor households, accounting for 11.01% [10]. Having these geographic economic conditions, Lang Son province is considered as the representative of mountainous provinces in Vietnam where the citizens have a limited chance to approach high-quality health care services. In this context, this study was conducted to clarify the status of breast cancer mortality in Lang Son province from January 2005 to December 2018 to provide an updated and comprehensive understanding of recent trends of breast cancer mortality in this province.

Material and Methods

Study Design and Data Source

This is a population-based study of the time series of deaths from breast cancer of women living in Lang Son province. The data was collected in two steps. At first, the mortality information was recorded in an official book referred to by The Ministry of Health’s death recording systems (A6) managed by the Lang Son CDC. The A6 mortality systems were validated and presented to be a reliable and feasible system for mortality recording [11]. These unique systems were introduced to be used nationwide in Vietnam in 1992. All deaths occurring in the communities were registered at the state commune health stations. The data from the A6 was collated and determined monthly by the head of the state commune health stations who in turn forward the information every year to the Lang Son CDC from 2005 to date to develop a database of mortality there. Five indicators included the case’s ID, age, sex, date – place - cause of death, and ICD-10 coding. To prevent duplicate records, the head of the commune health station, trained medical workers, followed carefully the medical care for each morbidity case for each resident for at least 6 months until the outcome was identified. By this follow–up process, all deaths in the list have described the cause of death based on medical records. Besides, data on population was collected with careful cross-check with several independent information sources such as the departments for provincial statistics, the department of Population – Family – Children, the Committee of Family and Planning. We included all cases that were dead of breast cancer from January 2005 to December 2018, ICD-10: C50 for the present study. The Lang Son population-based mortality registration covered over 226 state commune health stations of 11 cities/districts of the province. The average resident number of each state commune health station was annually collected by the Lang Son CDC.

Data Analysis

Data was reviewed and cross-checked between information sources, cleaned, encoded, and reported by Excel software, analyzed by STATA 15.0. For the calculation of the mortality rates of breast cancer, the ratio was determined between the number of deaths from breast cancer in women and the female population in that year, multiplied by 100,000. The world population structure and the Segi’s world population standard were used to estimate agestandardized mortality rates per 100,000 (ASR). Mortality rates ratio and 95% confidence interval adjusted for age groups (0-9, 10- 19, 20-29, 30-39, 40-49, 50-59, 60-69, 70-79, 80+) was estimated to observe time trend from 2005 to 2018.

Ethical Approval

This is a population-based study about mortality rate with no interfere with no physical intervention. This information to identify patients including name, personal address, date of birth, would be not published. Moreover, due to the database purpose, which is to provide accessible data to help improve the mortality of breast cancer in the community, the public interest is considered to outweigh personal interests in privacy or autonomy that would otherwise be protected by consent mechanisms. The research protocol was approved by the Hanoi Medical University Review Board in Bio-Medical Research # 61/HMURB, dated 25 November 2008 and by the Board of Ethics in Bio-Medical Research at University of Medicine and Pharmacy at Ho Chi Minh City #106/ UMP-BOARD, dated 20 March 2019.

Results

From January 2005 to December 2018 (missing data for 2009- 2010), there were 210 deaths out of 17,990 women diagnosed with breast cancer in Lang Son province. Table 1 showed the crude mortality rate and the age-standardized mortality rates from breast cancer at all ages between 2005 and 2018. The crude mortality rate of breast cancer was 4.7. After adjusting using the World Health Organization standard population for 2000 – 2025 and the Segi World standard population (in the 1960s), the ASR was 5.2 and 4.7, respectively. Over four-fifths of death cases died under the age of 70 (81.5%). In Table 2, the crude rate and the ASR rate were annually calculated. The lowest ASR per 100,000 person-year was found in 2006 (3.2). The value of 7.0 was the highest ASR that occurred in 2012. When the first two-year 2005-2006 was the reference group, the mortality rate ratio for 2018 was increased, but not statistically significant, age-adjusted MRR, 95%CI: 1.36, 0.78, 2.35, p for trend=0.209, (Table 3). Figure 1 presented the age-specific mortality rate per 100,000 person-years during the study period. The mortality rate was found to be at a low and stable level from the age group 0-9 to the age group 20-29. There was, on the other hand, a rapid rate of increase at the reproductive age, especially at the age group 40 – 59, and slow down after that. The highest specific cancer mortality rates per 100,000 were seen for the age group 60-69. The curve thereafter was seen to be declined (Figure 2).

biomedres-openaccess-journal-bjstr

Figure 1: Location of the study population, Lang Son province in Viet Nam.
(Source: https://commons.wikimedia.org/wiki/File:Lang_Son_in_Vietnam.svg)

biomedres-openaccess-journal-bjstr

Figure 2: Age-specific mortality rate per 100,000 person-years in women during 2005-2018 (missing data for 2009-2010) due to breast cancer

biomedres-openaccess-journal-bjstr

Table 1: Mortality due to breast cancer in women during 2005-2018 in Lang Son province & Crude rate per 100,000 person-years; @ Age-standardized rate per 100,000 person-years using the World Health Organization standard population for 2000-2025; # Proportion of death cases aged under 70 year-olds. @ Age-standardized rate per 100,000 person-years using SEGI World standard population (in the 1960s). Missing data for 2009-2010.

biomedres-openaccess-journal-bjstr

Table 2: Mortality due to breast cancer in women by year from 2005 to 2018 in Lang Son province. The estimated proportion of deaths due to breast cancer was 1.17% (210 cases of breast cancer vs. 17,990 total cases) in women. & Crude rate per 100,000 personyears; $ Age-standardized rate per 100,000 person-years using the World Health Organization standard population for 2000-2025; # Proportion of death cases aged under 70 year-olds. Missing data for 2009-2010.

biomedres-openaccess-journal-bjstr

Table 3: Mortality rates ratio and 95% confidence interval by years from 2005 to 2018 in Lang Son province.

Note: ## adjusted for age groups (0-9, 10-19, 20-29, 30-39, 40-49, 50-59, 60-69, 70-79, 80+). Missing data for 2009-2010.

Discussion

We observed a serious prelature breast cancer mortality in the Lang Son province, remote mountainous areas. Female breast cancer has presented at young age women and the proportion of premature death was very high, over four-fifth of total death cases. The result has highlighted the importance of public health policies for better prevention and management of breast cancer screening to reduce premature death in the study population. Moreover, financial support policies should be implemented to promote access to appropriate diagnosis and treatment for women living in disadvantaged areas. After adjusting with the World Health Organization standard population, 2000-2025, the ASR of breast cancer in Lang Son province is 5.2/100,000 during study time from 2005 to 2018. In consistence, the studies in Chinese women living in rural areas, the ASR in 2013 and 2014 of breast cancer were 5.59/100 000 and 5.79/100 000, respectively [6,12]. The ASR of breast cancer of our study is lower compared to one among women living in Ha Noi – the capital of Vietnam in the period from 1996- 2005 and the ASR of breast cancer in Vietnam in 2012, which were as high as 13 and 9.9, respectively [13,14]. Hanoi City is the highest urbanization that can be explained why the breast cancer in this city was higher than in the Lang Son province.

To reduce young age death from breast cancer, the National Cancer Control Programs increasing the awareness of early detection of breast cancer and providing free screening for breast cancer and cervical cancer has been conducted in Vietnam since 2008. There were other several programs such as the “Early detection of breast cancer and cervical cancer in women” program implemented from 2012, the “We care for her” happening in 2013–2014. The Vietnam Women’s Union has representatives at every commune has been also running programs to educate how to do breast self–examination [8]. Moreover, treatment for breast cancer in Vietnam has been remarkably improved recently. Bettertolerated therapies have been replacing ablative surgery and aggressive chemotherapy. Tamoxifen or other hormonal therapies, cytotoxic, and targeted therapies, shown to significantly reduce breast cancer recurrence and mortality in breast cancer patients [15,16], are all available in Vietnam [8]. In addition, the population variation of our study comparing the previous studies might be likely the inducement. Nationwide, Vietnam has many cities in the progress of “modernization”, where women are at increasingly high risk of breast cancer such as decreased parity, delayed childbirth, less breastfeeding which was demonstrated to be risk factors of breast cancer in low–income countries as well as in Vietnam [17,18]. However, these programs have been piloted at the areas of urbanization of the Hanoi and Ho Chi Minh Cities, but that might not be ready in the Lang Son province.

In terms of the trend mortality rates during the study period, there was a non-increasing trend during 2005-2018 but it is suggested to be increasing soon due to many environmental factors and lifestyles of an unhealthy diet, tobacco smoking, harmful usage of alcohol, and lack of physical activities. This result is consistent with previous studies showing the rise of breast cancer mortality in other territories. For instance, according to a global analysis, there was a significant increase in breast cancer mortality rates in all super regions. For total world countries, the mean breast cancer mortality rate was 13.77 per 100,000 in 1990 and the overall increasing slope of the mortality rate was 0.7 per 100,000 from 1990 to 2015 [3]. Another study presented a tendency of increased deaths from breast cancer in Brazilian women, particularly in young women from 1996 to 2013 [19]. In China, the standardized mortality rate of breast cancer was similarly shown to have an upward trend [20]. To improve cancer prevention for Vietnamese women, it is important to establish better public health policies and management of breast cancer, especially in remotes areas. It was reported that the majority of breast cancer patients in Vietnam are detected at the advanced stages [21], which was revealed to be the result of poor knowledge and awareness among the general public [22].

In a study conducted in the mountainous area in Northern Vietnam, the level of knowledge and practice about breast selfexamination, clinical breast examination, breast ultrasound, and mammography were still adverse. Approximately 17% of women mentioned clinical breast examination, and only 13.8% reported practicing breast self-examination [23]. Among women living in one rural district, more than half of all the participants, including both younger (69.5%) and older (53.3%) women, believed that they would not get breast cancer if they took good care of themselves [24]. In central cities such as Hanoi and Ho Chi Minh City, the prevalence of sufficient knowledge and practice breast self–examination among female textile workers were only 22.7% and 15.8% [25]. In this context, increasing awareness about the importance of breast cancer screening and developing early detection strategies for breast cancer is essential. Community education programs and low-cost screening approaches such as clinical breast examination should be conducted widely to ensure the accessibility of all Vietnamese women, especially ones residing in remotes areas. The mammography screening should be suggested in high-risk women according to the age-specific mortality rate results.

Furthermore, the long treatment course of breast cancer has been causing a significant financial burden to the patients, especially the patients without health insurance. A recent study conducted in South East Asia, including Vietnam, showed that 48% of cancer patients incurred financial catastrophe within one year after the diagnosis [26]. It was estimated that the annual medical expenses for breast cancer treatment amounted to 18% of gross national income (GNI) per capita in Vietnam in 2010 ($195 vs. $1,100) [27]. These facts again emphasize the role of breast cancer screening in Vietnamese women since the diagnosis at the early stage can reduce significantly the cost of initial treatment. Besides, the financial burden of the treatment course could be a barrier to seeking care and to appropriate treatment compliance, which may contribute to the higher mortality of breast cancer. Therefore, establishing a policy of universal health insurance coverage along with other financial supports would improve access to medical care and the prognosis of breast cancer patients in Vietnam. The government should give financial support to breast cancer patients whose cost of illness exceeds their ability to pay. Furthermore, a network of primary health care such as home care and community care should be promoted to provide health care services to breast cancer women throughout the country. These settings may improve compliance with treatment and reduce costs for patients in Vietnam, where access to health facilities for cancer treatment has been limited. This combination would encourage the patients to comply with their long-term treatment and thus contribute to reducing deaths from cancers, including breast cancer.

Moreover, the current vertical and central organization of health care services in Vietnam may limit the accessibility of medical treatment for breast cancer patients living in mountainous areas. The lack of surgical oncologists, medical and radiation oncologists, anesthetists, and pathologists at the low level of the health system also has a significant effect on providing comprehensive treatment to breast cancer patients. Authorizing and supporting district and commune health stations with the appropriate health infrastructure and trained healthcare workforce could have a positive impact in terms of reducing in-direct costs for women with low - income to encourage them not to bypass them in favor of seeking suitable treatment as well as in reducing overcrowding in central and provincial hospitals. Breast cancer deaths in our study mostly occurred in reproductive-aged women, increasing rapidly from 40 years old, reaching a peak at the ages of 60-69, and then falling. This result is logical according to one study showing that the breast cancer incidence in Vietnamese women was highest at the age of 50 [21]. Meanwhile, the overall survival rate for breast cancer patients was 85.01 ± 1.61 months [28]. Similarly, according to a study investigating the breast cancer mortality rate in China during 1991 – 2011 showing that breast cancer usually occurs post-puberty, and its incidence increases slowly from 30 years old, reaching a peak at the ages of 40-60, and the first death peak occurring at 55 to 65 years [20]. In this sense, the clinical protocols and public policies that encourage early detection for breast cancer, and the key population should be among women between ages 40 to 65. Breast cancer screening using clinical breast examination for women aged 40 to 55 years was identified to be very costeffective in Vietnam according to the World Health Organization criteria [29]. Another study demonstrated offering the first round of mammography screening to Vietnamese women aged 50-59 years was cost-effective, with the given threshold of three times the Vietnamese GDP per capita [30]. Therefore, breast cancer screening programs need to be provided to women aged 40-65 in the combination of clinical breast cancer and mammography to improve the life expectancy for breast cancer patients as well as reduce the public economic burden.

Several limitations should be noted in this study. Firstly, it was done in only one mountainous province in the North of Vietnam, so the findings may not be generalized to all Vietnamese women. Second, there was a deficit of the information system concerning factors associated with mortality from breast cancer that is restricted in the death record. This study, however, is the first investigation of the mortality rate of breast cancer in the province at a continuous long-term period. The findings presented here were similar to and different from those reported elsewhere. Overall, the results of this study will increase our understanding and guide interventions to improve early screening for breast cancer strategies specifically for Vietnamese women, especially in remote areas, with adverse socioeconomic status. Cancer mortality rates estimated in this study are reliable because there were no duplicate records. At each commune, the head of the commune Health station followed up carefully all fatal cases occurring at his commune while giving medical care and household visiting until the result as neighborhood relationship as well as a duty of the appointed medical worker position. Despite these limitations, the present findings had highlighted the public health problem of premature breast cancer in the low-medium economic countries that warrant global action plans against this preventable disease.


For more Articles on: https://biomedres01.blogspot.com/

The Skin Aging Process and Anti-Aging Strategies

  The Skin Aging Process and Anti-Aging Strategies Introduction Appearances play a vital role in society as it is how one communicates to ot...