Saturday, July 31, 2021

Please Patiently Pick Per Person-Pedadogue, Pretender, Plagiartist, Pilferer


Please Patiently Pick Per Person-Pedadogue, Pretender, Plagiartist, Pilferer 

Peter Piper Picked A Peck of Pickle Pepper. A peck of Pickle Pepper Peter Piper Picked. If Peter Piper Picked a Peck of Pickle Pepper, where’s the Peck of Pickle Pepper Peter Piper Picked?

As childish as this tongue twister sounds, it asks a profound question-shouldn’t anyone who claims to have done or discovered something be able to provide indisputable evidence? Today when we hear, think or talk of scientific theories or inventions specific names come to mind. Almost like a Pavlovian response we think Darwin when we think evolution, Einstein when we think relativity, Newton when we remember gravity and Zuckerberg when we talk of Facebook. But how many of these individuals actually borrowed and built upon the work of other forgotten or hidden figures? How many of these great names even descended so low as to plagiarize and outright steal the work of others? I myself am a victim of plagiarism. “Cellular Dust” [1] the term I coined to describe the Microzymas was hijacked by some unscrupulous elements [2] and used to describe vesicles barely a year later! [3]. Assuming we were doing some short test in some twilight zone and were given the following questions-

A. The famous formula e=mc square was discovered by:

i) Olinto De Pretto in 1903

ii) Albert Einstein in 1905

B. The principles and experiments that formed the basis of the food preservation technique known as pasteurization were first enunciated and performed by

i) Pierre Bechamp

ii) Louis Pasteur

C. Facebook was created by

i) Cameron and Tyler Winklevoss

ii) Mark Zuckerberg

D. Calculus (integration and differentiation) was invented by

i) Gottfried Leibniz

ii) Isaac Newton

E. The equation for gravitation was discovered by

i) Robert Hooke

ii) Isaac Newton

Did you pick the ‘A’s or the ‘B’s in the preceding test? Most people would probably pick the ‘B’s, but the evidence for picking the ‘A’s is stronger than you think! It is on record that Albert Einstein spoke and wrote Italian, the language in which Olinto De Pretto published the 62 page paper entitled “Ipotesi dell’Etere nella Vita dell’Universo” [Hypothesis of Aether In The Life Of The Universe] in the Atti del reale Instituto Veneto di Scienze, Lettere ed Arti Volume LXIII [Proceedings of The Royal Veneto Institute of Science, Letters and Arts]. The paper was endorsed by the well-known astronomer Giovanni Schiaparelli. It is theoretically possible that Albert Einstein read Olinto De Pretto’s paper and plagiarized it! [4] Olinto De Pretto was shot to death not long after, so Einstein could easily have gotten away with it. For many years Louis Pasteur was a notorious believer in spontaneous generation. In other words when milk became sour or food got rotten it was the food itself that had created the germs just like that! It took the experiments of the Professor of Medicine and Chemistry Antoine Pierre Bechamp to prove that the germs came from the air, not the food. So, if you sealed the food in an air tight container you could slow down or stop the rot.

Hear the Professor in his Own Words: “I will now describe the fundamental experiment, the results whereof have completely changed the aspect of science with regard to the relations of chemistry and physiology with fermentation, such as they were still imagined to be at the end of the year 1857, after the theory of Cagniard de Latour in relation to yeast had been rejected. In 1854 it was conceded that cane sugar dissolved in water altered of itself and became transformed into what is called invert sugar, because the solution which deviated the plane of polarization to the right deviated it to the left after the alteration. The inverted sugar was also called grape sugar. The phenomenon of this alteration was called inversion. With the reference to the other researches I resolved to verify the fact and in the month of May 1854, I left to themselves in a closed flask, in the presence of a small volume of air, at ordinary temperature, in a diffused light some aqueous solutions of pure cane sugar. After several months I found that the sugar solutions in pure distilled water were partly inverted. At the beginning of 1855 I published the observations as a verification of the admitted fact, but I mentioned at the same time the presence of a mould in the inverting liquor.

It is not an unusual thing to see moulds to appear in aqueous solutions of the most diverse substances, that was why, in the then state of science and of the contradictory assertions regarding the experiments of Schwann, I would not assert anything beyond the fact. I noted merely that in the solutions to which I had added chloride of calcium, or chloride of zinc, the inversion had not taken place and no mould had appeared. To find an explanation of these differences I made various experiments, commencing in 1855 and continued them to the month of December 1857. Among these experiments, all accordant with one another, I select two, because, reducing the problem to its simplest expression, they leave no room for doubt concerning the legitimacy of the conclusions I deduced from them- the first conclusion was that: the solution of cane sugar in distilled water remains indefinitely unchanged when, having been boiled, it is preserved in an absolutely full closed vase. The second was: the same solution, whether boiled or not, left in a vessel in the presence of a limited volume of air permits the appearance of colourless moulds, generally myellinated, and the solution becomes completely inverted in the course of time, while the liquor reddens litmus paper, that is to say, becomes acid. To prove that the volume of air left in the closed flask has nothing to do with the inversion it suffices to add beforehand a small quantity of creosot..these two experiments demonstrated to me clearly that the presence of the air was essential for the inversion to take place and for the moulds to be born…. [5].

A few years later “Pasteurization” took off. In all fairness, Pasteurization ought to be called Bechampization!

Pasteurization ought to be called Bechampization! It has been reported that the prototype of Facebook was actually invented by the famous Olympian Winklevoss twin brothers, who hired Zuckerberg-who then pulled the rug out from under them. It is on record that the Winklevoss brothers took Mark Zuckerberg to court and were actually awarded millions of dollars in damages! [6]. That Liebniz and Newton both invented calculus is not disputed. The controversy is who discovered it first. What is certain is that the dy-dx system used today was the notation invented by Leibniz. The clumsy dotted x notation advocated by Isaac Newton is dead as a dodo! “Newton’s” equation of gravitation is identical to the earlier published inverse square law used for sound in a gas. The law is no different from Coulomb’s equation for electrostatics either. It takes no stretch of the imagination to suspect Isaac Newton “borrowed” the law from Robert Hooke. It is well documented, the intense hatred Newton had for Hooke. Newton once had Hooke’s portrait destroyed, not merely removed, when Isaac Newton became head of The Royal Society. In that age before photography existed, the result is that today no one knows for sure what Robert Hooke looked like! [7]. The bottom line is that scientists and inventors are human tooand subject to all the foibles, jealousies, hatred and pettiness that plague the holoi polio [8]. The beauty and genius of the peer review process and recourse to the courts and the justice system is what will inevitably ever separate the pedadogue, plagiarist, pretender and pilferer!!

For more Articles: https://biomedres01.blogspot.com/

The Regulation Role of PBK in Cell Cycle and Apoptosis of Prostate Cancer


The Regulation Role of PBK in Cell Cycle and Apoptosis of Prostate Cancer

Introduction

Prostate Cancer (PCa) is one of the most common cancers and has ranks first among cancers which endanger the health of men and have surpassed lung and colon cancers in the United States [1]. In recent years, due to the aging of the population, the westernization of eating habits, and the improvement of diagnosis and treatment, the incidence of prostate cancer has been increasing and ranked third in urological cancers in China [2]. The natural history and prognosis of PCa are diverse. Patients can be asymptomatic without any symptoms or high invasiveness. The Prostate Specific Antigen (PSA) is currently widely used as an indicator for PCa screening, but it is reported that about 70% of men with serum PSA>4 μg/L have no PCa. And screening at this PSA threshold inevitably leads to a higher false positive rate, resulting in unnecessary needle biopsy and puncture-related complications including hematuria, pain, infection, and sepsis [3].

Due to the poor specificity of PSA, a large amount of medical resources is wasted in the treatment of PCa. Therefore, searching for sensitive and highly specific molecular biological markers, as an indicator of prognosis of early PCa, has important scientific significance for individualized treatment of PCa and avoiding waste of medical resources. Our previous research used gene scanning technology to carry out gene detection in 5 cases of PCa patients in our hospital and compared with their paracancerous tissues. PBK was found to be highly expressed in PCa, and it is among the top 10 of differentially expressed genes [4].

PDZ binding-kinase/T-LAK cell-originated proteinkinase (PBK/ TOPK) is a new member of the Mitogen-Activated Protein Kinase (MAPK) family, composed of 322 amino acids, and is a newly discovered silk-threonine kinase [5]. In normal tissues, Gaudet et al. [6] reported that human PBK mRNA was detected in adult testis, placenta, myocardium and pancreas, with the most abundant placenta; and low levels of PBK expression in skeletal muscle, kidney, liver, and lung were detected [6]. It is up-regulated in many tumors and leads to poor prognosis of diseases such as lymphoma, leukemia, breast cancer, melanoma and colon cancer [7-12]. Due to the relevance between PBK and cell mitosis, we hypothesized that PBK promotes tumor cell proliferation and shortens cell cycle in prostate cancer. Meanwhile, the effect of PBK on cell cycle and apoptosis in prostate cancer has not been reported.

Materials and Methods

Materials

Cell lines: Human prostate cancer cells LNCaP and DU145 were supplied by Guangzhou Land Biotechnology Co., Ltd. All cell lines were cultured under conditions of 10% FBS, 5% CO2, and 37℅ and preserved by the laboratory of the Third Affiliated Hospital of Sun Yat-sen University before experiments.

Reagents: Diethyl Pyrocarbonate (DEPC) was from Sigma. Fetal Bovine Serum (FBS), Dulbecco’s Modified Eagle’s Medium (DMEM) and trypsin were from Gibco. All primers were synthesized from Shanghai Bio Co. Ltd. The quantitative PCR Kit (SYBR Premix Ex TaTM) was applied by TAKARA. The CCK8 reagent was purchased from Beyotime Bio. The FuGENE transfection reagent was purchased from Promega. And the Annexin V-FITC Apoptosis Detection Kit was available from Keygen Co.

Methods

Construction of Pbk Overexpression and Control Cell Lines: Divided into PBK high expression group (Hi-PBK), silencing group (Si-PBK) and control group (NC). The recombinant plasmids were constructed by FulenGen Co. (Guangzhou, China). The recombinant lentivirus vectors and packaging vectors were cotransfected into 293T cells for virus package. Supernatants containing lentivirus overexpressing PBK, silencing PBK and control PBK were harvested after transfection. Then DU145 and LNCaP cells were infected with the lentivirus. Finally, through flow cytometry, the positive cells with green fluorescence were filtered out.

Real-Time Quantitative PCR: The miRNA of the collected positive cells was reverse-transcribed into cDNA. Subsequently, the target genes were amplified by RT-qPCR using cDNA as template to detect and verify the difference in expression of PBK before and after cell transfection.

a) For Hi-PBK and NC groups, the Ct value of the target gene was normalized by the Ct value of the reference gene (U6): .

b) The value Hi-PBK was normalized using the value of NC:

.

c) Calculate the change in expression: = ratio of expression. Through the introduction of reference gene to calibrate the expression of the target gene in Hi-PBK, the result showed the multiple of the increase or decrease of the target gene in HiPBK relative to NC.

Cell Cycle Assay: The DU145 and LNCaP cells were infected with lentivirus for 48 hours before analysis. For cell cycle analysis, 1×10⁶ cells were harvested, centrifuged without supernatant from each group and fixed with pre-cooled 70% ethanol at 4℃ overnight or -20℃ for a long time before being washed twice with pre-cooled PBS. Then, cells were harvested by centrifugation, washed once with 1mL PBS, resuspended in 500μL PBS containing RNase A (100 μg/ml), Propidium Iodide (PI) (50 μg/ml) and 0.2% Triton X-100 and incubated at 4°C for 30 minutes in darkness. Finally, according to the standard procedure of flow cytometry, generally counting 2-3 million cells, and the results were analyzed the cell cycle by ModFit.

Apoptosis Assay: The cells were suspended and centrifuged at 1000 rpm for 10 minutes at 4℃. The supernatant was discarded. Then the cells were resuspended in the labeled buffer. Subsequently, Annexin V-FIT was added at room temperature for 15 minutes in darkness. After adding labeled buffer, apoptosis could be observed by fluorescence microscopy and flow cytometry.

Statistical Analysis: Data are presented as the mean ± standard deviation (X ± S). Data was statistically analyzed by Student’s t-test and adjusted by Bonferroni correction. P values below 0.05 (P < 0.05) was considered statistically significant. All statistical analysis was performed using IBM SPSS statistical software (version 17.0).

Results

RT-qPCR: After constructing Hi-PBK, Si-PBK and NC DU145 and LNCaP PCa cell lines, we performed RT-qPCR to identify the construction of cells. And it was found that compared to the blank control groups, the data showed the expression of PBK was significantly decreased in the groups of Si-PBK cell lines (DU145, the inhibition rate =84.78% P<0.01; LNCaP, the inhibition rate =94.79%, P<0.01); While the expression of PBK was significantly increased in the overexpression groups (DU145, fold=1.20,P<0.05; LNCaP, fold=1.35, P<0.05) (Figure 1). It was proved that the above cell lines were successfully constructed, and the above cell lines could be used for subsequent experiments. PBK can increase PCa cell cycle progression: The cell lines (LNCaP and DU145) mentioned above were employed to study the effect of PBK on PCa cell cycle. The results of cell cycle analysis showed that after inhibition of the expression of PBK caused cell cycle arrest at the G0/G1 phase (LNCaP, P<0.05; DU145, P<0.01) (Figure 2); On the contrary, a higher proportion of S, G2/M phase was shown in the over-expression-PBKDU145/LNCaP cell lines (LNCaP, P<0.05; DU145, P<0.01) (Figure 2).

Figure 1: RT-qPCR verification to construct PBK inhibitory and overexpressing cell lines.

Note: (Compared with NC group, *P<0.05)

Figure 2: Cell cycle changes of PCa cell lines after different treatments.

Note: A and B are cell cycle changes of LNCaP cell lines under different treatments; C and D are cell cycle changes of DU145 cell lines in 3 groups.

It was shown that inhibition of PBK expression could inhibit the cell division process of PCa cell lines, and PBK overexpression could shorten the cell cycle of prostate cancer cell lines. PBK can inhibit apoptosis of PCa cells: According to flow cytometry, compared with the control group, the cell apoptosis of DU145 and LNCaP cells was significantly increased after the inhibition of PBK expression (P<0.05) (Figure 3), while an opposite result shown in the PBK overexpression cell lines (LNCaP, P<0.01; DU145, P<0.05) (Figure 3). It was indicated that high expression of PBK could inhibit apoptosis of PCa cells.

Figure 3: Apoptosis of prostate cancer cell lines after different treatments.

Note: A and B were the apoptosis changes of LNCaP cell lines under different treatments; C and D were the apoptosis changes of DU145 cell lines among 3 groups.

Discussion

Prostate cancer is one of the common malignant tumors in men worldwide, which prognosis is highly variable. With the popularity of serum PSA screening, more and more prostate cancer patients can be diagnosed at an early stage and get good therapeutic effects after undergoing radical surgery with adjuvant medication. However, PSA screening lacks specificity for the diagnosis and prognosis. We still do not have an effective prognostic assessment of early prostate cancer patients, leading to a lack of targeted treatment: delay treatment time, or over-treatment which wastes a lot of medical resources. Thus, to explore the molecular mechanisms affecting the prognosis of prostate cancer, and find new molecular markers for prostate cancer progression, recurrence and metastasis, it is possible to assess the prognosis of patients with early prostate cancer, and even provide more effective individual treatment.

As an important mitotic kinase, PBK has been reported to have a close relationship with the cdk1/cyclin B1 complex and plays an important role in mitosis [8]. PBK expression and phosphorylation increase during cell mitosis [13]. In the mitosis phase, PBK is upregulated and directly binds to cdk1/cyclin B1 to form a complex. Threonine 9 (T9) in PBK will be phosphorylated by cdk1/cyclin B1 complex. Then, PBK and cdk1 after phosphorylated by T9 / cyclin B1 combines more closely [14]. In fact, PBK phosphorylated accumulates on the mitotic spindle and affects spindle formation [15]. Studies using siRNA to knockdown PBK have shown that PBK can affect spindle formation [8]. When PBK is inhibited, the spindle (especially the central part) in mitosis becomes blurred, and the subsequent cytoplasmic division cannot be successfully completed. As a result, the cells will split out of the multinucleated cells. Therefore, PBK is involved in the regulation of proliferation and cycle changes of malignant tumor cells to promote the tumor cell transformation [5].

Conclusion

Finally, we first demonstrated that PBK transcription factors can shorten the tumor cell cycle and inhibit cell apoptosis in prostate cancer. PBK has been shown to play a role in promoting cancer in prostate cancer. In addition, study on the expression of PBK in the cell cycle reported that PBK increased in G2 to M phase, which promoted the expression of cell cycle-related genes to accelerate cell cycle progression, causing cell proliferation, repairing DNA damage and inhibiting apoptosis [8]. PBK may play a similar role in prostate cancer. In this study, we also found that inhibiting PBK expression, tumor cells will remine in G0/G1 phase. PBK has been shown to play an important role in the division of prostate cancer cells. This demonstrated that PBK played an important role in the division of prostate cancer cells. In conclusion, the detection of PBK may contribute to the early diagnosis and prognosis of prostate cancer

Acknowledgment

This work was supported by Medical Scientific Research Foundation of Guangdong Province (Grant No. B2018151), Guangdong Natural Science Foundation (Grant No. 2018A030313946) and Science and Technology Planning Project of Guangzhou (Grant no. 201610010016).

For more Articles: https://biomedres01.blogspot.com/


Study of Dimer Lead Compounds via Triazole Rings as Novel Potential Antitumor Agents


Study of Dimer Lead Compounds via Triazole Rings as Novel Potential Antitumor Agents


Introduction

Cancers still remain the second leading cause of death worldwide after cardiocascular diseases. It is estimated that about 18.1 million new cancer cases and 9.6 million cancer deaths in 2018 [1]. However, the medicines for treatment of malignant tumors are far from sufficient. So the development of novel agents with good therapeutic is the key topics which have been concerned currently [2]. Natural products based drug discovery has become a major strategy in modern pharmaceutical research [3], and roughly 60% of the currently used cancer chemotherapeutic agents are directly or indirectly derived from natural products, but the high toxicity, the lack of “true” tumor cell specificity, and the narrow therapeutic margins of the most natural compounds has limited their application as a drug in cancer chemotheraphy [4-7]. Recently, more attention has been attracted on targeting anti-cancer drugs: disrupting tumor-specific cell signaling, cell division, energy metabolism, gene expression, drug resistance and so on. The structural modification of natural compounds for developing new antitumor drugs with increased selectivity and reduced toxicity is highly desirable. For example, the 1,2,3-triazole ring is a widespread functional group in various drugs [8]. The Cu(I)-catalyzed azide-alkyne cycloaddition (CuAAC) reaction (Click reaction) was a powerful means for linking two molecular fragments between a terminal alkyne and an azide to generate substituted 1,2,3-triazole (Figure 1) [9,10]. Click reaction has recently emerged as one of the most powerful tools in drug discovery, chemical biology, and proteomic applications.

Figure 1: The Cu(I)-catalyzed Husigen azide-alkyne 1,3-dipolar cycloaddition reaction (Click reaction).

A dual inhibitor is likely to reduce the liabilities associated with combination treatments, particularly, off-target toxicities, drugdrug interactions, and additive effects [11]. In addition, dual target inhibitors would likely retain cytotoxic activity when resistance was acquired due to alteration of only one drug target. Thus, dual inhibitors are an attractive therapeutic approach in the drug development process. The Click reaction can link two molecular via 1,2,3-triazole ring, the strategy of dimer lead compounds via triazole rings as potential antitumor agents shown in Figure 2. As illustrated in Figure 2, two drugs (same or different drugs) linked via a triazole ring with the different length of the linking spacer between the drug and the 1,2,3-triazole (Figure 2I); or two drugs (same or different drugs) linked via two triazole rings with the different length of the linking spacer between the drug (1,2,3-triazole ring) and the 1,2,3-triazole (Figure 2 II).

Figure 2: The strategy of dimer natural active lead compounds via triazole rings.

Recently, the Click reaction has been gaining popularity link two molecular fragment in creating a wide variety of drug-like molecules [8,12], such as paclitaxel [13], podophyllotoxin [14,15], and camptothecin [15]. Unpublished findings from our laboratory suggest that dimeric epigallocatechin gallate/ camptothecindervatives, and epigallocatechin gallate-4β-triazolopodophyllotoxin/camptothecin conjugates showed highly potent anticancer activity. Thus, the strategy of dimer natural active lead compounds via triazole rings can promote the development of double target inhibitors which reduces the length and complexity of trials as well as costs.

Conclusion

Cu(I)-catalyzed azide-alkyne cycloaddition (CuAAC) reaction was employed successfully to prepare a series triazole-linked derivatives. The available data so far produced suggest that the dimer lead compounds via triazole rings might be an innovative strategy for potential antitumor agents. It is extremely important to continue the discussion about the dimer lead compounds via triazole rings for development of cancer chemotherapeutic agents in further studies.

Acknowledgment

This work was supported by the National Nature Science Foundation of China for financial support (No. 21602196); the Yunnan Provincial Science and Technology Department (Nos. 2017ZF003-04, 2017FD084 and 2017FG001-046); and Yunnan Agricultural University Natural Science Foundation for Young Scientists (No. 2015ZR08). 

For more Articles: https://biomedres01.blogspot.com/

Friday, July 30, 2021

Cystic Dystrophy in Heterotopic Pancreas Mimicking a Gastrointestinal Stromal Tumor


Cystic Dystrophy in Heterotopic Pancreas Mimicking a Gastrointestinal Stromal Tumor

Introduction

Cystic dystrophy in heterotopic pancreas (CDHP) is characterized by the presence of cystic dilatation of the ectopic pancreatic ducts in heterotopic pancreas, which mostly occurs in the second portion of the duodenum [1,2]. Clinical manifestations of CDHP vary greatly and the diagnosis is difficult. Endoscopic ultrasonography (EUS) is regarded as the most useful investigation for the diagnosis of CDHP. We present a patient with symptomatic CDHP in the stomach that was misdiagnosed as gastric gastrointestinal stromal tumor (GIST) with EUS and CT scan.

Case Report

A 23-year-old non-alcoholic man was referred to the hospital because of a history of 3-week postprandial epigastric fullness and a gastric submucosal tumor. There was no abdominal pain, vomiting, acid regurgitation, constipation, anorexia or weight loss. Physical examination and laboratory studies were unremarkable. An upper gastrointestinal endoscopy showed a polypoid tumor, measuring approximately 2.5-3.0 cm, with a smooth surface in the prepyloric antrum (Figure 1). The gastric submucosal tumor partially obstructed the pylorus. An EUS revealed a homogeneously hypoechoic to anechoic lesion in the fourth sonographic layer of the gastric wall (Figure 2). CT scan of the abdomen also depicted a submucosal tumor in the gastric antrum. The image studies were suggestive of a diagnosis of GIST in the stomach. Therefore, the patient underwent surgical laparotomy with local resection of the tumor. Operative findings demonstrated a submucosal tumor, 26x20x16 mm in size, with an intact capsule, mucus-like content and ductal structures in the posterior wall of prepyloric antrum. Histopathologic examination of the excised specimen showed a heterotopic pancreas composed of acini, large ducts and smooth muscle bundles located in the muscular layer ((Figure 3A & 3B, 3H & 3E), orig. mag., ×20 and ×200), which was compatible with the diagnosis of cystic dystrophy in heterotopic pancreas. The symptom of postprandial abdominal fullness of the patient improved after operation. No recurrence was detected after 18 months follow-up.

Figure 1: Endoscopic image shows a polypoid tumor with a smooth surface in the prepyloric antrum. The submucosal tumor nearly obstructed the pylorus.

Figure 2: Endosonographic view of a homogeneously hypoechoic to anechoic lesion in the fourth sonographic layer of the gastric wall.

Figure 3: Histopathology reveal a heterotopic pancreas composed of acini, dilated ducts and smooth muscle bundles located in the muscular layer (A and B, H&E, orig. mag., ×20 and ×200).

Discussion

Heterotopic pancreas, a rare but benign developmental anomaly, is defined as pancreatic tissue that has neither vascular nor anatomic continuity with the normally located pancreas proper [3]. The lesion is usually found incidentally during routine endoscopic examination with an incidence of about one percent and can be readily diagnosed with EUS [4]. Cystic dystrophy developing in heterotopic pancreas is a pathological entity first reported by Potet et al. [5] but was seldom discussed in English literature. It is defined by the presence of cystic formations in the duodenal or gastric wall, intermingled with pancreatic ducts, lobules, and inflammatory lesions [1,2]. The mechanism by which the cystic dystrophy occurs in heterotopic pancreas is still not elucidated. Repeated attacks of pancreatitis resulting from obstruction of minor excretory ducts of ectopic pancreatic acini was hypothesized [2,6]. CDHP is often associated with chronic pancreatitis and alcoholism [1,7]. Clinical presentation of CDHP varies greatly and the diagnosis remains difficult despite recent advances in imaging techniques. The diagnosis is generally made based on sonographic findings of EUS [1,2].

EUS can identify the structure of intestinal wall, visualize sonographic characteristics of lesion and its layer of origin, and readily diagnose the submucosal tumor [8-10]. At EUS, most GISTs are well circumscribed, hypoechoic and homogenous lesions that arise from the fourth layer (muscularis propri) of gastrointestinal wall. Moreover, CDHP at EUS usually presents as intramural thickening and cystic formations located in the submucosal or muscular layer. The identification of these two different lesions seems not so difficult. However, CDHP may present as the solid pattern as well as the cystic lesion [11]. As the CDHP in our case, mucus-like content within the cystic formation found during operation may lead to the findings of hypoechoic to anechoic echogenicity at EUS, which mimicked the sonographic features of GIST. In addition, GISTs with cystic change that mimicked duplication cyst and cystic mass at EUS have been reported [12,13]. Therefore, duplication cyst and other cystic mass as well as CDHP should be considered in the differential diagnosis of cystic GIST.

Malignant change originating in the CDHP is extremely rare [1,13]. Medical treatment, such as parenteral nutrition and octreotide treatment, is the first-line management when the diagnosis of CDHP has been established. However, symptomatic patient with complicated CDHP such as our case is usually recommended to undergo surgical therapy. Although the condition is not common, it should be considered as one of the differential diagnosis in every patient with GIST and other cystic submucosal tumor. In conclusion, CDHP is an uncommon complication of cystic formations in the heterotopic pancreas. EUS may allow preoperative diagnosis. Although EUS is regarded as the most useful tool in evaluating the gastrointestinal submucosal lesions, CDHP, a rare but essential component, should be kept in mind to the differential diagnosis of GIST.

 For more Articles:  https://biomedres01.blogspot.com/


Prediction of Fluid Responsiveness in Mechanically Ventilated Critically Ill Patients with the Affection of Positive End-expiratory Pressure


Prediction of Fluid Responsiveness in Mechanically Ventilated Critically Ill Patients with the Affection of Positive End-expiratory Pressure

Introduction

Previous studies have shown that in the process of fluid resuscitation of septic shock and other critically ill patients, fluid resuscitation deficiency and excess liquid load are related to poor prognosis in patients [1,2]. To improve tissue perfusion, the hemodynamic assessment of critically ill patients is an indispensable treatment step. The factors that decide whether the amount of liquid supplement is appropriate, not only refer to the capacity of blood vessels, but also include the capacity responsiveness. According to Frank-Starling’s law, in the curve ascending branch (preload depending region), load increase will make the stroke volume (stroke volume, SV) rise significantly. In the platform stage (preload independent area), the changes of preload will not affect the SV load and fluid increase will be harmful. Therefore, determining the position of patients in the curve, i.e. determining whether the patient has the capacity responsiveness is crucial. Previous statistics have manifested that in the intensive care unit (intensive care unit, ICU), the patients with sepsis and septic shock showing reactive capacity only account for 43.5%, and blindly expansion does not continuously improve the hemodynamic status of patients [3].

The commonly used indexes such as central venous pressure (central venous pressure, CVP) and other indexes are greatly affected by the static capacity of cardiovascular fitness, myocardial contractility, chest cavity pressure and other factors [4]. The value of volume status assessment is not high [5,6]. And the numerical value of preload cannot represent the capacity responsiveness of the body [4]. Pulse-induced Contour Cardiac Output (Pulseinduced Contour Cardiac Output, PiCCO) can dynamically reflect the changes of cardiac output (cardiac output, CO) and SV. Although PiCCO is regarded as the “gold standard” to assess the capacity responsiveness, the procedure of this method is cumbersome and the materials are expensive [7]. Furthermore, the modern critical care medicine attaches great importance to avoid unnecessary catheter for the reason that it may directly or indirectly increase the mortality through catheter-related bloodstream infection [8]. In the past two decades, critical care medicine has been gradually turning from the traditional high risk of invasive monitoring to the noninvasive monitoring.

Therefore, bedside ultrasound is well received by clinicians [9]. Another advantage of ultrasound is that, in a relatively short period (usually less than 30 min), it can provide complete information about blood vessels and hemodynamics. The index that bedside ultrasound evaluates the capacity status of patients includes static index and dynamic index. Many studies have confirmed that ultrasound static index not only has the advantages of convenient, noninvasive, but also can completely replace the invasive traditional index. It has been reported that the aspect ratio of internal jugular vein measured by ultrasound was less than 0.83 could predict CVP < 8cmH2 O [10]. Other reports suggested that the diameter of IVC was less than 2 cm could predict CVP < 10mmHg, and the sensitivity and specificity reached 85% and 81% respectively [11]. Additionally, for the patients whose breath were controlled by mechanical ventilation, the IVC diameter of end expiratory which was measured under short axis of the right atrium (The crosssectional view) using M model (M mode) of TTE and the right atrial pressure measured by SVC catheter were linear correlation [12].

However, using the effect of static ECHO parameters to predict fluid responsiveness in critically ill patients is poor unless the patients obviously show hypovolemia [13]. But in the modern ICU care level, patients with obvious hypovolemia are not common [14,15]. In the current clinic, using heart’s reaction to mechanical ventilation or spontaneous breathing cycle and the degree of variation of respiratory under intrathoracic pressure change, i.e. using “heart lung interaction” to observe SV changes of patients after cardiac preload affected by pleural pressure, could determine the capacity responsiveness of patients. These indexes include SVV (Stroke Volume Variation, SVV) [16], PPV (Pulse Pressure Variation, PPV) [3], artery VTI (velocity-time integral, VTI) [14], the variation of SVC [17] and IVC [13,18] and other indexes. The treatment process of the critically ill patients with respiratory failure hemodynamics instability, is always needed to apply noninvasive positive pressure mechanical ventilation. And positive end expiratory pressure (positive end expiratory pressure, PEEP) is a commonly used function in mechanical ventilation settings. But the existence of PEEP can reduce the pressure gradient to decrease venous reflux by increasing intrathoracic pressure and lung volume, which would cause hemodynamic changes [19].

However, the effect of PEEP on the dispensability index of the inferior vena cava (the dispensability index of the inferior vena cava, dIVC), inferior vena cava diameter (IVCdmax) and other respiratory variability indexes of patients measured by ultrasound has not been reported until now. In this study, SVV, dIVC dynamic indexes and IVCdmax static index of the same group of critically ill patients were measured by monitoring the PPV and ultrasound, to further explore the application value of the above indexes in the capacity responsiveness evaluation of patients with mechanical ventilation, and to analyse the effect of PEEP on the mechanical ventilation index and common clinical capacity evaluation index including the above indexes.

Materials

The Research Object

The Research Object: 42 patients needed mechanical ventilation in department of ICU of the Second Affiliated Hospital of Anhui Medical University from February to November in 2014 (20 male and 22 female aged from 22 to 72 years, average age: 47.45±13.28). Acute physiology and chronic health evaluationⅡ(APACHⅡ): 13.48±3.53. The 42 patients are including 17 septic shock patients with perforation of colon resulting in diffuse peritonitis, 10 severe pneumonia patients, 6 severe acute pancreatitis patients, 6 liver and spleen rupture complicated hemorrhagic shock, and 3 upper gastrointestinal hemorrhage.

Inclusion Criteria:

a) Patients had invasive mechanical ventilation; vasoactive agent wasn’t used or had been evacuate

b) sinus rhythm.

Exclusion Criteria:

a. Existing fluid infusion test contraindication (acute coronary syndrome, cardiogenic shock and evidence showing overload fluid)

b. being obvious right ventricular dysfunction, right heart failure and tricuspid regurgitation

c. being younger than 18 years of age

d. being gestation

e. being intra-abdominal hypertension, bladder pressure measured by catheter >16cmH2O

f. existing pneumothorax or pulmonary bulla Without drainage.

Conforming to the standards of medical ethics, this study was approved by hospital ethics committees. All treatments and inspections had informed consent of the patients or their families.

Research Methods

Mechanical Ventilation Mode and Parameter Setting: Using midazolam and/or propofol gave patients sedation. Breathing machine (PB840) of Nellcor Puritan Bennett (America) was used in invasive mechanical ventilation, Assist/Control mode, VT: 6~8ml/ Kg, keeping breathing frequency: PaCO2 =35~45mmHg. From right subclavian or jugular vein into central venous catheters, imbedding arterial puncture tube from radial artery puncture, all connecting Intellivue MP60 monitor (Phillips, Germany) monitoring HR, ABP, CVP, ECG and SpO2 . Initial setting PEEP=0, recording PIP and Pmean; ultrasonic measured and recorded each index in the meantime. Then fluid responsiveness test was conducted, after which each index was recorded again. Hereafter PEEP was increased to 5, 10, 15 cmH2 O respectively for 5min, then PIP and Pmean were recorded again, with each indexes being measured and recorded by ultrasound. During the above steps, test would be stopped if the indexes showed Pmean>35mmHg or PIP> 45mmHg.

Ultrasonic Testing and PPV Monitoring Method: In complete mechanical ventilation control mode, below indexes were measured by M-Turbo bedside portable ultrasonic apparatus of SonoSite (America): ①CO (cardiac output) ②measuring SV and recording SVV %=(SVmax﹣Svmin)/SVmean, SVmax and SVmin being the mean value of 4 values in 30s, SVmean being the mean value of 
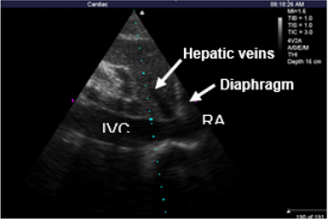
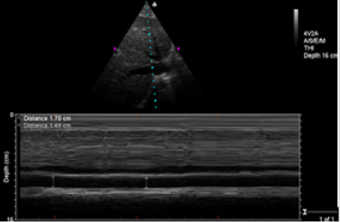
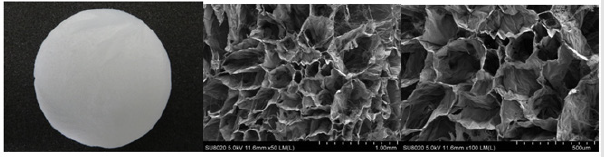
all values. ③Measurements of IVCdmax , IVCdmin and dIVC were performed from long-axis 2-dimensional subxiphoid views using M mode (Figure1), All measurements were made within 2 cm of the RA origin of the IVC(Figure2), dIVC= (IVCdmax − IVCdmin)/0.5(IVCdmax + IVCdmin) [13]. Ultrasonic testing were respectively conducted by an experienced ultrasound diagnostics doctor and a trained ICU doctor. Each observation indicator was took the average after being measured three times. During mechanical ventilation, the arterial pressure waveform was drawn from invasive arterial pressure monitor, recording PPmax and PPmin, PPV(%)=( PPmax-PPmin) /[(PPmax+PPmin)/2]×100%[20].

Figure 1: The IVC diameter can be measured at 1 to 2 cm caudal to the hepatic vein–IVC junction.

Figure 2: Respiratory variations in IVC.

The Positive Criteria of Volume Expansion Test: After intravenous drip 500ml normal saline (NS) in 20min, Patients were classified as responders to fluid loading if their CO increased under TTE by at least 15%[4]. The test would be stopped if patients had overload clinical manifestations (shortness of breath obviously, lung moist rale increasing or aggravated myocardial ischemia indicated by electrocardiogram).

Main Outcome Measures: ①The threshold value, sensitivity and specificity of PPV, SVV, IVCdmax and dIVC to predict fluid responsiveness in ventilated critically ill patients; ②The effects of increasing PEEP on indexes of Pmean, PIP, CO, CVP, PPV, SVV, IVCdmax and dIVC during ventilation in fluid responsiveness positive and negative groups separately.

Statistic: By SPSS 17.0, Measurement data being recorded in ( ±s), pair T test, independent-samples T test; Receiver operator characteristic curve (ROC) was be used in analyzing the value of SVV, PPV, IVCdmax and dIVC predicting fluid responsiveness showed by area under the curve (AUC) (95%CI); Kappa consistency check the consistency of SVV, PPV and dIVC predicting fluid responsiveness; Between-Subjects factors were compared by variance analysis and linear trend test; pairwise comparison was conducted by dunnet-t; variable correlation was analyzed by spearman correlation analysis; P<0.05 was regarded as statistical significance.

Results

Basic Information

In the 42 Volume Expansion Tests, 2 Cases were Stopped because of Volume Overload: As a result, 22 of the finally volume load tests were positive and 18 were negative. With PEEP increasing, pneumothorax and other complications didn’t happen. There were no statistically differences of PIP, Pmean, CVP, SVV, PPV, IVCdmax and dIVC between before and after volume expansion tests. 
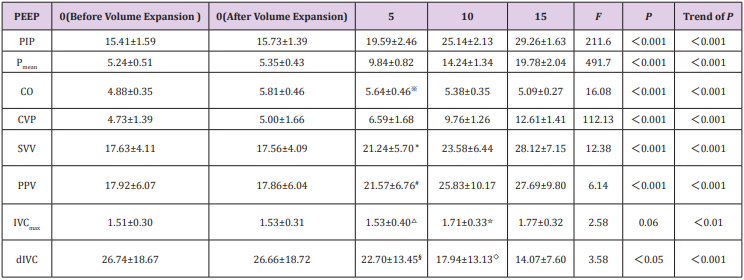
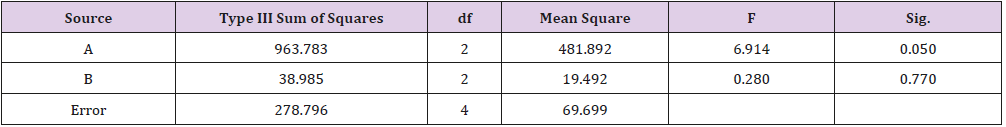
However, CO increased significantly (P=0.00). With different PEEP, TTE indexes of positive group and negative group were showed in Table 1 and Table 2.

Table 1: TTE indicators of different PEEP in fluid responsiveness positive group.

Note:1. Comparison between before volume expansion test and after:PIP(P=0.48)、Pmean(P=0.44)、、CO(P=0.00) 、CVP(P=0.56)、SVV(P=0.96)、PPV(P=0.97)、IVCdmax(P=0.83)、dIVC(P=0.99); 2. Comparison with PEEP0 cmH2 O(after volume expansion test):※:P=0.29;*:P=0.11;﹟: P=0.33; △:P=0.63;☆ :P=0.14;§: P=0.66;◇: P=0.10;all of others :P<0.05.

Table 2: TTE indicators of different PEEP in fluid responsiveness negative group.

Note:1. Comparison between before volume expansion test and after::PIP(P=0.41)、Pmean (P=0.74)、CO(P=0.00) ;CVP(P=0.09);SVV(P=0.98);PPV(P=0.98);IVCdmax(P=0.80)、dIVC(P=0.98); 2. Comparison with PEEP0 cmH2 O(volume expansion test):※:P=0.03;*:P=0.00;﹟: P=0.00; △:P=0.00;☆:P=0.00 ;§: P=0.01;all of others :P<0.05.

F

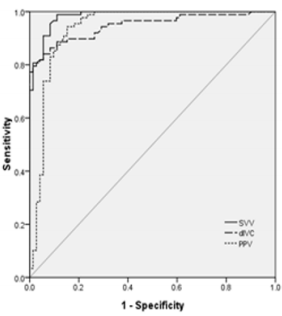
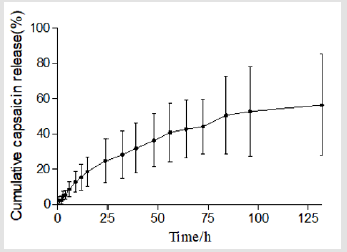
SVV, PPV, IVCdmax and dIVC Predicting Fluid Responsiveness Analyzed by ROC Curve: The area under ROC curve (AUC) for PPV predicting fluid responsiveness was 0.94 (95%CI: 0.89~0.98, P<0.001). The PPV threshold value of 13.5% before volume expansion had the sensitivity of 94.3% and the specificity was 84.7 % for prediction of fluid responsiveness. The AUC for SVV predicting fluid responsiveness was 0.98 (95%CI: 0.97~1.00, P<0.001). The SVV threshold value of 13.2% before volume expansion had the sensitivity of 98.9% and specificity of 88.9% for prediction of fluid responsiveness. The AUC for dIVC predicting fluid responsiveness was 0.95(95%CI: 0.91~0.98,P<0.001). The dIVC threshold value of 12.40% before volume expansion had the sensitivity of 80.7% and specificity of 98.6% for prediction of fluid responsiveness. 
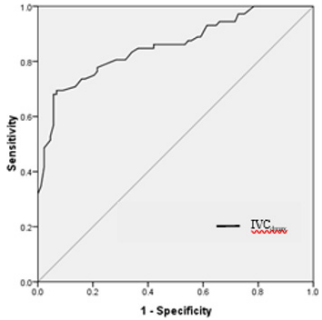
(Figure 3). The AUC for IVCdmax predicting fluid responsiveness was 0.85(95%CI: 0.79~0.91,P<0.001), the IVCdmax threshold value of 2.03 before volume expansion had the sensitivity of 68.1% and specificity of 94. 3% for prediction of fluid responsiveness (Figure 4).

Figure 3: ROC curve of SVV, dIVC, PPV predicting fluid responsiveness.

Figure 4: ROC curve of IVCdmax predicting fluid responsiveness.

Kappa Test Consistency Analysis of SVV, PPV and dIVC Predicting Fluid Responsiveness: According to ROC results, taking SVV > 13.2, PPV>13.5 and dIVC>12.4 as the cutoff value of fluid responsiveness to consistently analyze the results, showing that the Kappa coefficient of SVV and PPV was 0.729,P<0.001; The Kappa coefficient of SVV and dIVC was 0.607, P<0.001; The Kappa coefficient of PPV and dIVC was 0.607, P<0.001.

The influence of PEEP on airway pressure and TTE indices

a) In fluid responsiveness positive group, with PEEP increasing, there are overall differences among groups about PIP, Pmean, CVP, CO, SVV, PPV and dIVC (P<0.05). IVCdmax increased with PEEP, there are no significant differences in comparison among groups (P>0.05), while there are significant differences in linear trend (P<0.01). After pairwise comparison between PEEP5 , PEEP10, PEEP15 and PEEP0 (after volume expansion test, the following are the same) respectively by Dunnet-t, there were significant differences of IVCdmax and dIVC between PEEP15 and PEEP0 , while there were significant differences of CO, SVV and PPV between PEEP10, 15 and PEEP0 . There were significant differences of CVP between PEEP5 , 10, 15 and PEEP0 (Table 1).

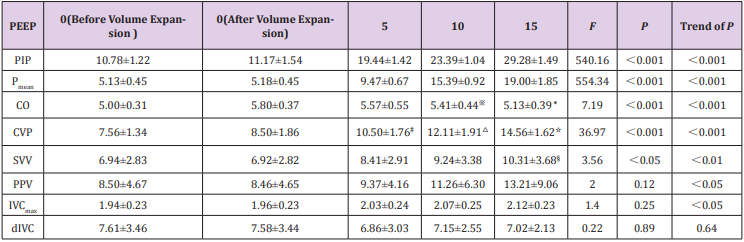
b) In fluid responsiveness negative group, with PEEP increasing, there are overall differences among groups about PIP, Pmean, CVP, CO and SVV(P<0.05). PPV and IVCdmax increased with PEEP, there are no significant differences in comparison among groups (P>0.05), while there are no significant differences linear trend (P<0.05). dIVC increased with PEEP, there are no significant differences in comparison among groups and linear trend (P>0.05). After between PEEP5 , PEEP10, PEEP15 and PEEP0 respectively by Dunnet-t, there were no significant differences between PEEP5 , 10, 15 and PEEP0 respectively about IVCdmax, dIVC and PPV; there were significant differences between PEEP15 and PEEP0 about SVV. There were significant differences between of PEEP10, 15 and PEEP0 respectively about CO. There were significant differences between PEEP5 , 10, 15 and PEEP0 respectively about CVP (Table 2).

c) Spearman Variable Correlation Analysis: In fluid responsiveness positive group, There are positive correlation between the SVV(r=0.58,P=0.000), PPV(r=0.50,P=0.000 ), IVCdmax(r=0.35,P=0.001)and PEEP respectively. There are negative correlation between the CO(r=-0.60,P=0.000 ), dIVC(r=-0.59,P=0.000)and PEEP respectively. In fluid responsiveness negative group, there are positive correlation between the SVV(r=0.35,P=0.003)、PPV(r=0.40,P=0.000 ), IVCmax (r=0.28,P=0.019)and PEEP respectively. There are negative correlation between the CO and PEEP(r=-0.54,P=0.000 ); it had no correlation between dIVC and PEEP (r=-0.04 ,P=0.771).

Discussion

The Value of SVV, PPV, dIVC and IVCdmax Evaluating Fluid Responsiveness

Using three dynamic indicators (SVV, PPV and dIVC) in our study, we selected 13.2%, 13.5% and 12.4% as cut-off values respectively to evaluate fluid responsiveness. They all have sensibility and specificity. Kappa consistency test analysis suggested that the results had consistency. When positive pressure ventilation patients are in inspiratory phase, many factors lead to the increase of SV and PV, including transpulmonary pressure increase compresses the pulmonary vasculature, left ventricular preload increase and pleural pressure increase., aortic vascular transmural pressure decrease, left ventricular afterload decrease, right atrial filling decrease, ventricular septal shift right inducing left ventricular filling increase, while the right ventricular RV pressure decrease reducing the pericardium, left ventricular to pulmonary venous factors venous return. Whereas exhale opposite [21]. Therefore, the sensitivity of the two indicators is very high, reaching 98.9% and 94.3% respectively. Researches by the Feissel [13] have indicated that the sensitivity and specificity are 93% and 92% respectively when 12% as a cut-off value to predict the volume responsiveness.

It is similar to the results of this study. The sensitivity of dIVC is 80.7%, lower than the other two. Considering that IVC locates in the abdominal cavity, the diameter of the respiratory variability is not only affected by the heart-lung interaction, but also relevant to the venous external pressure produced by the movement of diaphragmatic with the respiratory changes of thoracic abdominal cavity and right atrial pressure (RAP) gradient. Nevertheless, the sensitivity of dIVC is still much lower than previous report (93%) [13]. It considers that many patients after abdominal operation in this group influence the measurement of IVC by TTE. IVCdmax is a static volume indicator. When positive pressure ventilation patients are in inspiratory phase, the diaphragm decrease, intraabdominal pressure increase, RAP gradient increase, the inferior vena cava filling and the effect is largest to end inspiration [22]. The ROC curve analysis results by TTE to measure IVCdmax to evaluate capacity responsiveness in this study show that using IVCdmax 2.03 as the threshold value before fluid load to predict the sensiti fluid responsiveness is 68.1%, the specificity is 94.3%.

By comparing IVC diameter, CVP [4,11,23] and RAP [12] through the TTE, previous research considers that it has a good correlation between them. This study also suggests that although IVCdmax is a static volume indicator, it still shows the value of better prediction of fluid responsiveness to a certain degree. This may be related to these reasons such as there are mostly surgical patients in this group, the average age is less than 50 years, previous heart-lung function better, less complication, less factors effect on static volume indicator. But the area under ROC curve of IVCdmax is significantly lower than SVV, PPV and dIVC, suggesting that the value of dynamic volume indicator is better than the static volume indicator.

The Effect of PIP, Pmean, CO and CVP on PEEP

The optimal PEEP can dilate small airway throughout the respiratory cycle and maintain the end expiratory alveolar open, increase functional residual capacity (FRC), improve the chest wall compliance, reduce the elasticity resistance of respiratory system. The setting of PEEP increases transpulmonary pressure and pleural cavity pressure, thereby increasing the airway pressure when positive pressure ventilation. This study finds that the values of PIP and Pmean in all patients of the volume expansion test (+) and (-) group significantly rise with the increase of PEEP, P value and P value trend are both less than 0.001 between groups. This result indirectly suggests that high PEEP setting may lead to excessive overexpansion of the lungs and produce lung injury. With the increase of PEEP, CO of both groups decreases. This is also related to the decline of cavity venous return induced by intrathoracic pressure increase caused by PEEP, the reduction of right ventricular preload, eventually the decline of left ventricular stroke volume. But there are no statistical differences comparing PEEP5 and PEEP0 of CO in two groups, suggesting that the body can play a compensatory function to a certain extent to offset the adverse effects on the circulation after a slight increase in PEEP. As a traditional volume evaluation indicator, CVP has extensive application in clinic. But as a static pressure marker, it is influenced by cardiac function of patients, compliance of thorax and many other factors. The changes of pleural pressure that caused by PEEP becomes the important factor of the pressure changes of the superior venous located at thorax. The data also indicates when PEEP reaches 5 cmH2 O, volume expansion test (+) and (-) group show statistical difference comparing with PEEP0 .

The Effect of PEEP on SVV, PPV, dIVC and IVCdmax of Volume Expansion Test (+) Group

This research discuses that the effect of PEEP on the dynamic capacity indicators such as SVV, PPV and dIVC in volume expansion test (+) and (-) group. The results show when PEEP reaches 10 cmH2 O, SVV and PPV both have statistical differences comparing with PEEP0 in volume expansion test (+) group. However, dIVC shows statistical difference comparing with PEEP0 when PEEP reaches 15 cmH2 O, suggesting that dIVC is slight affected by PEEP in a certain range. This is consistent with the result of the high specificity of evaluation capacity reaction of dIVC as stated above. Spearman variate relativity analysis shows that SVV and PPV are positive correlation with PEEP, as confirmed by previous researchers [24]. In positive pressure ventilation patients on the basis of LVSV increase with inspiratory phase, PEEP may make the lung expansion and left ventricle extrusion, and further intensify SV of the inspiratory phase. However, PEEP increases intrathoracic pressure, leads to further decrease LVSV with expiratory phase, and make SVV and PPV increase. With the increase of PEEP, intraabdominal pressure further increases, and RAP gradient increases [25]. This study shows that IVCdmax gradually increases in the volume expansion test (+) group and P value between groups is less than 0.01. The IVCdmax values of PEEP15 and PEEP0 have statistical differences.

This result is consistent with the research by Schefold [23]. With the increase of PEEP, dIVC of the volume expansion test (+) group gradually decreases, P value between groups is less than 0.05, and the trend of P value is less than 0.001. The dIVC values of PEEP15 and PEEP0 have statistical differences. Spearman variate relativity analysis shows that dIVC is negative correlation with PEEP. The reason of above results may be that the setting of PEEP leads to IVC diameter increases in end inspiration, IVC diameter increases in end expiration and increases more than end inspiration, thus make dIVC decrease. Kircher [26] thinks that collapsibility index less than 50% is effective indicator to evaluate right atrium more than 10 mmHg, using inferior vena cava collapsibility index (IVCCI) to evaluate right atrium pressure of autonomous respiration patients. It also suggests that higher right atrium pressure, less breath variety of IVC. The animal model test of Duperret S1 [27] demonstrates that abdominal cavity pressure increasing leads to breath variety of IVC decrease, especially hypovolemia. These results indirectly verify our conclusion.

The effect of PEEP on SVV, PPV, dIVC and IVCdmax of Volume Expansion Test (-) Group

In volume expansion test (-) group, SVV and PPV are positive correlation with PEEP increase. SVV shows statistical difference comparing with PEEP0 when PEEP reaches 15 cmH2 O. With the increase of PEEP, the trend of P value of IVCdmax is less than 0.001. But there are no statistical differences between increase groups and PEEP0 . P value the trend of P value of dIVC between groups is more than 0.05. Spearman variate relativity analysis shows that PEEP has no correlation with dIVC. The research about SVV by Michard et al. [19] reports that the positive correlation between PEEP and SVV is related to preload state. Our study about volume expansion test (+) and (-) group comparison indicates that the effect of PEEP on dynamic capacity responsiveness evaluation indicator is related to the location at starling curve of patients. This effect is more significant when locating on the steep rather than on the flat portion of the Frank-Starling curve. In the condition of full preload, the self-regulating mechanism of patients work, dynamic capacity responsiveness evaluation indicator is less influenced by PEEP.

This study selects various cases including many related diseases and the different pathophysiological states may affect the results. For example, although the IAP > 16 cmH2O intraabdominal hypertension patients have been ruled out in this group, but some patients experienced abdominal operation, abdominal wall compliance decrease causing by abdominal postoperative may influence the results of this study [28]. The effect of PEEP settings on respiratory mechanics in patients not only reflects on the changes of the intrathoracic pressure and transpulmonary pressure, but also the increase functional residual capacity and/ or a decrease pulmonary vasoconstriction induced by hypoxia to change the heart load [19]. Thus, it has an impact on the dynamic volume responsiveness evaluation. This study is according to the classic volume load test standard [4], using 500 ml saline to carry out volume load test (+). Although there are no significant differences between parameters of the (+) groups before and after the load test, but it cannot avoid the interference of observing PEEP influence caused by preload increase. These need to design more strict animal experiments and clinical studies in the future to further elucidate the internal relationship.

Acknowledgement

This work was supported by the Scientific and technological project of Anhui Province (Grant No. 1301042206). Anhui Provincial Natural Science Foundation (Grant No. 1508085QC49), and the doctoral research fund project of the Second Affiliated Hospital of Anhui Medical University (Grant No.2014BKJ034).

For more Articles: https://biomedres01.blogspot.com/


Preparation and Characterization of Capsaicin-Collagen Sponge


Preparation and Characterization of Capsaicin-Collagen Sponge 

Introduction

The ideal objective for wound therapy is to accelerate the healing process while also preventing scarring. The use of collagen matrices in wound healing has been discussed widely in the literature because of the collagen`s natural properties. Collagen is a constituent of connective tissue and a major structural protein of any organs [1]. From inducing clotting to forming the natural tissue matrix, collagen’s biodegradable properties play a vital role in the natural wound healing process. Collagen stimulates formation of fibroblasts and accelerates the migration of endothelial cells upon contact with damaged tissue [2]. Collagen sponges have the ability to absorb the excessive exudates, keeping the wound bed dry while maintaining moderate moisture [3]. These characteristics make collagen attractive in the field of wound healing.

Capsaicin (trans-8-methy-N-vanillyl-6-nonenamide) is a very interesting chemical which has been widely used in clinics to relieve a variety of painful conditions [4-6]. Emerging studies have shown that capsaicin displays potent anti-tumor activity by inducing robust apoptosis in multiple types of human cancer cells and that attracts much attention [6-8]. Liu and Zhou,et al. reported capsaicin showed special preventing and curing effects on hypertrophic scars by inhibiting the proliferation of fibroblasts and collagen synthesis, and by exhausting neuropeptides SP [9-12]. However, capsaicin`s preventive effects on hypertrophic scars have been almost neglected and sparsely reported in literature to date. Hypertrophic scars are a kind of skin fibrosis and characterized by abnormally high rates of collagen production and deposition and increase in levels of extracellular matrix components [13]. There are great benefits when using capsaicin in wound healing. However, the burning sensation side effect of capsaicin must be alleviated when considering clinical application. Hayman`s studies have shown that compared to placebo, 54% patients using capsaicin had a skin burning sensation [14]. Generally, the side-effect prolife of capsaicin formulation was much milder than free capsaicin [6].

Considering the natural characteristics of collagen and capsaicin, collagen sponge was designed to be the carrier for capsaicin. It was hoped the use of polymers as controlled release dressings could provide an excellent means of delivering drugs to wound sites in a consistent and sustained fashion over long periods of time without the need for frequent dressing change. In this study, orthogonal design methodology was used to optimize the formulation component according to porosity, water uptake, and drug release in vitro as the indicators. After the validation tests were completed, the sponge scaffold’s three-dimensional structure was observed by SEM. Porosity, water uptake, and degradation of collagen sponge were carefully studied in vivo and in vitro.

Material and Methods

Material

Collagen was isolated from fresh bovine tendon, which was collected from Yuanling Supermarket (Dongguan, china, batch no: 20140411). Capsaicin was purchased from Wuhan Hengshuo Technology Development Co. Ltd. (Wuhan, Hubei, People’s Republic of China). Pepsin (1:10000) was purchased from Sigma. L-Hydroxyproline was purchased from the institution for the control of pharmaceutical and biological products of China (batch no: 111578-200201). Collagenase type I was purchased from MP Biomedical, LLC (Cat NO: 195109, Lot NO: M4197). All other reagents were of high performance liquid chromatography (HPLC) or analytical grade and used as received. Animal experiments were carried out according to the approved protocol by the Experimental Animal Committee of Guangdong Medical University, Guangdong, China.

Preparation of Capsaicin-Collagen Sponge and Collagen Sponge

Capsaicin-collagen sponge and collagen sponge was prepared according to the literature with a little amendment[15,16]. Briefly, residual proteins on the surface of the fresh bovine tendon were firstly removed in 10% NaCl solutions and the tendon was cleaned three times with distilled water. Then the tendon was treated with 0.5M acetic acid solution (containing 0.08% (w/v) pepsin) for 72h under magnetic stirring in cold room (4℃), the insoluble parts were filtered out. Afterwards, 0.9M NaCl was added to the solution and kept undisturbed for 24h at 4℃ to salt out the collagen from the supernatant. The next day the suspension was centrifuged at 8000 rpm for 5 minutes at 4℃ and the precipitate was re-solubilized in 0.5M acetic acid. The final content was then dialyzed against 0.1M acetic acid and distilled water respectively for 24 h. According to the orthogonal experimental design (Table 1), capsaicin was dissolved in ethanol. The capsaicin ethanol solution and glycerin were added respectively into the collagen solution and then vortex-mixed to achieve a homogeneous state. Then the samples were later freezedried (FD-1-50 Vacuum freeze-drying machine, Beijing Boyikang Experimental Instrument Co., Ltd.).

Table 1: The orthogonal experiment design and results.

Porosity Measurement

Collagen sponge samples (size: 2cm×2cm, weight: Ws) were put into Eppendorf Tube P with a volume of 10ml ethanol (Tube together with ethanol was weighed as W1) and sonicated for 30 minutes. After that, the samples were withdrawn from the tube and weighed (W2), the residual ethanol with tube was precisely weighed (W3). The porosity of the collagen sponge samples was calculated using the following formula:

Each experiment was repeated at least three times and the values are given as mean ± standard deviation.

Water Uptake Study

Each of the collagen sponge samples (size: 2cm×2cm, weight: W0 ) were immersed into 20 ml of phosphate buffer solution (PBS; pH=7.4). After soaking in PBS solution at 37℃ for 24 h, the samples were withdrawn from the PBS solution. The surplus surface water was removed using filter paper and weighed (W24). The percentage of water uptake was calculated by following formula:

Where W24 is the weight of sample after soaking for 24 h and W0 is the original weight before the test. The values are given as mean ± standard deviation (n=6).

Drug Release Test

Capsaicin-collagen sponges were transposed to a 15 ml tube with screw caps in which 10 ml isotonic PBS was filled and the temperature was kept at 37℃. The solutions were stirred with magnetic stirring bars. Aliquots of 1 ml were taken periodically and replaced with the same volume of PBS to maintain a constant volume. The samples were centrifuged for 10 minutes at a speed of 5000rpm (TGL20MWDesktop high-speed refrigerated centrifuge Hunan Hersey instrument equipment co., LTD) and the concentration of the released capsaicin in the supernatant was determined by measuring the absorbance at 280nm by a spectrophotometer (UV-6000 Ultraviolet-visible spectrophotometer, Shanghai yuanxi instrument co., LTD) on the basis of the standard curve. The mechanism of capsaicin release from the collagen sponge was determined by fitting the release rate data into the different mathematical models of Higuchi, First order, Zero order, Weibull, Hixson-Crowell, Ritger-Peppas and Neibergull equations (Tables 6).

Table 2: Analysis of variance for porosity.

Table 3: Analysis of variance for water uptake.

Table 4: Analysis of variance for drug release.

Table 5: The verified results of the optimized capsaicin-collagen sponge.

Table 6: Fitting of drug release data according to various equations.

Note: Q: Cumulative capsaicin released from collagen sponge (%). t:time (h).

In vitro Degradation Test

In vitro degradation tests were done according to the literatures [1,17]. Briefly, 2cm×2cm sponge samples were immersed in phosphate buffered saline (PBS, pH 7.4) containing 0.2 mg/ml collagenase type I. At a predetermined time point (24h, 48h), the supernatant fraction after centrifugation was hydrolyzed with 6 M HCl at 150℃ for 0.5 h. The content of hydroxyproline was measured with UV-vis spectrophotometer .The biodegradation degree of the scaffold is judged by the released hydroxyproline.

In vivo Degradation Test

Rats were anesthetized by intraperitoneal administration of chloral hydrate (0.3ml/100g body weight) and received a fullthickness incision of the skin on the back. Sponges were implanted under the skin through the incision, and then the incision was closed with sutures. To evaluate the biodegradation rate of sponges, rats were euthanized at intervals from 1 to 5 weeks by an overdose of chloral hydrate. The implanted sponges were carefully resected and washed in PBS, then the withdrawn sponges were digested with 0.2 mg/ml collagenase type I for 2h to remove fibrous tissue attached to the sponge. After that the sponge was cleaned with distilled water and vacuum dried for 24h before analysis. The sponge’s degradation degree was determined by the change of weight after degradation. The degradation rate (%, w/w) was determined by using the following formula:

Where Wt is the weight of sample at predetermined time t and W0 is the original weight before the test. The values are given as mean±standard deviation (n=3).

Scanning Electron Microscopy (SEM) Observation

Macroscopic images of the collagen sponge were taken by a digital camera (Canon, EOS 600D). The collagen sponges’ cross sections were observed by a scanning electron microscopy (SU8020,Hitachi cold field emission scanning electron microscope,Japan). The samples’ cross-sections were obtained by treating the membrane with liquid nitrogen. All of the samples were sputtered with gold before SEM observation.

Statistical Analysis

Results are reported as means ± SD. Univariate analysis of variance was estimated by using SPSS software version 15.0 and the observed differences were statistically significant when P < 0.05.

Result and Discussion

Results and Analysis of Optimal Conditions for the Preparation of Sponge

It is well known drug release kinetics can be influenced by the matrix characteristics (porosity, density) or by its degradation rate [18]. As a moisture-retaining plasticizer, glycerin can improve the material’s characteristics to make it usable as an aqueous sustainedrelease material for drugs [19]. Glycerin was also documented as being used as an anti-irritant for certain concentrations of capsaicin (0.025%) to alleviate pain [20]. That is also the main reason why the glycerin was one of the compositions in the formulation.

As shown in Table 1, glycerin concentrations had more influence than capsaicin concentrations on sponge characteristics (porosity, water uptake, drug release). The variance analysis (Tables 2 & 3) confirms the result. The difference is significant as shown in Table 2 and Table 4 (p<0.05). The concentration of glycerin is a main factor while preparing sponges. As glycerin concentration increases, the porosity and water uptake of the sponge increases as well. Interestingly, the capsaicin release from the sponge also increases.

An ideal scaffold for skin tissue engineering should possess excellent biocompatibility, suitable microstructure such as 50~150 μm mean pore size, porosity above 90%, and suitable mechanical property [21,22]. Based on the results of porosity and water uptake, concentrations of 5% glycerin and 0.05% capsaicin were selected to prepare the collagen sponge.

Optimization and Validation

Three batch samples (0.05% capsaicin, 5% glycerin) were prepared according to the item 2.2. The scaffolds properties were characterized by porosity, water uptake, drug release, and degradation test in vitro and in vivo according to the above description.

Porous Structure Detection

The porosity of the optimized scaffolds (0.05% capsaicin, 5% glycerin) was (114.46%±0.13), which is greater than 90%. In soft tissue engineering, scaffold materials should have a porous nature for nutrient and gas exchange: which benefits cell proliferation and tissue growth [23]. Similar results were reported by T Muthukumar [24]. In the early stage of wound healing, the nutrient that cells need will entirely depend on tissue fluids surrounding the wound. The ability of the scaffold to absorb water is one of the most important factors in determining the biological activity of a dermal equivalent [1]. Sara Mohajeri et al. [25] demonstrated when collagen sponges were incorporated with PP/PET fiber, the water uptake value between 800% and 2000% was conducive to the proliferation and differentiation of mesenchymal stem cells. Yang et al. [26] reported that chitosan scaffold made from chitosan/dibasic sodium phosphate solution had a water adsorption ranging from 850% to 1650%, which was much greater than the porous membrane.

The optimized preparation’s water uptakes were detected as 1355.48%, 1422.08%, and 1546.07%. The mean of water uptake (1396%±0.97, Table 5) is higher than 1000% which is qualified to the requirement of the scaffolds. In addition, the hydrophilic properties of glycerine are beneficial to enhance the water uptake of sponge scaffolds. During the complex wound healing process,there are always excessive production of exudates. These exudates can inhibit wound healing because of higher levels of tissue destructive proteinase enzymes and therefore more corrosive [27]. A key characteristic of wound dressings is the removal of excess exudate while maintaining moisture at the wound bed [3]. More porous collagen sponges may provide a potential advantage to wound tissue by the adsorption of ample exudates [27] Table 5.

The porosity and water uptake characteristics showed that capsaicin-collagen sponges had a porous structure. In fact, the porous structures of the scaffolds were also demonstrated by SEM observation (Figure 1).

Figure 1: Macroscopic shape of scaffolds (a) and the SEM image from the cross-section (b,c).

Figure 1(A) shows the sponge was white and soft. Many dense, little uniform pores are clearly observed under the SEM, pore size was between 60~200 μm by Image Pro Plus 6.0 software. Highly porous three-dimensional structure is conducive to the rapid absorption of tissue exudates, rapid hemostasis, and promotes wound repair [29]. Pore sizes between 50 μm and 150 μm are found to be optimal for improved extracellular matrix production [22]. The porous nature of the collagen sponge helps in absorbing wound fluids, keeping the wound dry, and also helps supply oxygen to the wound [30].

In Vitro Release Study

Figure 2 plots the percentage of capsaicin released as a function of time from the collage sponges. After 132 h, around 56% of capsaicin was released from the sponge. It was shown that collagen sponges could provide a sustained release system for capsaicin. Table 6 summarizes the results of fitting the release data for sponges. A linear relationship was found between capsaicin release and the square root of time (R2>0.99) and indicated that the release is under diffusion control following Higuchi’s equation, namely the capsaicin release was under diffusion control [31].

Figure 2: The cumulative capsaicin released from collagen sponge versus time (n=3).

The empirical Ritger-Peppas equation was widely used to explain the drug release mechanism [32-35] (the meaning of k is shown in Table 7). A value of 0.45 for k indicates Fickian diffusion, which is when the drug is released by the molecular diffusion through the system. A value between 0.45 and 0.89 for k is indicative of anomalous transport in which Fickian transport and matrix relaxation occur simultaneously.

Table 7: Explanation of k value for drug release mechanism.

The diffusion exponent (k=0.7138) calculated by the Riger- Peppas Equation is greater than 0.5 (Table 6) which indicates the release mechanism for collagen sponges is anomalous transport, and that the release of capsaicin in the collagen sponge is under non-Fick’s diffusion. Capsaicin release was dependent on two simultaneous processes, the capsaicin diffusion through the system and the matrix swelling occurring at the same time. The release mechanism from sponges is similar to the drug delivery systems of the cubic phase gels and cubosomes [36,37]. On the contrary to the tortuosity of the water channels of the cubic phases, sponge matrix swelling increased the diffusion rate of capsaicin. Our previous study showed that approximately 34% of the capsaicin was released after 108 h from the cubic phase [36], which is much slower than that from sponges (96h, 51.79%; 132h, 56% ). The difference attributes to the water uptake and swelling ability of the matrix. The mean of water uptake (1396%) of sponges is much better than that of the cubic phases (approximately 14~33 %) [38]. The huge water uptake and swelling ability provides more chances for capsaicin to diffuse from the sponge layers, resulting in faster release.

In vitro and in vivo Degradation Test

The degradation properties of a scaffold are of crucial importance in the long-term success of a tissue-engineered cell–scaffold construction. The rate of degradation may affect many cellular processes including cell growth, tissue regeneration, and host response [39]. Too fast or too slow degradation of collagen affects the healing of a wound.

In vitro degradation is usually simulated by incubation with bacterial collagenase, cathepsin, pepsin, or trypsin. Hydroxyproline as a specific amino acid being relatively constant in the proportion of collagen [29], was used as a marker for collagen metabolism [40]. Therefore, the change of hydroxyproline concentration reflects the degradation of the collagen sponge. At 24, 48 h, testing samples degraded 21.96% and 58.13% respectively.

In vitro degradation characteristics are an important index for the scaffold. However, positive correlation between in vitro and in vivo degradation rates is hard to achieve [41-43]. During the process of wound healing, absorption of exogenous collagen in vivo is a complex multi-enzyme process where deposition of newly formed collagen and remodeling of connective tissue has to be considered [44-46]. Hence, the biocompatibility and biodegradability of the scaffolds was evaluated in vivo. Table 8 showed the degradation of sponges implanted subcutaneously in vivo. As time elapsed, the weight of the reserved scaffolds in rat decreased gradually. Five weeks later, the sponges degraded eventually. Figure 3 shows the changes of the scaffolds implanted in rats at different time. By visual observation at the first week, the sponge adhered closely to the subcutaneous tissue but could be peeled off easily.

Table 8: The degradation of sponges in rats.

Figure 3: The degradation of capsaicin-collagen sponge at different weeks.

Two weeks later, the scaffold became smaller and adhered tighter to the tissue. On the fourth week, the sponge turned into small clumps, linked to the subcutaneous tissue closely, and was difficult to peel off. After five weeks the sponge had degraded completely and integrated fully with the subcutaneous tissue: no necrotic tissue and inflammatory reaction around the implant sitewas detected. During the periods of subcutaneous implantation of sponges, no abnormal activities were observed for the SD rats. The data above indicates that sponges have good biocompatibility and are safe.

Conclusion

The prepared capsaicin-collagen sponges with porous structures (porosity, 114.46%; water uptake, 1396%) had the potential to be beneficial in absorbing wound fluids, keeping the wound dry, and helping the oxygen supply to the wound region. Characteristics of the appropriate pore size (60~200μm) of the prepared scaffold could be conducive to the wound healing. The degradation test in vitro and in vivo demonstrated the scaffold could be completely biodegraded and absorbed by the rats which eradicates the risk of infection caused by removing the residue from the body. Drug release data indicated capsaicin release from the sponges was under diffusion control following Higuchi’s equation. By studying the Ritger-Peppas equation it was determined the release mechanism for collagen sponges is anomalous transport and that the release of capsaicin from the collagen sponge is under non-Fickian’s diffusion.

Capsaicin release was dependent on two simultaneous processes, the capsaicin diffusion through the system and the matrix swelling occuring at the same time, the huge water uptake and swelling ability provides the sustained and comparatively faster drug release for the capsaicin. The properties of high porosity, excellent water uptake ability, biodegradability, and sustained drug delivery system described above provides evidence that collagen sponge may be an ideal scaffold used for skin tissue engineering. Based on the innovative study, a patent was applied in China (no: ZL 201410760525.5). In the next stage, the rat skin excision model will be built and the in vivo regulation of capsaicin-collagen sponge on wound closure, angiogenesis, and collagen disposition will be evaluated in detail.

Conflict of Interests

The authors declare that they have no conflict of interests regarding the publication of this paper.

Authors’ Contribution

Xin-sheng Peng and Chun-lian Guo contributed equally to this work.

Acknowledgment

The authors gratefully acknowledge the financial support of Science & Technology Planning Project of Guangdong Province, China (No: 2015A020214020). Also, would like to give a special thanks to Alexander Van Fleet for editing.

 For more Articles : https://biomedres01.blogspot.com/


The Skin Aging Process and Anti-Aging Strategies

  The Skin Aging Process and Anti-Aging Strategies Introduction Appearances play a vital role in society as it is how one communicates to ot...