Consumer Attitude Regarding Food Labelling and
Perception of Healthier Choice Logo (HCL)
Food labelling is one of the means of communication between
the producer and seller of food on one hand, and the purchaser
and consumer on the other FAO/WHO, [1]. Many governments are
adopting such policy which has been identified as an important
tool in response to increasing incidence of obesity and chronic
non-communicable diseases (NCDs) WHO, [2]). Generally, nutrition
label falls into two categories, the back-of-package (BOP) and the
front-of-package (FOP) labels Mandle et al. [3]. BOP nutrition
label informs consumers of nutritional properties of a food. It
is a listing of the level of nutrients as declared as a table in one
section of a food label, commonly known as a nutrition information
panel or NIP FSQD [4]. FOP nutrition label is an addition to the
currently mandated NIP. During the Forty-Fourth Session of Codex
Committee on Food Labelling (CCFL) in 2017, FOP systems were
classified as interpretive and informative systems. Interpretive
systems (or summary indicator or criteria-based systems) include
symbols, icons, colour codes and graphic representations such
as Healthier Choice Logo (HCL), Multiple Traffic Lights (MTL) or health
star rating. Informative systems (nutrient- specific systems)
may include the Guideline Daily Amounts (GDA) or energy icon. In
this system, the nutrition information from the NIP is stated in a
more concise way without any interpretation. However, there is no
international guidelines on implementation of FOP system. While
the World Health Organization (WHO) is still developing guidance
for countries considering FOP labelling systems, and manufacturers
continued to develop variety of FOP systems, concerns were raised
about what a variety of systems might mean to consumers.
The availability of various FOP systems could also create
problems for export and trade and can lead to technical barriers to
trade FAO/WHO, [5]. FOP labelling has also been a prominent issue
in Asian Region. Thailand has announced mandatory GDA labels for
five snack categories as pioneers in 2011 before expansion to other
categories Rimpeekool et al. [6]. EUFIC [7] reported that Singapore
and Thailand have implemented the Healthier Choice Symbol,
while Philippines has opted for “Wise Eat” logo. In 2017, Healthier
Choice Logo was also launched in Brunei. In line with the strategy
of the National Plan of Action for Nutrition Malaysian (NPANM) III
(2016-2025) and the 65th World Health Assembly (WHA) 2012
resolution to promote healthy eating, Healthier Choices Logo (HCL)
was launched by the Ministry of Health Malaysia on 20th April
2017 Nutrition Division [8]. This initiative is part of the strategy to
assist consumers in adopting healthy dietary practices by making
wise food choices at the point of purchase, as well as to encourage
food industries to produce healthier food options to be available
in the market Nutrition Division [8]. National study to review the
proposal of using certain symbol or logo such as “healthier choice”
was carried out by Task Force Committee on Healthier Choice
under Ministry of Health in 2008. However, the findings of the study
of 1936 respondents from 15 states were not published elsewhere.
Recognizing the importance of this issue, this study can
provide evidence to national stakeholders and policymaker on the
consumer’s response towards the labelling system. Therefore, the
present study aimed to determine the consumer attitude regarding
food labelling and perception of HCL in Malaysia. It is hoped that
information gathered will be able to help relevant authorities to
strengthen consumer understanding of nutrition information
displayed on food labels.
Subjects
A total of 366 respondents aged 18-60 years old were recruited
using a convenient sampling method during state health activities
in Negeri Sembilan. In this survey, female respondents constituted
71% (n=260) of the sample study compared to male, 29.0%
(n=106). Majority were Malays (84%), followed by 7% Chinese, 6%
Indians and 3% other races (such as Kadazan, Bajau and Murut).
About 27% of the respondents were in the 18-24 years of age group,
25-34 years (15%), 35-44 years (29%), 45-54 years (19%) and 55-
60 years (10%). Almost half (48%) had achieved secondary level
of education and proportions completed primary school, diploma/
certificate, degree holders were 2%, 34% and 16% respectively.
However, such specific procedure in recruiting the subject to avoid
biasness as well as to represent the Malaysian population structure,
particularly in Negeri Sembilan, cannot be implemented due to
poor cooperation from the public as well as limitation of numerator.
Survey Instrument
The questionnaire was designed to be administered by
interview on a one-to-one basis or guided self-administered. To
establish the content validity, nine (9) experts in the areas of
food labelling, nutrition labelling and signposting were asked to
review the questionnaire. Each reviewer independently rated
the relevance of each section in the questionnaire using a 4-point
likert scale (1=not relevant, 2=quite relevant, 3=relevant, 4=very
relevant). The questionnaire was piloted in 24 subjects from the
community and improved for intended purpose and usefulness.
The average time taken to finish the questionnaire was about 20
minutes. Cronbach’s alpha was measured to examine the internal
consistency of the questionnaire. Items that gave an alpha of
at least 0.70 was acceptable for survey instrument used in the
study. The questionnaire consisted of a few main sections. These
sections included demography information, attitude towards food
labelling and perception of Healthier Choice Logo (HCL). Section on
demography information collected data on general characteristics
of the respondents including gender, race, age and education
level. Attitude towards food labelling and perception of HCL were
assessed using a 5-point likert scale. Only statements that meet
certain Cronbach’s alpha ()value were used in the study.
Ethical Approval
An appropriate ethical approval was obtained from the MOH
Research and Ethics Committee (MREC) (NMRR-16-1252-31661)
and institutional and registered at National Medical Research
Register (NMRR) prior to implementing the study. All the
information from the questionnaire was kept confidential. Any data
containing respondents’ personal information will not be disclosed
to protect the information privacy and confidentiality.
Data Analysis
The data collected was analysed using Statistical Package
for Social Sciences (SPSS) version 16.0. Descriptive and analytic
analysis were done accordingly.
Attitude towards Food Labelling
Attitude towards food labelling was assessed using a 5-point
likert scale. Those who answered “1” and “2” were categorized
as “not agree”, “3” as “not sure”, while “4” and “5” as “agree”. The
findings related to the attitude towards food labelling were
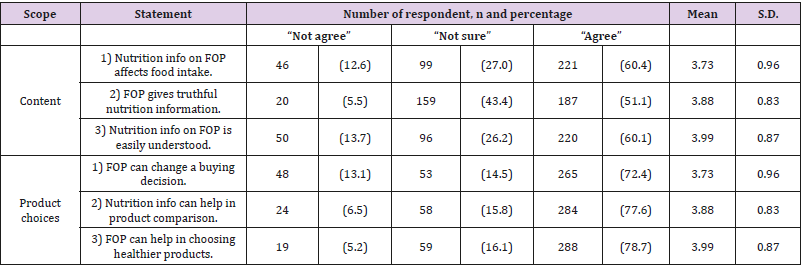
presented in Table 1. About 60% of the respondents agreed that
nutrition information on FOP can affect their food intake, gives
truthful nutrition information and nutritional content on FOP was
easily understood, 51% and 26% respectively. Related to choices of
products that could be affected by food label, respondents agreed
that FOP can change a buying decision, help them to compare
products when making choices and choosing healthier products
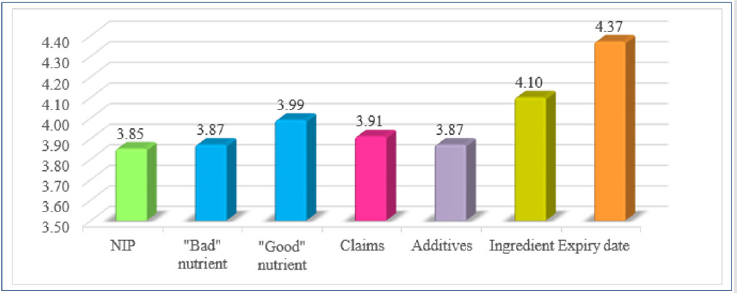
(72%, 78% and 79% respectively). Figure 1 showed the nutrition
information that the respondents read on food label when buying
food products. The mean for expiry date was found the highest (4.37 ±
0.70), followed by ingredient, “good” nutrient and nutrition
claims (4.10 ± 0.74, 3.99 ± 0.79 and 3.91 ± 0.77 respectively). The
lower means were nutrition information panel, “bad” nutrient and
food additives (3.85 ± 0.84, 3.87 ± 0.82 and 3.87 ± 0.84 respectively).
Perception of Healthier Choice Logo (HCL)
During this study, HCL initiative was not yet implement in
Malaysia. Respondents’ perception towards the Healthier Choice
Logo (HCL) on food label was assessed using a 5-point likert
scale. Those who answered “1” and “2” were categorized as “not
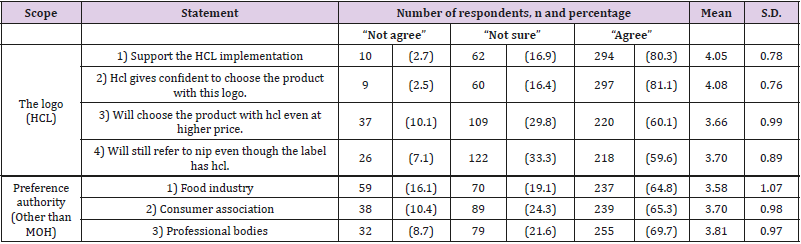
agree”, “3” as “not sure”, while “4” and “5” as “agree”. Table 2
showed that about 80% (n=294) of the respondent supported the
implementation of HCL and agreed that the use of the HCL would
increase one’s confidence in choosing food products (81%, n=297).
In this study, 60% (n=220) of the respondents choose to buy the
products that had the logo even if this initiative may cause price
increase on the food products. Even though the product may carry
HCL logo, 60% (n=218) would still refer to nutrition information
panel (NIP) on the label.
Table 2 also showed the authority preferred by the respondents
to certify products to be given HCL. Other than Ministry of Health,
70% (n=255) preferred professional bodies to be the authority
to certify HCL products. Other bodies that could become the
certification authorities were consumer association and food
manufacturer, 65.3% (n=239) and 64.8% (n=237) respectively.
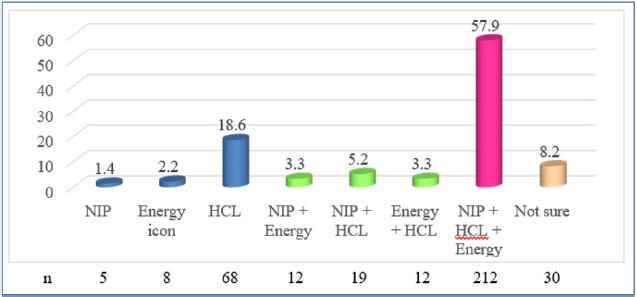
The possible initiatives preferred by the respondents to help
them in choosing food products were presented in Figure 2. It
was clear that combination of three labelling systems consisted
of nutrition information panel (NIP), Healthier Choice Logo (HCL)
and energy icon was most preferred by the respondents (57.9%,
n=212). The least preferred was declaration NIP alone, 1.4% (n=5).
Attitude towards Food Labelling
Generally, various studies from a wide range of countries on
nutrition labelling showed evidence that nutrition labelling is a
useful tool that provides nutrient information for consumer to make
informed food choices Hawkes et al. [9-12]. Nutrition label was also
reported to have impact on diets especially among those who read
the label Hawkes [9]; Coulson [13]. A study in Thailand also showed
that about 52% of consumers identified healthier food products by
using the information from the GDA labels Rimpeekool et al. [6].
Based on unpublished data from the Singapore Health Promotion
Board (HPB) in 2004, 69% of consumers had used Healthier Choice
Symbol to assist them in making healthier food options Soon et al.
[14].
Consistent with those findings, this study has shown that FOP
can change a buying decision and help them in comparing products
when making healthier products choices. Other studies related to
general use of nutrition labelling in Malaysia reported that, about
87% of consumers in Kelantan looked for nutrition label while
purchasing food products. They believed that food products which had
nutrition information on food label was quality products Zul
Arif & Mohamad Amizi, [15]. Norazlanshah et al. [16] found a
significant association between attitude and the use of nutrition
labelling on food purchasing decision among 165 respondents
in Kuantan. Another study in Selangor showed that 58% of the
respondents were “often” and “sometimes” used of nutrition
information on food label during buying food product Nurliyana,
Norazmir & Khairil Anuar [17].
In line with National Health and Morbidity Survey (NHMS)
findings in 2014, present study also found that expiry date was
the most popular information the respondents read on food label
when buying food products. A study on the understanding of the
Malaysian Dietary Guidelines (MDG) in 2010 showed that more
than half of the respondents were not aware on the health messages
in the MDG IPH [18]. Unfamiliarity to the technical terms and
negligence of certain nutrient information that they perceived as
not important to their health also contributed to the low prevalence
of reading food label IPH [18].
Perception of Healthier Choice Logo (HCL)
During this study, HCL was not yet implement in Malaysia.
However, a series of technical discussion about HCL was done as
early as 2006. Hence, there was no education about HCL labelling
system from Ministry of Health during this study. Some of the
respondents were aware of the similar system based on their
experience in other countries. A review study of the Pick The Tick
logo used in Australia and New Zealand reported that education of
FOP system may take some years before consumer can understand
the meaning of the logo Mhurchu & Gorton [19]. Another similar
programme is the Choices programme which was introduced in the
Netherland in 2006. Through communication campaigns that was
implemented during the first year after the logo was introduced,
more than 80% of the Netherland population was familiar with the
logo compared to 30% at the beginning Vyth et al. [20].
The results of the present study indicated that majority of the
respondents (80%) supported the implementation of HCL for it may
help them in making food choices. These findings were parallel with
the study conducted in Europe by Feunekes et al. [21] where it was
found that Healthier Choice Tick may be more effective in helping
consumers to choose food products. A review study by Hawley et
al. [22] also indicated that such logo did not promote an increased
consumption of ‘less unhealthy’ products that qualified for the logo.
Even though there was no further research on the public health
impact pertaining to the logo, environment with healthier options
for various type of food products may help to improve population
dietary intake.
The HCL was expected to have some impact on purchasing
behaviour. Research conducted within the Netherlands on the
actual use of Choices logo showed that more consumers consciously
buying products bearing the logo compared to those who indicated
not consciously buying products with the logo Vyth et al. [23].
Approximately, 60% of the respondents from this study indicated
that they would choose to buy the food products even they were
sold at higher price. Thomson et al. [24] reported that the Tick
programme in New Zealand had encouraged food manufacturers to
reformulate and produce healthier products. The Center for Science
in the Public Interest (CSPI) also reported that a major Swedish
retailer, inköpscentralernas aktiebolag (ICA) had used the keyhole
symbol on food labels. The sales of food products bearing the
symbol rose over 15% between 2003 and 2004 CSPI [25].
There may be a possibility that such symbol or logo system could
encourage food manufacturers to reformulate existing products or
develop new products to improve their nutritional compositions.
According to the food product reformulation records kept by
National Heart Foundation (NHF) from 1 July 1998 to 30 June 1999,
many Tick products had either been invented or reformulated to
meet the Tick requirements, particularly nutrient criteria for fat and
sodium Young & Swinburn [26]. However, to our best of knowledge,
there is no study in Malaysia examines the possibility beneficial
impact of FOP labelling system to the producers and retailers who
implement them. Therefore, it is important to explore further in
FOP nutrition labels in the context of Malaysian population.
The findings of this study showed that the most trustworthiness
authority other than government was the professional bodies.
A professional body is usually a nonprofit organization whose
members are individuals engaged in that profession and the public
interest. Some studies reported that consumers’ trust in nutrition
information on food labels would be higher if they trusted the
information sources Vyth et al. [20]; Grunert & Wills [27]. A study
in Europe found that 71% trusted the information sources for
nutrition information came from a third party compared to selfcertified
schemes EAHC [28]. These findings indicated that such
logo system when been developed by the industry, it was usually
perceived to be less trustworthy.
The findings of this study concluded that the consumers
preferred the nutrition information panel (NIP) been declared
together with the FOP symbols. This is an indication of how a
FOP labelling such as HCL and energy icon can attract food label
reading habits alongside NIP labelling. Another study found that simpler FOP symbols were more effective in helping consumers to
identify healthier products Feunekes et al. [21]. IOM [29] reported
that research on FOP symbol systems is limited and there were no
label systems that developed on FOP alone. FOP is to be used in
conjunction with the nutrition labelling. Food industries developed
FOP label systems to provide consumers with summaries of the
nutritional properties of the product to guide them in making
healthier choices Kunkel & McKinley [30]. This study had shown
that although there would be HCL logo, 60% of the respondents
were expected to still refer to NIP at the back-of-pack (BOP) of the
food label. Another study conducted by Reid et al. [31] had shown
that the overall use of nutrition information on food label was
related to Health Check Logo in Canada.
formation to the public becomes of prime importance in the
battle against diet-related chronic diseases. This study found that
FOP was expected to have some impact on consumers’ buying
decision and may help them in making food choices. However, this
study also did not deal with the role of FOP in guiding consumers at
the point of purchasing decisions in real-life settings. Future study
is recommended to clarify further a possibility beneficial impact
that such logo system could encourage food manufacturers to
reformulate existing products or develop new products to improve
their nutritional compositions.
We would like to extend our grateful thanks to the Director
General of Health, Malaysia for the opportunity to publish this
study. This work was supported by the Negeri Sembilan State
Health Department. We thank the respective nutritionists in Negeri
Sembilan, especially Mr Mohamad Ihsan Tahir and Ms Farah Wahida
Za’abar for assistance rendered.
For more Articles: https://biomedres01.blogspot.com/