Friday, April 29, 2022

The Diagnostic Difficulties and The Delayed Identification of Anaplastic Large Cell Lymphoma in A Teenage Patient. A Review of Literature


The Diagnostic Difficulties and The Delayed Identification of Anaplastic Large Cell Lymphoma in A Teenage Patient. A Review of Literature


Introduction

Anaplastic large cell lymphoma (ALCL) originates from peripheral T-lymphocytes and is the most common mature T-cell neoplasm in children and adolescents. All in all, these neoplasms are relatively rare among all types of lymphomas. ALCL comprises about 10-20% of all non-Hodgkin lymphomas (NHL) in the above group of patients [1-3]. Essentially, this lymphoma does not occur frequently and is often difficult to distinguish, though its identification is essential for both the prognosis and treatment [4]. The primary site of the lymphoma can appear in almost any location, including lymph nodes. This may result in unspecific clinical signs of disease leading to why it can take several months from the appearance of the first symptoms to make an accurate diagnosis.

ALCL was recently classified by the World Health Organization (WHO) as primary cutaneous ALCL (C-ALCL) and systemic ALCL (S-ALCL). The second category was further divided into two distinct types based on expression of a protein called anaplastic lymphoma kinase (ALK), ALCL ALK-positive (ALK+) and ALCL ALKnegative (ALK-) [5]. The presence of this protein on neoplastic cells is more frequent in children and young adults, with a median age of approximately 30 years, whereas the lack of it is proven in older adults (median age of about 55 years). Simultaneously, this feature is associated with improved overall survival [2,6,7]. Additionally, the assessment of ALK expression plays an essential role in the case of S-ALCL. The overall survival rate of ALK+ lymphoma increases up to 70% and is far better that of ALK- lymphoma that ranges from 15-45% [6,7]. C-ALCL is marked by indolent development and a favorable prognosis with a survival rate of 80-95% [2]. We present the case of a patient with an unusual clinical manifestation and difficulties in the diagnostics of S-ALCL. We would like to point out what to do in order to avoid mistakes in the early stages of this disease. Additionally, attention should be paid to the aggressive and insidious growth of S-ALCL in a very brief time.

Case Presentation

Patient History and Information

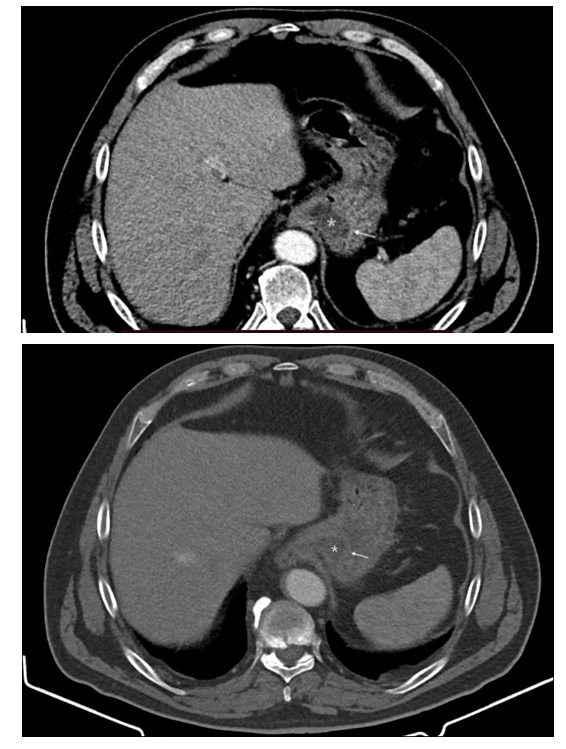
A sixteen-year-old boy was admitted to the Surgery Clinic in July 2017 due to a nodular skin lesion. The 4 cm lesion was located in his lower abdomen and was darker than the surrounding skin. On clinical examination, the lesion was suspected to be an abscess and the patient was sent to surgery. The lesion was incised and did not contain any liquid content. No tissue material was taken for histopathological examination. The wound did not heal, was suppurating and slowly reducing its size. Furthermore, in August 2017, hard and painless tumors appeared in the area of both groins. Ultrasound (US) and computed tomography (CT) of the abdominal cavity and pelvis showed enlarged lymph nodes in the inguinal and pelvic regions. Based on the above examination, lymphoma was suspected, and the boy was sent to the Department of Pediatric Oncology, Hematology and Transplantology at Poznan University of Medical Sciences.

Diagnostic Assessment

On the day of admission in September 2017, the physical examination showed an unhealed wound on the skin of the lower abdomen and palpable hard nodal masses in the iliac fossae. We have only a photographic evidence of the scar 4 months after surgical treatment (Figure 1). Additionally, a painless fistula with leakage was observed inside the oral cavity in the area of the right molar teeth. The liver and spleen were not enlarged. The results of biochemical tests, morphology, and peripheral blood smears were within normal limits. During his stay in the Department, the patient presented with a low-grade fever and increasing facial asymmetry caused by swelling of the right cheek. CT scan and magnetic resonance imaging (MRI) of the head revealed the solid mass (60x42x35 mm) filled almost all of the space of the right maxillary sinus and destroyed the structure of the posterior wall of the sinus, invading the pterygopalatine fossa and adipose tissue, reaching the area of the masseter muscles. Laterally, it was spreading into the right buccal area where from the medial side, it was infiltrating the lateral part of the palate. Upwards, it was penetrating the inferior orbital fissure and damaging the upper wall of the maxillary sinus into the right orbit. There were no signs of the tumor spreading to the middle cranial fossa. Furthermore, numerous enlarged lymph nodes of the upper neck region were found. Biopsies of the inguinal node, exophytic craniofacial tumor, and bone marrow along were performed. The patient was also examined with positron emission tomography (PET), which allowed for a determination of disease in stage IV.

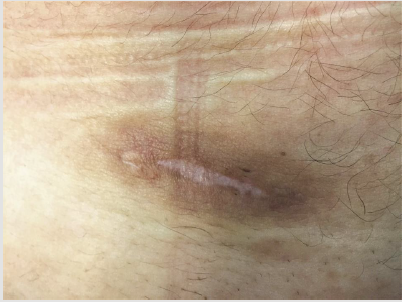
Figure 1: The scar in the lower abdomen 4 months after surgical treatment of the primary lesion.

Histopatological Findings

Materials and Methods: The specimen was taken from three different sites and sent to Pathology Department. The first surgery consisted of excisional biopsy of enlarged, inguinal lymph node. 5 days later the biopsy of bone marrow (two trephines) was done. 6 days later excisional biopsy of two tumors in the oral cavity, (including right maxilla and oral vestibule) was performed. All resected specimens were fixed in 10 % buffered formalin, routinely processed and embedded in paraffin, stained with hematoxylin and eosin. An initial panel of immunohistochemical stains was performed on an automated immunostainer (Ventana Benchmark, Roche/Ventana Medical Systems, Tucson, AZ) and this included: CD30, EMA (Epithelial Membrane Antigen), ALK-1, CD43, CD3, CD15, CD20, Desmina (DES), CD25, Granzyme B, Perforin, TIA 1, CD7, CD5, Cd8, Cd56, MUM 1, PDL 1, CD4, CD2, EBI-1, PAX-5, Ki 67.

Results: Grossly, the first resected specimen consisted of solid soft tissue in form of a lymph node measuring 3,5 cm x 3,0 cm x 2,0 cm. It was oval in shape, but the external surface was rather smooth. On cross section, the tumor was white to grey, solid and encapsulated. The second specimen consisted of two core biopsies specimen of bone marrow measuring 2,6 cm and 0,8 cm in length. The third specimen from the oral cavity consisted of two separated specimens each of which was fragmented measuring 5 cm and 3 cm respectively in greatest diameter. Microscopically, the neoplasm invaded the lymph node and the specimens from oral cavity. The bone marrow specimen was not impaired. The tumor 
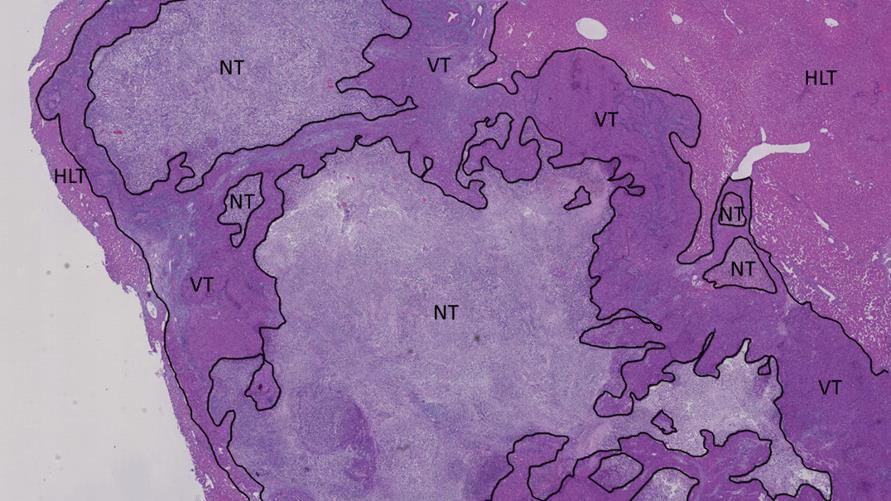
cell occupied almost entire parenchyma of the lymph node (Figure 2a). The neoplastic cells differed in size from small to large ones (Figure 2b). This was helpful in distinguishing ALCL from Hodgkin Lymphoma. The cells invading the lymph node and the oral cavity had the same morphology (Figure 3). Most of the neoplastic cells were large, irregular and bizarre. They often had polylobated nuclei and the subset of cells had eccentric horse- or kidney-shaped nuclei consisted with Hallmark cells characteristic of ALCL. Admixed with the tumor were scattered small lymphocytic cells. Mitotic figures were easily encountered (60 per 10 high power fields). There was no necrosis.
Immunohistochemically the tumor cells stained for CD 30 and ALK 1 showing nuclear and cytoplasmic staining (Figure 4a and 4b). Such pattern of staining correlates with underlying genetic abnormality t (2;5). They also stained for EMA, CD43, CD25, Granzyme B, Perforin, TIA 1, Ki -67 in 80% of the cells and focally for CD3, CD7, CD5, CD8, CD56, MUM 1, PDL 1. They neoplastic cells were negative for CD15, CD20, Desmin, CD4, CD2, EBI-3, PAX 5. The microscopic and immunophenotypic studies confirmed the diagnosis of Anaplastic Large Cell Lymphoma, common type.

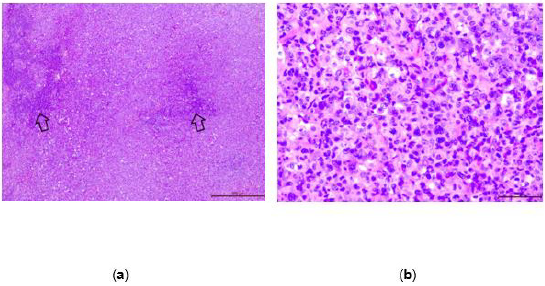
Figure 2: (a) The tumor invades almost entire inguinal lymph node tissue. There are only small areas of the normal lymph node (arrows), H&E, 200X; (b) The neoplastic cells range from small to large ones. They usually have large, irregular, and bizarre or polylobated nuclei, H&E ,400X.

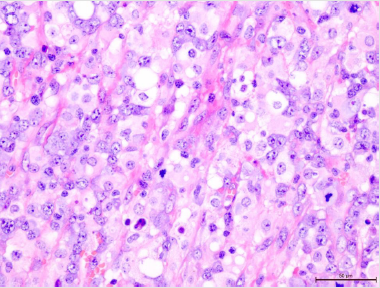
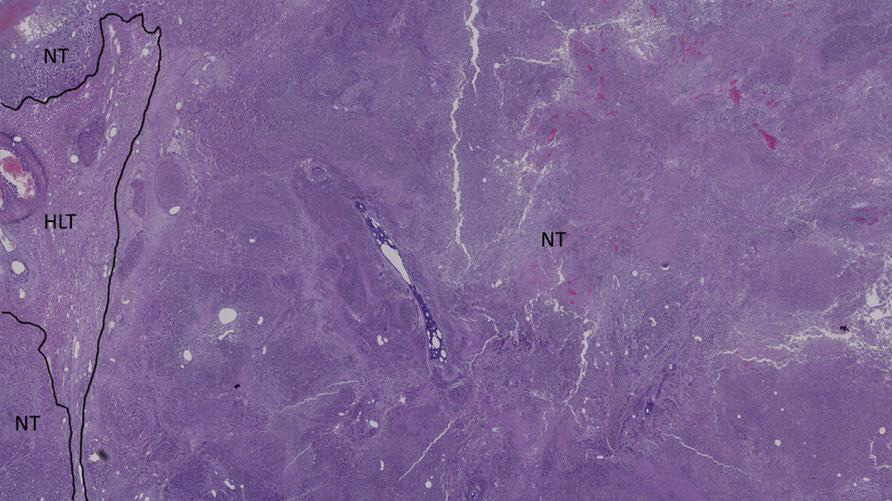
Figure 3: The neoplastic cells infiltrating the mucosa of the oral cavity, H&E, 400X.

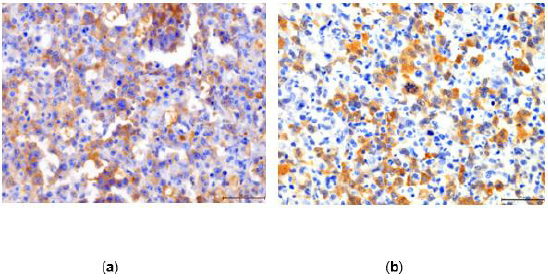
Figure 4: (a) The tumor cells are diffusely positive for CD30, 400X; (b) Most of the neoplastic cells stain for ALK 1, 400X.

Diagnosis

Based on the PET scan and pathology report, ALCL in stage IV was diagnosed.

Treatment and Outcome

After establishing the final diagnosis, treatment according to the international protocol ALCL 99 was started. It consisted of six alternating, consecutive courses of AM (dexamethasone, methotrexate, ifosfamide, cytarabine, etoposide) and BM (dexamethasone, methotrexate, cyclophosphamide, doxorubicin) [8]. Currently, the patient remains in the first complete remission of the disease, 36 months after their treatment.

Discussion

S-ALCL remains a moderately aggressive lymphoproliferative neoplasm with worse outcomes than most B-cell lymphomas, yet significantly better survival than other peripheral T-cell lymphomas [9]. The majority of patients are male and present with advanced disease in stages III or IV, often with systemic symptoms, especially fever. Dissimilar from adults, ALCL in children usually demonstrates expression of ALK [1,3,6,7]. The diagnosis of S-ALCL can be challenging, mainly when first signs appear in the skin. One of the reasons for this is that both types of S-ALCL can secondarily involve the skin and C-ALCL can secondarily involve regional lymph nodes. It shows the importance of the correlation of histopathological findings with staging and other clinical data in order to establish a proper diagnosis [9]. The stage of the disease at the beginning is frequently determined as advanced. It may often result from both a late diagnosis as well as a rather rapid developmental rate of disseminated neoplastic cells. In literature, such cases take a few months from the first signs of disease (Table 1) [10-15]. In our case, that period lasted three months.

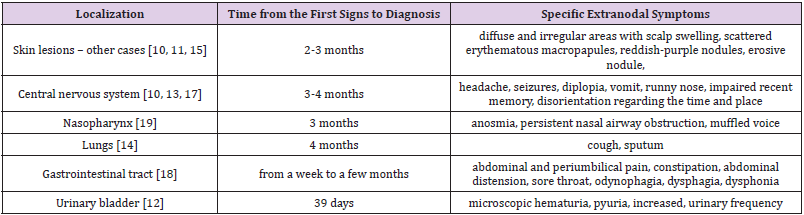
Table 1: The review of the approximate time from the first presenting signs to diagnosis and distinctive symptoms resulting from particular extranodal sites of ALCL in the literature.

The primary site of S-ALCL can occur in almost any location in the human body. In most cases at first, it affects lymph nodes, and the initial sign is painless lymphadenopathy. If that happens, the proper procedure is to carry out a broad differential diagnosis. We should take into account bacterial and viral infections, zoonotic diseases, connective tissue diseases and neoplasms, notably leukemia and lymphomas. In 60% of ALK+ anaplastic large cell lymphomas, there is an additional involvement of extranodal tissues most often concerning skin, bones, bone marrow, soft tissues, lungs and liver [1,6,7]. However, S-ALCL presenting initially as a localized skin lesion is an infrequent finding, as was the case with our patient [11,15]. His first sign of lymphoma was a nodular skin lesion that resembled an abscess. Other primary extranodal localizations of S-ALCL are presented in literature, which include soft tissues, lungs, bones, stomach, small intestine, tonsils, and the central nervous system [13,16-18].
Symptoms resulting from extranodal involvement (listed in Table 1) may imitate various other diseases and linking them to a lymphoproliferative neoplasm can be quite challenging. Examples of an atypical clinical course of ALCL can be found in literature [10,11,13,14,19]. In cases of involved lungs, the lesion may present as tuberous masses, atelectasis, displacement of the mediastinum to one side and pleural effusion [14]. Sites in the central nervous system are accompanied by various neurological disorders such as diplopia, nausea, vomiting, neck stiffness, persistent headaches, impairment of recent memory, disorientation regarding the time and place and poor state of mind [10,13]. Skin lesions can occur either as a soft and swollen nodular lesion or as a scattered, erythematous and maculopapular one, both of which can display ulceration [10, 11]. Moreover, a case of incorrect diagnosis of mononucleosis has been reported in a teenage girl with a nasopharyngeal mass and cervical lymphadenopathy where the mass caused nasal airway obstruction [19].

Due to a wide range of complaints, patients may visit many specialists in the early stages of disease. These physicians, who are usually not oncologists, should keep oncological alertness in every situation including trivial ones, as they play a particularly important role in the initiation of the diagnostic process and referral of patients to oncologists. The proper proceedings have a decisive influence on prognosis, which also includes surgical interventions of precarious lesions. For the described patient, a surgeon made a significant mistake at the beginning of the diagnostic process. Without any examination and histopathological analysis, the doctor considered a nodular skin lesion as an abscess and incised those changes to drain it. Thus, the time to make a diagnosis of ALCL and initiating the treatment in the presented patient was markedly protracted. The absence of any liquid content inside the skin lesion should have led the physician to verify the previous assessment. Moreover, he ought to have collected some material for histopathological examination. What is more, the increased healing time of this wound should have awaken the doctors’ suspicion of the neoplastic character of this lesion.
Its histopathological features cause further difficulties in diagnosing ALCL. The marked cellular pleomorphism and morphologic variation of ALCL raises a broad differential diagnosis including cancer, melanoma, sarcoma and other hematopoietic neoplasms such as diffuse large B-cell lymphoma, classical Hodgkin lymphoma, myeloid sarcoma and peripheral T-cell lymphoma not otherwise specified [20]. ALCL shows a broad morphological spectrum. Still, all cases contain a variable percentage of cells with eccentric, horseshoe- or kidney-shaped nuclei, often with an eosinophilic region near the nucleus, socalled hallmark cells [3]. It is essential to recognize that rare cases may have subtle morphological features, including a prominent reactive background [20]. ALK+ and ALK- types of S-ALCL share similar morphological features and diagnosis cannot be established based on morphological evaluation alone. Thus, the immunohistochemistry and molecular profile (IHC) play essential roles in the diagnosis and subclassification of ALCL [9]. The ALK+ form is associated with the NPM-ALK t (2;5) translocation, which highly correlates with the identification of the ALK protein by IHC [2]. CD30 antigen expression in the neoplastic cells is distinctive of ALCL, but it is not a specific marker for this lymphoma. However, the strong and homogenous staining helps distinguish ALCL from other CD30+ lymphomas [6,9]. Besides being CD30+, most cases also express epithelial membrane antigen (EMA). Moreover, ALCLs are considered peripheral T-cell lymphomas as they express one or more T-cell antigens. Therefore, markers like CD2, CD4 and CD5 are positive in a significant proportion of cases. However, due to the loss of several pan T-cell antigens, some cases may have an apparent “null cell” phenotype [6,21]. S-ALCL is not one disease entity, and the “one size fits all” treatment strategy is not ideal [8]. To implement the best targeted therapy, there is a necessity of an exact determination of the neoplastic cells’ immunophenotype. In view of the above, and due to additionally significant complexity of histopathological diagnostics of lymphomas, this process should be performed in the department of pathology with the highest reference level. The facility should have all available diagnostic techniques, beyond standard pathomorphological evaluation, including but not limited to, broad antibody panels to IHC testing, flow cytometry, cytogenetics and molecular diagnostics [22].
S-ALCL, especially in ALK+ peculiarities, exhibits chemosensitivity in the front line and at relapse, leading to high response rates with vastly different chemotherapy regimens [9,21]. The beginning of the treatment based on an incorrect diagnosis may cause the implementation of an incorrect chemotherapy protocol. On the other hand, leaving the patient without any treatment when the disease progresses very quickly can eliminate further therapeutic options and lead to disastrous complications [22]. Results of the Savage et al. study showed that an advanced stage and poor performance status are poor prognostic factors in both ALK+ and ALK- ALCL. In contrast, multiple extranodal sites of involvement and increased age are bad prognostic factors only in the ALK+ type [6]. Implementation of targeted therapy at early stages of disease may result in a better chance of recovery.

Conclusion

Anaplastic large cell lymphomas represent complicated diagnostic difficulties. The possibility of localization of both primary and secondary sites in extranodal locations makes clinical manifestation non-specific. Presented symptoms may seem trivial or can indicate another condition and as a result, can be easily marginalized. For this reason, it can lead to making a significant mistake at the beginning of the diagnostic process. Complicated pathomorphological diagnostics are based on immunophenotype evaluation with confirmation in the reference facility. As a consequence, ALCL is most often diagnosed in an advanced stage. Physicians who encounter such patients at the beginning are usually not oncologists. However, they are crucial to initiate the relevant diagnostic processes and refer the patient to the oncology center afterward. It is therefore essential to stay alert all of the time. Whether the patient will survive, improve and recover is their responsibility.

For more Articles on : https://biomedres01.blogspot.com/


Coexistence of Vagus Nerve Stimulation and Epicardial Implantable Cardioverter-Defibrillator System, Possible Interference: A Case Report and Systematic Review of the Literature


Coexistence of Vagus Nerve Stimulation and Epicardial Implantable Cardioverter-Defibrillator System, Possible Interference: A Case Report and Systematic Review of the Literature


Introduction

Vagus nerve stimulation (VNS) is an effective treatment for drug-resistant epilepsies in adults [1] and children [2]. Although VNS is generally well tolerated, rare cases of severe bradycardia and asystole related to vagal stimulation are described [3,4]. The coexistence of VNS with an electronic cardiac implantable device, i.e., pacemaker [5-7] or implantable cardioverter-defibrillator (ICD) [8], in patients suffering from both refractory epilepsy and arrhythmias are rarely reported, none in pediatric age or in a patient with epilepsy and congenital heart disease. The presence of both an implantable neurostimulator and an implantable cardiac device in the same patient raises the concern that stimulation from VNS therapy systems would be detected by the cardiac device, leading to inappropriate delivery of therapy. In this review, we report the first case in literature of a child with a VNS device and a ICD system implanted via an epicardial approach, and summarize the current literature available on concomitant therapy with both VNS and implantable electronic cardiac system, with a focus on possible interference between the devices.

Case Report

A 7-year-old child was born at term after uneventful pregnancy. At the age of 9 months, she was diagnosed with long QT syndrome [mean corrected QT interval (QTc), 546 ms] and hypertrophic cardiomyopathy; treatment with propranolol was immediately started. Genetic testing for KCNQ1, KCNH2, SCN5A, KCNE1 and KCNE2, as well as CGH-array, resulted negative. At the age of 11 months, the patient has survived a cardiac arrest due to ventricular fibrillation after prolonged resuscitation maneuvers, resulting in a diffuse ischemic encephalopathy with basal ganglia involvement and asymmetrical distribution for left hemisphere predominant damage. At 12 months of age, an ICD (Protecta XT 354 DR, Medtronic, Inc.) with epicardial leads placement (i.e., a bipolar pacesense lead placed on the right ventricle, and a Transvene® 6937A transvenous superior vena cava coil, Medtronic, Inc., placed in the transverse sinus as the defibrillator coil) was implanted; the pocket was seated below the left costal margin. Prophylactic treatment with Phenobarbital was started. Few days after discharge, she was re-admitted for repetitive focal seizures, and levetiracetam (LEV) was added to Phenobarbital. At 17 months of age, she presented with right hemiparesis, focal seizures and developmental delay. During the follow-up, the epilepsy has proven to be highly drug resistant: valproate, clobazam, vigabatrin, rufinamide, topiramate, clonazepam and lamotrigine were alternatively added in therapy with poor effect. At 3 years of age, she began to experience recurrent multifocal clonic seizures (about 2-3/week), that caused the child to fall. Resective/disconnective surgery was excluded due to the multifocality of recoded seizures and extensiveness of the cerebral damage.

Vagus nerve stimulation was considered the best option and the implantation (Livanova 103 and Cyberonics 404) was performed on the left thoracic side (the can was located between the left chest and the upper abdomen, not far from the ICD) (age 4.5 years old). The timeline of clinical events and treatments is represented in (Figure 1). About 1 month after VNS implantation, concern was raised just before the activation of intermittent vagal stimulation. Any possible interference between the VNS and ICD was carefully detected through continuous ECG and ICD programmer monitoring. The ventricular sensing mode was found configured using the tip-to-coil bipole. In order to minimize the recording of external interference, the true bipolar electrode was set as the ventricular detection mode. First, the impedance of the VNS was tested for few seconds: 3 electrical noise signals were observed on the far-field recording (i.e. can/coil channel), but not detected by the ICD on the sensing channel (i.e. true RV bipole), with all the artifacts that fell during the ventricular repolarization phase (Figure 2). Second, the VNS was activated at 0.25 mA and afterwards increased at 0.50 mA, noticing a high frequency signal only at the beginning of each step to increase the output, but again without abnormal events in the marker channel (Figure 3A). Finally, the VNS was tested at the highest output; the same phenomenon that occurred at lower outputs was observed, without any inappropriate event.

Figure 1: Timeline of clinical events and treatment.

Figure 2: Impedance test during the first activation of the VNS and electrograms recording from ICD (from bottom to top, respectively: can/coil channel, reference marks, true bipolar RV lead channel). The arrows indicate high frequency noise right at the beginning of the impedance test.

Figure 3: Vagal nerve stimulation device programming and ICD monitoring.
A. Electrograms from ICD (from bottom to top: can/coil channel, reference marks, true bipolar RV lead channel) while a current of 0.5 mA is delivered from the VNS: noise are traced by the can/coil channel but not from the true bipolar one nor from the reference one.
B. Electrograms (as in figure A) during VNS with 1.25 mA and coughing. Noise is documented on the can/coil channel but not on the others, all under ICD sensing threshold.
C. Electrograms (from bottom to top: true bipolar RV channel, references marks, can/coil channel). At the maximum output (black arrow), a sharp signal on the first and third channel without any mark on the reference channel was documented. This episode may be related to a sort of isolated reset of ICD recording due to electromagnetic interference, as well as to a loss of telemetry just for the initial increase in energy.

It was concluded that the use of both devices simultaneously was safe due to the absence of pacing and sensing interferences, and the VNS was programmed at 0.50 mA as the starting output current. Correct QT interval at that time was 490 ms (under the maximum tolerated dose of beta-blockers drugs). Over time, all parameters of VNS, i.e. output current, frequency, pulse width, and stimulation on/off times (duty cycle), were adjusted to reach the maximum tolerable output current. To test the neurological effect of the VNS, a stepwise approach was performed to gradually increase the intensity of vagal stimulation; a new ICD monitoring was performed each time the VNS current was increased. A month later, the VNS output was increased to 1-1.25 mA. When the VNS was activated at these values, the child started coughing, and noise was concurrently observed on the far-field recording, but again without any noise recorded in the near-field electrogram, as well as without any abnormal events recorded in the ICD marker channel (Figure 3B). At this time, the QTc was slightly longer, 510 ms. A 24h ECG Holter was performed to evaluate arrhythmia occurrence and QT modification: no arrhythmia occurred and QTc varied from 499 to 566 ms during the recording. An improvement in seizures was gradually observed as the VNS intensity was progressively tuned up. During a control 6 months later, an odd phenomenon has been observed on the programmer when the energy was increased, i.e., a transient lack of recordings and marking, but with a clear electrical input (Figure 3C). This episode may be related to a sort of isolated reset of ICD recording due to electromagnetic interference, as well as to a loss of telemetry just for the initial increase in energy. In the subsequent 2 years of follow-up, the child has never experienced seizures, and a marked improvement in alertness, motor and cognitive performances and in the electroencephalogramme findings were noticed. The VNS activation by a magnet to provide on-demand stimulation to prevent or shorten a seizure was regularly used for clusters of spasm, often with apparent advantage and without interference. No further significant QTc prolongation was observed during progressive optimization of VNS stimulation.

Discussion

In the 1990s, with the success of several early clinical trials, VNS was approved for the treatment of refractory epilepsy, and later for refractory depression. It exerts antiepileptic or antiepileptogenic effect possibly through neuromodulation of certain monoamine pathways and vagal afferent pathways, resulting in alterations of seizure-generating regions.9 Beyond epilepsy, VNS is also under investigation for the treatment of chronic heart failure, inflammation, asthma, and pain [9].

Vagus Nerve Stimulation for Epilepsy Treatment and Cardiac Effects

Vagal efferent pathways innervating the heart is known to induce inhibition of sinoatrial node activity resulting in decreased heart rate, atrioventricular conduction, and excitability of the His- Purkinje system. However, the effects of VNS on cardiovascular autonomic tone of patients with refractory epilepsy remain poorly understood. In the one hand, cardiac changes related to VNS in epileptic patients have been reported to be rare, and data on heart rate variability, baroreflex sensibility, and blood pressure monitoring revealed only slight alterations of the autonomic cardiac tone with no clinically and hemodynamically relevant effects [10,11]; on the other hand, several cases of bradyarrhythmia during implantation have been reported [12,13], and pilot studies showed higher vagal tone [14] and lower heart rate in patients with VNS [15]. Intraoperatively, bradycardia and asystole can occur, albeit rarely, during lead impedance testing. This could be due to either collateral current spread or inadvertent placement of electrodes on vagus nerve cardiac branches. In these cases the procedure was immediately terminated and the device removed. Although rare, delayed arrhythmias and syncope have been reported after long-term use [16]. Iriarte and coll. describe a case of late asystole in a patient whose VNS had been implanted 9 years before the arrhythmia onset; each run of stimulation produced bradyarrhythmias and very often severe asystolia due to atriumventricular block.

The Authors hypothesized a possible influence of the status epilepticus; it is a well-known phenomenon that vegetative changes are frequent during epileptic seizures, and these changes may have predisposed the patient to VNS-related cardiac arrhythmia. Therefore, these data suggest that new-onset episodes of nonepileptic origin in patients with VNS merit urgent cardiac evaluation.Furthermore, in patients with intermittent vagal stimulation, temporary imbalances of cardiac autonomic activity due to increased stimulation of the vagus nerve could be expected to paradoxically modify the QT interval and increase the arrhythmic risk [17]. Desimone et coll. reported a transient QT interval prolongation and a potentially increased arrhythmic risk in long QT syndrome early after left sympathetic denervation [18]. However, studies have not found an excess of cases of sudden death in patients with VNS [19], but VNS should be contraindicated in patients with type 3 Long QT Syndrome, in whom ventricular tachyarrhythmias are triggered by increased vagal tone. In our case, no bradycardia or arrhythmias or dramatic QT modification were noticed acutely and in the follow-up.

Coexistence of Vagus Nerve Stimulation for Refractory Epilepsy and Pacemaker/Implantable Cardioverter Defibrillator: Possible Interference

The presence of both an implantable neurostimulator and an implantable cardiac device raises the concern that stimulation from VNS therapy systems would be detected by the implantable cardiac device, leading to inappropriate delivery of therapy. Interference between the two devices could lead to high-frequency VNS being detected by the cardiac device, triggering a change in cardiac pacing or a inappropriate delivery of a high-voltage shock. However, the possible interaction of VNS and cardiac devices such as pacemaker and ICD is poorly known. Only three patients with refractory epilepsy implanted with pacemaker and VNS [5-7], and only one with ICD and VNS [8] are reported in literature; in all these cases the implantation of the cardiac device was performed using a transvenous approach. Cáceres, et al. [5] reports the case of a 45-year-old woman with a VNS and pacemaker implanted for AV block with asystole secondary to seizures and without a cardiovascular disease. Yun [6] published the case of a 55-year-old woman who was implanted with a pacemaker after VNS-induced bradycardia; no information is given about follow-up. Beal [7] describes the case of a 17-year-old boy who was implanted with pacemaker for seizure induced bradycardia; VNS was subsequently implanted but removed just several weeks later for pocket infection. The only report of ICD and VNS implantation concerns a patient (56-year-old) with a bipolar disorder and a poorly defined cardiac disease (“syncope and ventricular tachyarrhythmias”) [8]. To our knowledge, this is the first report of a patient with VNS system and epicardial defibrillator lead placement, which also describes apparent interference between VNS and ICD, nevertheless without compromising the correct function of both devices; moreover, this is the first case of ICD and VNS coexistence reported in childhood and in a patient with severe congenital heart disease, for whom careful and long-lasting ICD monitoring is also available.

In our case, the epicardial approach for ICD implantation was preferred to the transvenous placement due to the young age of the patient. Drug resistant epylepsia was the indication to VNS therapy. Based on clinical effect and tolerability, it was planned to pursue an approach that was expected to start with low output (0.25-0.75 mA) and gradually increase the VNS amplitude to compensate the tissue resistance [9]. At the time of the first VNS activation, noise was noticed on ICD can/coil channel during the impedance test and at the beginning of each increase in the stimulation output up to the maximum power. However, the noise was only evident on the far-field channel, but it was never identifiable in the narrowfield channel, either because it was not recorded or it was under the threshold of sensing and therefore discarded by the ICD. At follow-up, inappropriate ICD events were never noticed, allowing the girl to effectively control seizures and to be safely protected by the ICD. Nevertheless, there are few possible concerns to be considered when such electrical devices co-exist. The activation of the VNS generates an electrical current that can be detected by the ICD; in our case, high frequency signals were only recorded on the far-field channel, while the true bipolar channel (i.e. right ventricular sensing channel) was always free from interference, or alternatively it was only affected by signals under the threshold of sensing. But it could be speculated that a critical threshold could be exceeded when the energy reaches a high output, causing detection of inappropriate electrical signals and possible ICD malfunction. Therefore, to be sure to avoid sensing the output of the VNS on the ICD, the VNS must be tested at maximum output and the sensitivity of the pacemaker must be varied to assess for interaction. With the highest VNS energy output, an odd behavior was recorded with a sort of “black out” of the sensing/pacing function.

A possible explanation could be an isolated loss of telemetry between the programmer and the ICD, due to electromagnetic interference from the high energy delivered by the VNS. In the less likely hypothesis of a transient ICD malfunction due to a VNS interference, a loss of pacing could not be detected since the patient had spontaneous ventricular rhythm, but concerns would arise in pacemaker-dependent patients.A further consideration concerns the implantation site of VNS and ICD, which could influence their mutual functioning. In the childhood, the small size of the patient limited the space to be shared by the 2 devices. In our case, the devices were placed close to each other in the upper abdomen, theoretically overlapping the ICD sensing/shock field and the VNS electrical exit and potentially interfering with correct recognition and treatment of arrhythmias. Moreover, the epicardial location of the ICD leads could also facilitate possible interference due to their position outside the heart, being anatomically closer to the VNS can and the efferent vagal nerve endings. However, no interference was detected in our patient at follow up.

Vagus Nerve Stimulation for Heart Failure Treatment

Heart failure is characterized by an overactive sympathetic nervous system and parasympathetic withdrawal, and this autonomic imbalance contributes to the progression of the disease. As such, modulation of autonomic nervous system by device-based therapy has been speculated an attractive treatment target. Recent trials have published data on heart failure patients implanted with a cervical VNS system with lead placement on either the right or left cervical vagus nerve and given chronic stimulation for up to 12 months; in some of these studies, VNS activation and inactivation periods were unrelated to the cardiac cycle (i.e. open loop) [20-22], while a right ventricular sensing lead was used for a closed loop system in the INOVATE-HF trial [23]. However, no significant benefit on mortality, cardiac remodeling and heart failure hospitalization has been demonstrated, albeit a small benefit in functional capacity has been shown. A total of 441 patients enrolled in these studies, most of which (364/441 patients) in the INOVATE-HF trial [23], had both an implantable VNS system and an implantable cardiac device, and none interference or interaction between the two systems has been reported.

Conclusion

Vagus nerve stimulation has proven to be an effective treatment for refractory epilepsy. The positioning of both a VNS system and a pacemaker/ICD in the same patient appears to be safe, as supported by reports of patients affected by epilepsy and by studies on heart failure as well as by the case of the patient reported above. Cardiac device monitoring during VNS tapering should be performed. To be sure to avoid sensing the output of the VNS on the pacemaker/ ICD, it is critical that the VNS is tested at maximum output and the sensitivity of the cardiac device has varied to assess for interaction. Furthermore, the case reported by our Institute suggests that the coexistence of VNS with epicardial ICD is feasible and can be safe also in children.

For more Articles on : https://biomedres01.blogspot.com/


Selective Conventional Transarterial Chemoembolization with Oxaliplatin Increases Tumor Exposure Compared to Systemic Administration in a Rabbit Model of Hepatocellular Carcinoma


Selective Conventional Transarterial Chemoembolization with Oxaliplatin Increases Tumor Exposure Compared to Systemic Administration in a Rabbit Model of Hepatocellular Carcinoma


Introduction

The treatment of hepatocellular carcinoma (HCC) is challenging. Traditional antineoplastic agents have shown limited clinical efficacy in advanced stages of HCC, particularly in the context of progression after locoregional therapy such as transcatheter arterial chemoembolization (TACE) [1]. The phase III prospective, randomized EACH trial compared the FOLFOX4 regimen (combining fluorouracil, leucovorin and oxaliplatin by IV administration) versus doxorubicin in Asian patients with unresectable HCC who were ineligible for locoregional therapy. Although the primary endpoint of OS benefit with FOLFOX4 did not reach significance at the prespecified end-point, the FOLFOX4 regimen was associated with longer OS compared to doxorubicin (median OS: 6.40 months with FOLFOX4 and 4.97 months with doxorubicin; p = 0.07, hazard ratio = 0.80 (0.63 - 1.02)). However, PFS, response rate and disease control rate were significantly higher with FOLFOX4 combination therapy than with systemic doxorubicin [2].

A subsequent unplanned analysis performed on the subgroup of Chinese patients showed a median OS at the prespecified treatment time-point of 5.7 months with FOLFOX4 and 4.3 months with doxorubicin (hazard ratio: 0.74; 95% confidence interval: 0.55–0.98; p = 0.03) [3]. These studies led the Chinese Food and Drug Administration to grant approval for the FOLFOX4 regimen for the treatment of advanced HCC ineligible for surgery [1]. The GEMOX regimen (combining gemcitabine and oxaliplatin) was retrospectively tested in the AGEO trial in 204 patients with advanced HCC with interesting results (PFS of 4.5 months and OS of 11.0 months). However, grade 3-4 toxicity, comprising thrombocytopenia, neutropenia, diarrhea and neurotoxicity, was observed in 44% of patients and resulted in treatment discontinuation in 16% of cases [4]. Conventional TACE (cTACE), combining a cytotoxic drug with Lipiodol® Ultra Fluid, an oily contrast medium consisting of a mixture of long-chain diiodinated ethyl esters of fatty acids from poppy seed oil [5] with an additional embolizing agent such as gelfoam, was conceived and first investigated by a Japanese team in 1983 for the treatment of patients with mostly unresectable HCC [6].

TACE has subsequently become the standard of care for the treatment of patients with intermediate stage HCC (Barcelona Clinic Liver Cancer, BCLC stage B) [7]. Recently ESMO also recommended TACE (grade A, level of evidence I) for early stage patients who are in the waiting list for liver transplantation (bridging therapy) based on XXL trial [8]. The most commonly used antineoplastic agents are anthracyclines, (especially doxorubicin or epirubicin), platinum-based agents (cisplatin, oxaliplatin or miriplatin) and mitomycin C in association with other drugs [7,9,10]. As one of the key advantages of TACE is the prolonged high exposure of tumor to the drug, the choice of molecule is of paramount importance, especially as HCC is a highly resistant tumor [1]. Only a few nonclinical comparative studies [11-13] have rigorously investigated the cytotoxic effect of current (or future) antineoplastic molecules. These studies were mostly based on 2D in vitro cytotoxicity models performed on various human or animal cell lines. Cytotoxicity may differ according to the cell line selected [12].

These studies prompted the proposal of drugs such as idarubicin [11], doxorubicin or tyrosine kinase inhibitors [12] for animal and clinical studies. Oxaliplatin forms cross-links with deoxyribonucleic acid (DNA). It mainly forms intra-strand adducts between two adjacent guanine residues or between guanine and adenine, thereby disrupting DNA replication and transcription [14]. Although this phenomenon occurs to a lesser extent with oxaliplatin compared to cisplatin, the adducts more potently inhibit DNA replication [15]. Interestingly, oxaliplatin is cytotoxic in cisplatin-resistant cell lines, including colon adenocarcinoma cells [16]. The oxaliplatin toxicity profile appears to differ from that of cisplatin, with less neutropenia, anemia, thromboembolic events and alopecia, but increased neurotoxicity and diarrhea [17]. We hypothesized that cTACE with Lipiodol and oxaliplatin and a supplementary embolizing agent would:

a) Reduce systemic exposure to the cytotoxic molecule;
b) Improve tumor uptake and
c) Improve pharmacological efficacy, compared with intravenous administration.

The purpose of this study was therefore to compare the pharmacokinetics and biodistribution of oxaliplatin emulsified in Lipiodol supplemented with additional embolizing agent (cTACE procedure) administered by hepatic artery infusion with intravenous (IV) infusion of oxaliplatin in a rabbit model of HCC.

Materials and Methods

Test Compounds

Oxaliplatin 50 mg powder for injection (Eloxatin®, Sanofi, China) was administered either by intravenous (IV) infusion or by cTACE in the form of a water-in-oil (w/o) emulsion with Lipiodol® Ultra Fluid (Guerbet, Villepinte, France). Oxaliplatin 50 mg powder was dissolved in 10 mL of water for injection to obtain a 5 mg/mL solution. For cTACE, oxaliplatin was emulsified by the repeated pumping method (35 back-and-forth pumping) of an aqueous phase (3.3 mL of a 7.6 mg/mL oxaliplatin solution) into an oily phase (6.7 mL Lipiodol®) using a 3-way stopcock and two 20 mL syringes. The water-in-oil emulsion [oxaliplatin (final concentration in the emulsion: 2.5 mg/ml) -Lipiodol] was prepared extemporaneously and was verified by microscopic examination and by carrying out the drop test [18].

Liver Tumour Model

All animal experiments were conducted in strict compliance with European Union Directive 2010/63/EU on the protection of animals used for scientific purposes. The protocol was approved by the local animal research ethics committee. All surgeries were performed under general anesthesia and aseptic conditions and were supplemented by appropriate analgesic programs. Liver tumors were induced in 34 female New Zealand white rabbits (3.42±0.32 kg, Charles River, Saint-Germain-Nuelles France). One VX2 well-vascularized tumor fragments (25 mg), obtained from a carrier animal, was immediately implanted in the left median lobe of the exposed liver of the recipient rabbit. After 19±1 or 2 days of tumor growth, tumor size was considered optimal to carry out cTACE (mean ± SD: diameter of 2.5±0.6 cm measured by ultrasound imaging).

Drug Administration

The oxaliplatin solution was administered at a dose of 4 mg/ kg by intravenous (IV) infusion (marginal ear vein) over 6 minutes. The Insyte catheter (22 G, Introcan®-W, B Braun, Melsungen, Germany) was then flushed with 1 mL of 0.9% NaCl (CDM Lavoisier, Paris, France). For cTACE, a 4-French guide (Radifocus® Introducer II, Terumo Europe N.V., Leuven, Belgium) was positioned in the rabbit’s femoral artery to allow introduction of a 4-French catheter (Outlook®, Bolia Mini-Cath, Terumo) to perform angiography (using a mobile C-arm with flat detector, Veradius®, Philips, France) to delineate the blood supply to the liver and to confirm the location of the tumor. The iodinated contrast agent administered was iobitridol 300 mgI/mL diluted to half (Xenetix 300®, Guerbet, Villepinte, France). Subsequently, a 1.7-French catheter (Echelon®, eV3®, Medtronic B.V., Heerlen, The Netherlands) was selectively inserted into the left hepatic artery using an 0.012-inch guide wire (Radifocus®, Terumo Europe NV, Leuven, Belgium) and used for emulsion injection. A fixed volume of emulsion (0.3 mL; 0.75 mg/rabbit) was administered by cTACE over 6 minutes, followed by administration of gelatin sponge (Curaspon®, CuraMedical B.V., Assendelft, The Netherlands) injected until retrograde flow (variable volume). Gelatin powder was suspended in iobitridol (Xenetix, Guerbet Villepinte, France) to obtain a radiopaque white foam.

Study Groups

This study was carried out on 34 rabbits divided into 8 groups of 4 to 5 rabbits (Figure1).

Figure 1: Distribution diagram of the 34 rabbits in the 8 groups of the study.

Tumour Response

In all test groups, ultrasound imaging (B mode) and dynamic contrast-enhanced (DCE) mode with sulfur hexafluoride microbubbles (Sonoview®, Bracco Diagnostics, Milano, Italy) was performed (Aixplorer®, Supersonic Imaging, Aix-en-Provence, France) before treatment and 30 minutes before necropsy to measure the size (longest diameter) (Response Evaluation Criteria in Solid Tumors, RECIST criteria) (NDP View 2.0 software). The intratumoral arterial phase enhancement, reflecting tumor perfusion of viable areas (modified RECIST criteria, mRECIST) was measured in an all (enhancement during the arterial phase) -ornothing (enhancement during the portal phase) manner by DCEUS.

Protocol

For groups 2 and 6, blood samples were drawn from the auricular artery at 2, 5, 10, 20, 30 minutes and 1, 2, 3, 4, 5, 6, and 24 hours following the start of administration for pharmacokinetic analyses (elemental platinum (Pt) measurement). Blood was centrifuged (3,500 g, 10 min, 4°C) and then ultrafiltered (2,000 g, 22 min, 25°C, Centrifree®, Merck KGaA, Darmstadt, Germany) to obtain 100 μL samples of protein-free ultrafiltered plasma. The same for groups 4 and 8, blood samples were drawn from the auricular artery at 1, 2, 3, 4, 5, 6 and 24 hours and then once daily until day 7 (except on the weekend). Blood was centrifuged (3,500 g, 10 min, 4°C) to obtain plasma.

At the time of each group, rabbits were sacrificed by bolus administration of pentobarbital sodium (Dolethal®, Vetoquinol). Blood was drawn for all groups and was centrifuged (3,500 g, 10 min, 4°C). For all groups, plasma, one half of the tumor, right lobe of liver, lung, kidney, pancreas, spleen and heart were sampled for quantification of elemental Pt concentrations by inductively coupled plasma mass spectrometry (ICP-MS) (7,700x, Agilent Technologies, Santa Clara, CA). The Pt concentrations obtained were then converted to wet tissue concentrations (nmol Pt/g) considering all dilution steps. The areas under the tissue concentration–time curve (AUC-last) were calculated by the trapezoidal method from 0 to the last experimental time-point to compare tissue exposure to oxaliplatin.

The other half of the tumor was fixed with 4% formalin and used for blinded histological examination after hematoxylin-eosin (H&E) staining. Tumor necrosis, expressed as a percentage of the whole tumor area, was measured using NDP View 2.0 software (Hamamatsu Photonics K.K., Hamamatsu City, Japan). The following tumor budding scoring was used: 0 = no viable tumor buds; 1= rare small viable buds (islets composed of a few cells), small buds (isolated islets); 2 = small number of tumor buds; 3 = moderate to numerous tumor buds. “Buds” were defined as clusters of living tumor cells.

Statistical Analysis

The Mann-Whitney test was performed to compare, for example, the percentage of injected dose per gram (%ID/g) of organs or the Pt concentrations in organs, at each time of sacrifice, between the two routes of administration, based on the results of a prior Kruskal-Wallis test by ranks. These tests do not consider multiplicity and therefore cannot be considered to test the inference (extrapolation to the whole population) and significance levels are purely descriptive. Analyses were performed with GraphPad Prism 8 software (GraphPad Software Inc., La Jolla, CA, USA). A significance level of 5% was adopted.

Results

Pharmacokinetic Analysis

Total Plasma Platinum Decay and Body Exposure: Total plasma Pt decay profiles indicate lower systemic exposure to oxaliplatin in the cTACE group compared to the IV group (Figure 2), which was confirmed by calculating the area under the plasma concentration-time curve (AUC), as the AUC0-last was 11-fold lower in the cTACE group than in the IV oxaliplatin group (Figure 3).

Ultrafiltered Plasma Platinum Decay and Body Exposure: Decay patterns in ultrafiltered protein plasma also indicate significantly lower systemic exposure to unbound Pt in the cTACE group compared to the IV group. (Figure 4).

Figure 2: Plasma decay profiles of total Pt concentrations over time following IV or cTACE oxaliplatin treatments to rabbits bearing a VX2 liver tumor. Data are shown as individual values.

Figure 3: Area under the curve (AUC) from time of administration to 7 days calculated from plasma Pt concentrations. Data are shown as mean ± SD and individual values (* = p<0.05).

Figure 4: Plasma decay profiles of protein-free ultrafiltered plasma Pt concentrations over the first 24 hours following IV or cTACE oxaliplatin treatments to rabbits bearing a VX2 liver tumor. The inset shows a zoom at low Pt concentrations Data are shown as individual values.

Tumour Platinum Distribution

Regardless of the time-point considered, the mean percentage of the injected dose of oxaliplatin per gram of tumor (%ID/g) was significantly higher in the cTACE groups than in the IV groups (Table 1). Mean Pt concentrations in the VX2 tumor were also higher, but not significantly. There was no statistical evidence for a time-dependant decrease in Pt concentrations (Figure 5). Marked variability was observed within the cTACE groups. VX2 tumor targeting was considered weak in 3 out of 18 rabbits.

Figure 5: Percentage of injected dose of oxaliplatin per gram of VX2 tumor and Pt concentration in the VX2 tumor at the various experimental time-points following either intravenous (12-16 mg oxaliplatin /rabbit) or selective intra-tumoral administration (0.75 mg oxaliplatin / rabbit) to VX2 rabbits. Data are shown as mean ± SD and individual values. NS = non significant, * = p<0.05.

Table 1: Pt concentration in the tumor and healthy liver tissue, percentage of injected dose of oxaliplatin per gram of organ and tumor/ healthy liver tissue ratio at the various experimental time-points following cTACE (0.75mg oxaliplatin/ rabbit) or IV administration (12-16 mg oxaliplatin /rabbit) to VX2 rabbits.

Data are shown as mean ± SD, NS = non signifiant, * = p<0.05, ** = p<0.01.

Platinum Distribution in Healthy Liver Parenchyma

The Pt distribution in the healthy liver was very low (the percentage of injected dose per gram of healthy liver tissue was less than 0.05%/g at 1 hour for both groups) (Table 1). Overall, no significant difference of the percentage of injected dose per gram was observed between the IV and cTACE routes of administration. On the other hand, a significantly much lower exposure at 24, 72 and 168h was observed after cTACE injection due to the lower dose injected. Pt concentrations decreased as a function of time, in contrast with tumor Pt concentrations, due to elimination by the kidneys (Figure 6).

Tumor/Healthy Liver Ratio

The most important parameter for the proof-of-concept of tumor targeting with minimal exposure to the liver is the tumor/ healthy liver ratio (Figure 7). Despite the variability of data in the cTACE group, which minimizes differences between the two groups, the ratio was close to 1 for the IV route (Table 1), whereas it exceeded 20, at all times points for cTACE treatment and reached 65 at 168h (Table 1).

Figure 6: Percentage of injected dose of oxaliplatin per gram of healthy liver and Pt concentration in the healthy liver at the various experimental time-points following either intravenous (12-16 mg oxaliplatin /rabbit) or selective intra-tumoral administration (0.75 mg oxaliplatin / rabbit) to VX2 rabbits. Data are shown as mean ± SD and individual values NS = non significant, * = p<0.05, ** = p<0.01.

Figure 7: Tumor/healthy liver tissue ratio (the inset focuses on the actual ratios for the IV group).
Data are shown as mean ± SD and individual values. NS = non significant, * = p<0.05.

Table 2: Pt concentration in organs (pancreas, spleen, lung, heart and kidney) and percentage of injected dose of oxaliplatin per gram of organ at the various experimental time-points following either intravenous (12 16 mg oxaliplatin /rabbit) or selective intratumoral administration (0.75 mg oxaliplatin / rabbit) to VX2 rabbits.

Data are shown as mean ± SD, NS = non significant, * = p<0.05.

Platinum Distribution in Other Organs

Regardless of the organ (pancreas, spleen, lung and heart) and the time-point considered (Table 2), the mean percentage of injected oxaliplatin dose per gram of tissue was low after both routes of administration. No significant difference was observed between the two routes of administration. On the other hand, as in healthy liver, significantly (p<0.05) much lower exposure was observed at 24-, 72- and 168-hours after the cTACE injection due to the lower dose injected. In the kidney (Table 2), the percentage of Pt concentration per gram of tissue was slightly higher in the cTACE group than in the IV group at 1, 72- and 168-hours postadministration. As in other organs, a significantly (p<0.05) lower exposure was observed at 24, 72- and 168hours.

Changes in Tumour Size and Blood Perfusion Over Time

Overall, no significant difference in the percentage change of tumor size (RECIST criterion) following drug administration was observed between the IV and cTACE groups (2.5±22.4% vs -1.0±1.2% at 1h, 12.3±6.8% vs 14.0±23.6% at 24h, -8.0±11.5% vs 22.8±22.2% at 72h, 39.7±58.6% vs 27.5±34.0% at 168h, respectively) (Figure 8). On the other hand, intratumoral enhancement, reflecting tumor viability (mRECIST criterion), evaluated by DCE-US, revealed the absence of tumor perfusion in all but two rabbits in the cTACE group (1 h and 24 h time-points) strongly suggesting high tumor necrosis rate, while tumor perfusion was maintained in all but one rabbit (24 h time-point) in the IV group suggesting a remaining high viable tumor rate following this treatment.

Figure 8: Changes in VX2 tumor size (%, post- vs. pre-) in the IV and cTACE oxaliplatin groups.
Data are shown as mean ± SD and individual values. NS = non significant.

Tumor Necrosis

One-hour post-treatment, central tumor necrosis (around 40% of the tumor area) was detected in all animals. At 1-, 3- and 7-days post-treatment, no obvious increase in tumor necrosis was observed for any of the animals treated by the IV route. Conversely, in the cTACE group, mean tumor necrosis was greater than 90% of VX2 tumor area at the 1-, 3- and 7-day time-points. At these 3 timepoints, the percentage of tumor necrosis was significantly higher in the cTACE group than in the IV group (Figure 9). No massive (> 99%) tumor necrosis was observed in the IV group, regardless of the time-point (Figure 10). In contrast, massive tumor necrosis was commonly observed in the cTACE group at late time-points (1h: 0/4 rabbits; 1 day: 4/5 rabbits; 3 days: 3/4 rabbits and 7 days: 3/4 rabbits) (Figure 11). However, in the cTACE group, viable tumor buds were still observed in 8 out the 10 rabbits with massive necrosis (score 1= rare small viable buds (islets of a few cells), small buds (isolated islets): 6/8 animals, score 2= small number of tumor buds: 1/8 animal and score 3= moderate to numerous tumor buds: 1/8 rabbit). These buds were mostly found at the periphery of the tumor.

Figure 9: Percentage of tumor necrosis at the various experimental time-points following either intravenous or selective intratumoral administration to VX2 rabbits. Data are shown as mean ± SD and individual values. NS = non significant, * = p<0.05.

Figure 10: Histological section of the tumor of an IV-treated rabbit 24h post-administration NT = necrotic tumor, VT = viable tumor and HLT = healthy liver tissue.

Figure 11: Histological section of the tumor of a cTACE-treated rabbit 24h post-administration NT = necrotic tumor and HLT = healthy liver tissue.

Safety

No signs of neurologic or other toxicity were observed in the animals during housing, regardless of the group or the time-point.

Discussion

Oxaliplatin, in combination with 5-fluorouracil and leucovorin, is widely used for the adjuvant treatment of advanced colorectal cancer [19]. Hepatic arterial infusion of oxaliplatin associated with intravenous administration of leucovorin and 5-fluorouracil has provided promising results after failure of systemic chemotherapy in patients with unresectable liver metastases from colorectal cancer [20]. Conventional TACE combining oxaliplatin and 5-fluorouracil for the treatment of large (> 10 cm) HCC has been reported, with interesting results (median overall survival and time-to-progression of 10.3 and 3.0 months, respectively) [21]. To our knowledge, no studies have yet compared the clinical efficacy and safety of intravenous and locally administered oxaliplatin at relevant doses in a clinically relevant model of HCC.

The recommended oxaliplatin dose in patients is 85 mg/m2 by intravenous infusion (Eloxatin SPCs) [22]. Assuming a total body surface area of 1.73 m2 and a bodyweight of 80 kg, the human dose would equate to 1.8 mg/kg. In this study, an oxaliplatin dose of 4 mg/ kg was selected. After adjustment for body surface area, by applying a 3.1 ratio, this would equate to a dose of 1.3 mg/kg in patients, a value close to the recommended dose. In the present study, the oxaliplatin solution and emulsion were infused at different doses (4 mg/kg for IV infusion versus 0.75 mg/rabbit for cTACE). For cTACE, we deliberately administered a fixed dose of oxaliplatin instead of a bodyweight-dependent dose. This protocol was selected in order to allow subsequent complementary gelfoam embolization, in line with routine cTACE practice in the clinical settting. The difference in administered doses of oxaliplatin explains the higher total plasma Pt concentrations measured in the IV group.

Filterable Pt plasma curves were also measured. Platinum binding to plasma proteins (mostly albumin and gamma globulins) has been demonstrated [23], with 85-88% of all Pt bound to circulating proteins within 5 hours in patients [24]. Platinum also binds irreversibly to erythrocytes (15% in humans, not measured in this study). It is also taken up by peripheral lymphocytes, where it targets DNA [23]. Only unbound Pt is thought to be pharmacologically active [25]. Once again, systemic exposure to the pharmacologically active fraction is much lower via the cTACE route than via the standard route IV.

Interestingly, despite the dramatically lower dose injected during the cTACE procedure, the percentages of injected oxaliplatin dose per gram of tumor were significantly higher after cTACE than after IV injection. Absolute Pt concentrations in tumor tissue were also higher, but not significantly, after cTACE. There was no statistical evidence for a decrease in tumor tissue Pt concentrations over time after cTACE, suggesting that the VX2 tumor constitutes a deep compartment for Pt distribution, which consequently does not follow the Pt elimination profile observed in other tissues. These persistent Pt concentrations in tumor tissue would be clinically relevant, as long-lasting intratumor exposure, while minimizing systemic exposure to the pharmacologically active drug, remains the ultimate goal of cTACE [26]. The results of the present study show that the very low exposure of the healthy hepatic parenchyma as well as the very high tumor concentration contribute to the excellent tumor / healthy liver tissue ratio observed with cTACE, highlighting the benefits associated with the cTACE route of administration of oxaliplatin. A low distribution of oxaliplatin was found in the pancreas, lung, spleen and heart, regardless of the test groups, which was an expected finding. However, the percentage of injected dose per gram of tissue was higher in the kidneys than in these various organs, which is consistent with the predominant renal excretion of oxaliplatin in rabbits [27] and in humans [23] and the results of another comparative IV vs. cTACE study in VX2 rabbits [28]. In a similar VX2 rabbit model, De Baere et al. showed that water-in-oil emulsions containing large droplets of watersoluble cytotoxic drug resulted in lower lung uptake and higher tumor uptake than any other type of Lipiodol-based emulsion [29]. Conventional TACE was therefore performed using a water-in-oil emulsion of oxaliplatin in Lipiodol.

Overall, the IV and cTACE groups were not significantly different in terms of the effects of treatment on tumor diameter, regardless of the time-point. However, the variability of ultrasound examination (estimated at 30% from in-house studies), the difficulty of positioning the transducer exactly over the same position before and after treatment and the necrosis observed in the cTACE group make it difficult to draw any definite conclusions concerning this parameter.

In patients, HCC tumor viability is estimated on the basis of changes in tumor arterial enhancement after TACE and is quantified by the mRECIST approach. The mRECIST criteria [30] were developed for locoregional therapies for HCC, especially TACE, by incorporating the concept of viable tumor tissue showing uptake during the arterial phase of contrast-enhanced imaging procedures [31]. In the present and non-clinical version of this approach, a complete response was observed in all animals at the end of the study (7 days). Blinded histologic examination of the VX2 tumors was also performed at various time-points. Regardless of the groups, VX2 tumor necrosis was observed in the animals sacrificed at the 1-hour time-point. This tumor necrosis was probably spontaneous, as commonly described in the VX2 rabbit model [32], and unrelated to treatment. At 1-, 3- and 7-days post-treatment, no increase of tumor necrosis was observed for any of the animals treated by IV infusion. In contrast, in the cTACE group, a significant difference in the percentage of tumor necrosis was observed between 1h versus 1-, 3- and 7-days post-treatment (p=0.02). Massive necrosis (>99%) was observed in 10/17 tumors treated by cTACE, which can be considered to be a marker of curative treatment. Tumor necrosis was enhanced by the fact that cTACE effectively blocked tumor perfusion at all time-points, in contrast with the IV route.

Viable nodules (score 1/3 n =6; score 2/3 n=1; score 3/3 n=1) were still present in 8/10 rabbits, which indicates a risk of tumor progression. The tumor regions that remained morphologically viable were mainly located in the hepatic capsule at the periphery of the tumor. However, a fixed volume of 0.3 mL of emulsion was administered. Depending on the size/volume of each tumor, tumor Lipiodol uptake may have been only partial, while best clinical practice would require the injection of a volume of Lipiodol-based emulsion until opacification of the arterial-portal vascular bed is observed, in order to ensure effective cTACE [33].

The toxicity of Pt-based chemotherapy is well known. Firstly, Pt analogs, including oxaliplatin, can induce serious and dose-limiting peripheral neurotoxicity [34]. No signs of neurologic toxicity were observed in our study. The favourable dose-efficacy ratio observed in the cTACE group compared with the IV group constitutes a major advantage of this approach, including in terms of safety.

This study has several limitations. Elemental Pt was measured instead of the parent drug or one of the transient metabolites. The dosage of the parent drug or one of the transient metabolites is not technically feasible for pharmacokinetic studies and monitoring of Pt instead of the parent molecule or a metabolite is considered to be an acceptable alternative [23]. Platinum excretion was not assessed by urine assays, as this was not one of the objectives of this study and the renal clearance of oxaliplatin in rabbits has been extensively studied elsewhere [27]. Tumor necrosis was not investigated by immunohistochemistry techniques. Only H&E-stained slides were examined. Although monitoring of various biomarkers would have improved the detailed description of the tumors, H&E staining was considered to be sufficient to allow accurate assessment of tumor necrosis, the most clinically relevant parameter in the context of TACE [35].

In conclusion cTACE performed by local infusion of a water-inoil emulsion of a low dose of oxaliplatin in Lipiodol was associated with lower systemic exposure, higher tumor/healthy liver parenchyma Pt ratios and more marked tumor necrosis than after intravenous infusion of a higher dose of this cytotoxic molecule in VX2 tumor-bearing rabbits. These results may warrant clinical studies in patients with unresectable HCC lesions.

For more Articles on : https://biomedres01.blogspot.com/   


Cobalt Doped TiO2/rGO Nanocomposites as Highly Efficient Photocatalyst for Water Purification


Cobalt Doped TiO2/rGO Nanocomposites as Highly Efficient Photocatalyst for Water Purification


Introduction

Photocatalysis is a crucial research filed, which solves the problem of energy and environmental pollution in the world in an economical and sustainable way [1]. Titanium dioxide (TiO2), as the most common candidate among various semiconductor photocatalysts, has been widely utilized in the environmental filed because of its high activity, long-term stability and low toxicity [2-6]. However, because of its wide band gap (Eg≈3.2 eV for anatase type TiO2) and high recombination rate of electron-hole pairs, TiO2 can solely adsorb the UV light which is merely 3~5% of solar spectrum, resulting in low utilization of the majority of the solar energy [7- 9]. In order to overcome these drawbacks, various improvement methods have been explored including heterogenous composition [10,11], element doping [12,13], surface modification and the like. Among them, the element doping of TiO2 photocatalysts has been considered as a feasible method to improve the interfacial charge-transfer efficiency, narrow the band gap and delay the recombination of carriers. Up to now, transition metal such as Co [14,15], Pt [16], Sn [17] and Fe [18] has been reported to be successfully doped into TiO2, and the light response wavelength of the obtained materials showed significant red-shift. According to literatures, transition metals cobalt is considered as one of the best candidates to reduce the electron-hole recombination rate and transfer the adsorption edge to the visible light region [19- 21]. The cobalt oxide-loaded TiO2 (TiO2-CoO) support with reduced graphene oxide (rGO) was fabricated by sol-gel method and utilized to remove 2-chlorophenol (2-CP).
The removal efficiency of 2-CP was 98.2% with the ternary nanocomposite in the visible region [22]. The ternary rGO-TiO2/Co3O4 nanocomposites were successfully prepared by co-precipitation method, and exhibited the highest degradation performance of methylene blue (MB) and crystal violet (CV) dye under visible light [23]. As a result, cobalt doped TiO2 photocatalysts have shown superior performance in degrading various organic pollutants. Graphene oxide (GO), due to its excellent electrical conductivity, large surface area and chemical stability, has attracted wide attention as a substrate for promoting the uniform distribution of heterojunction materials and enhancing the photocatalytic activity [24-28]. Due to the conjugated structure of GO, the nanocomposite of modified TiO2 supported with graphene oxide were the perfect combination to enhance the charge separation during the electrontransfer processes. Therefore, the coupling of graphene oxide with some semiconductors has received particular attention in recent years [6]. In this paper, Cobalt doped TiO2/rGO composites was successfully fabricated through hydrothermal method for MB degradation. The results demonstrated that the Co-TiO2/rGO composites remarkably enhanced the MB degradation efficiency. Furthermore, recycling degradation experiments revealed excellent stability of the fabricated Co-TiO2/rGO nanocomposites for treatment of target contaminant.

Materials and Methods

Materials

Cobalt nitrate hexahydrate (Co(NO3)2·6H2O, 98%), Tetrabutyl titanate (C16H36O4Ti), glacial acetic acid (C2H4O2), ethanol (C2H5OH) and macrogol 400 (HO (CH2CH2O) n H) were obtained from He Dong Hong Yan reagent factory of Tian Jin. Natural flake graphite (≥99.85%) was purchased from Sinopharm Chemical Reagent Co. Ltd.

Catalysts Synthesis

Co-TiO2 catalysts were prepared by one-step hydrothermal method. In a typical synthesis procedure, 10mL tetrabutly titanate was dissolved in ethanol (20mL) to form homogenous solution “A”, whereas 0.02g Co (NO3)2·6H2O dissolved in a solution of ethyl alcohol, glacial acetic acid, macrogol 400 and deionized water to form solution “B”. Subsequently, solution “A” was introduced into solution “B”, and the obtained dispersion was heated at 180 °C for 5h. In following step, the prepared catalysts were washed by centrifugation with ethanol and dried at 80 °C. The obtained composites were light yellow particle and calcined in a muffle furnace at 500 °C for 3h, and the obtained sample was named as Co- TiO2. The GO was synthesized by modified Hummers method. 20mg GO powder was dispersed in a solution of deionized water (40mL) and ethanol (20mL) through 30min ultrasonic, and then 200mg Co-TiO2 was introduced to the GO suspension under vigorous stirring. Subsequently, the solution was heated at 140 °C for 5h. The resulting precipitate was washed with deionized water and dried at 80 °C. The final composites powders were labelled as Co-TiO2/rGO- 2. For comparison, the samples prepared by adding 10mg, 30mg GO powder were denoted as Co-TiO2/rGO-1 and Co-TiO2/rGO-3, respectively.

Characterization Methods

The purity and crystallinity of the prepared samples were collected by Bruker D8 Advance X-ray diffraction (Germany) with Cu Kα radiation. The morphology of the photocatalysts was characterized via Scanning electron microscope (Hitachi SU-4800). The Ultraviolet-Visible (UV-Vis) diffuse reflectance spectra (DRS) were implemented by using UV-3600 Plus. X-ray photoelectron spectroscopy (XPS) were obtained by ESCALAB 250XI (ThermoFischer Electron Corporation, USA). Electrochemical measurements were carried out on CHI 660E electrochemical workstation.

Photocatalytic Degradation

The photocatalytic efficiency of Co-TiO2/rGO samples was investigated with MB degradation under visible light. The visible light source was Perfect 300W Xe-lamp (with a 420nm cut-off filter). In each experiment, 20mg of Co-TiO2/rGO composite were added to 150mL MB solution (20mg/L). The suspension was stirred in the dark for 60min to ensure the attainment of adsorption-desorption equilibrium. 5mL sample solution was extracted at predetermined time and analyzed by UV-3600 plus. The removal efficiency (R) of MB was calculated by Eq. (1).

It was expected that the degradation of the MB obeyed the pseudo-first-order reaction kinetics as follows:

where C0 (mg/L) was the initial concentration of MB, Ct (mg/L) was the concentration of MB at time t, k was the kinetic constant.

Results and Discussion

Structure Characterization

Figure 1 were the XRD patterns of the as-prepared nanocomposites. It was clear that all samples exhibit similar diffraction peaks. The peaks located at 2θ = 25.34°, 37.85°, 47.99°, 54.04°, 62.67°, 68.79°, 70.31°, 75.05° and 82.49°, which could be indexed to (1 0 1), (0 0 4), (2 0 0), (1 0 5), (2 0 4), (1 1 6), (2 2 0), (2 1 5) and (2 2 4) planes of anatase TiO2, demonstrating the high purity and good crystallinity of the samples [29]. The diffraction peaks of Co were not observed, which might be owing to the low content of Co (NO3)2· 6H2O or the cobalt ions were uniformly dispersed into the anatase crystallites. It was noteworthy that the peak intensity corresponding to the (2 1 1) crystal plane in the cobalt-doped nanocomposites varied, indicating that the presence of Co2+ ions around Ti4+ [30]. No significant diffraction peaks were noticed for XRD patterns of Co-TiO2/rGO nanocomposites when compared with Co-TiO2 nanoparticles, which was described the low rGO content in the composite, or of the TiO2 loading on the rGO surface [31,32]. Surface morphology of the as-prepared composites was assayed through SEM analyses. It could be seen from Figure 2a that the Co- TiO2 particles were subsphaeroidal and well-dispersed. Figure 2b showed that the agglomeration occurred when subsphaeroidal Co- TiO2 particles were combined with graphene sheets. The element composition of the Co-TiO2/rGO-2 nanocomposites were confirmed by EDS analysis. In the element mapping images (Figures 2c & 2d), C, Ti, O and Co disperse uniformly in the selected area of Co-TiO2/ rGO-2, suggesting that cobalt atoms were successfully doped into the composites. According to these images, the cobalt atoms were evenly distributed in TiO2 particles, indicating that the interaction between cobalt and TiO2 particles was excellent in the hydrothermal synthesis procedure [15].

Figure 1: XRD patterns of
a) TiO2;
b) Co-TiO2;
c) TiO2/rGO;
d) Co-TiO2/rGO-1;
e) Co-TiO2/rGO-2;
f) Co-TiO2/rGO-3

Figure 2: SEM images of
a) TiO2;
b) Co-TiO2/rGO-2;
c) C and
d) EDS analysis of Co-TiO2/rGO-2.

The chemical oxidation state of Co-TiO2/rGO-2 nanocomposites were measured by XPS analysis (Figure 3). As shown in Figure 3a, the XPS survey spectrum of the Co-TiO2/rGO-2 presented that C, O, Ti and Co elements could be revealed, which could consistent well with the result of EDS element mapping. The spectrum of Ti 2p (Figure 3b) exhibited two main peaks at 464.2 and 458.4eV, which were assigned to the Ti 2p1/2 and Ti 2p3/2 [33]. The C 1s spectrum of Co-TiO2/rGO-2 composite was fitted into four peaks at 292.3eV, 288.1eV, 285.9eV and 284.3eV, which were signed to C= O, C= O= C, C= OH and C= C/C= H, respectively [34,35]. In the Co 2p core level of the Co-TiO2/rGO-2 nanocomposites (Figure 3d), the peak appearing at 781.2 eV corresponded to Co (II) ions [36,37]. The optical property of TiO2 and Co-TiO2/rGO was inspected by UV-Vis adsorption spectra, as displayed in Figures 4a & 4b. Pure TiO2, with equal to 3.18eV and adsorption edge at 390nm, showed almost no visible light adsorption. Compared with the adsorption edge of pure TiO2, a strong light adsorption intensity at approximately 430nm was observed for the Co-TiO2/rGO-2 composites, which was associated to the formation of Ti-O-C bonds, resulting in reduced excited photons energies and hence low band gap energy [38]. As a result, the visible light adsorption efficiency of Co-TiO2/rGO-2 can be effectively enhanced due to the cobalt cations and rGO, which is beneficial to improving the photocatalytic degradation activity.

In order to reveal the behaviors of charge transfer and separation in the prepared photocatalysts, the photocurrent response and electrochemical impedance spectroscopy (EIS) were recorded [39]. Figure 4c showed the transient photocurrent responses of TiO2, Co-TiO2 and Co-TiO2/rGO-2 composites. It could be found that the photocurrent densities of Co-TiO2/rGO- 2 composites were significantly higher than that those of other samples, implying the efficient separation efficiency of electronhole pairs. Figure 4d exhibited EIS changes of TiO2, Co-TiO2 and Co- TiO2/rGO-2 composites. It was clearly observed that the Co-TiO2/ rGO-2 possessed much smaller arc radius relative to TiO2 and Co- TiO2, indicating that Co-TiO2/rGO-2 had lower resistance and faster separation of electron-hole in the charge transfer processes, which could well correspond to the photocurrent results.

Figure 3:

a) Full XPS spectrum and high-resolution spectrum of
b) Ti 2p
c) C1s and
d) Co 2p

Figure 4:

a) UV-Vis diffuse reflectance spectra of TiO2, Co-TiO2, TiO2/rGO and Co-TiO2/rGO;
b) Plot of Kubelka-Munk function versus band gap energy of TiO2, Co-TiO2 and Co-TiO2/rGO-2;
c) The transient photocurrent density of TiO2, Co-TiO2 and Co-TiO2/rGO-2;
d) Electrochemical impedance spectra of Nyquist plots of TiO2, Co-TiO2 and Co-TiO2/rGO-2.

Photocatalytic Performances

The photocatalytic performances of the TiO2, Co-TiO2, TiO2/rGO and Co-TiO2/rGO composites were evaluated by degradation MB. As exhibited in Figure 5a, the Co-TiO2/rGO-2 nanocomposites had the highest photocatalytic performance. For pure TiO2 nanoparticles, only 57.4 % of the MB was removed following 210 min under visible light irradiation. Nonetheless, the removal percentage of MB by TiO2/rGO and Co-TiO2/rGO-2 nanocomposites was 83.5% and 99.7%, respectively. The enhanced activity of the Co-TiO2/rGO-2 nanocomposites might have been attributed to the introduction of Co ions and rGO. Figure 5b manifested the kinetic constant (k) of the as-prepared photocatalytic. The k value of pure TiO2 and TiO2/ rGO were 0.0025 and 0.0063 min−1, respectively. While the Co-TiO2/ rGO-2 nanocomposites exhibited the highest MB photodegradation rate (0.0125 min-1), which was almost 5 and 1.98 times faster than those of the TiO2 and TiO2/rGO, respectively. To identify the optimum dosage of the photocatalyst, a series of experiments were carried out by varying the concentration of catalyst from 10mg to 40mg in 150mL of MB (20mg/L) (Figure 5c). It was realized that the removal efficiency of MB increased from 69.3% to 99.7% with the Co-TiO2/rGO-2 nanocomposites increased from 10mg to 20mg, which was ascribed to the availability of enough active sites on the catalyst surface. Whereas the remove efficiency decreased with a further increase in the Co-TiO2/rGO-2 dosage, which was ascribed to the agglomeration of the photocatalyst. Based on the above results, the optimal dosage of Co-TiO2/rGO-2 nanocomposites for MB degradation was to be 20mg. The stability and recyclability of the photocatalyst exerts great impact on the operating cost of wastewater treatment. Therefore, the stability of the photocatalysts was evaluated for the Co-TiO2/rGO-2 nanocomposites and the results were showed in Figure 5c. The study indicated that the removal efficiency of MB was still 78.2% after five recycling runs, indicating the activity of the recovered Co-TiO2/rGO-2 was stable enough for recycling. Therefore, Co-TiO2/rGO-2 nanocomposites were expected to be promising in environmental remediation because of their excellent photocatalytic activity and stability.

Figure 5:

a) Photodegradation of MB under simulated solar irradiation over the as-prepared photocatalytic;
b) The kinetic constants of the as-prepared photocatalytic for the MB photodegradation;
c) Efficient of the dosage of the MB photodegradation by Co-TiO2/rGO-2;
d) Effect of cycling times on photocatalytic efficiency on Co-TiO2/rGO-2

Proposed Mechanism for Photocatalytic Degradation of MB

To determine the active species (such as •OH or h+ or •O2 - radicals) and further explore the photodegradation mechanism, isopropyl alcohol (IPA), ammonium oxalate (AO) and 1,4-benzoquinone (BQ) were used as the radical scavengers [40,41]. The experiment data revealed that the photocatalytic activity of Co-TiO2/rGO-2 was decreased by adding the radical scavengers but to different degrees (Figure 6), indicating that all the above active radical species were responsible for the MB degradation. Notably, the photocatalytic performance dropped sharply to 61.1% with the addition of IPA, demonstrating that h+ radical was the main active species in the MB degradation process. Based on the above characterization and photocatalytic activity results, a plausible mechanism of Co-TiO2/ rGO-2 for MB degradation has been proposed and shown in Figure 7. The improvement of TiO2 photocatalytic performance could be explained as follows:
1) The doping of optimal Co2+ into the lattice of TiO2 nanosheet could efficiently reduce the band gap width of TiO2 and increase the adsorption of visible light [42,43].
2) The specific surface area of the composite increased due to adding rGO, and more active sites could be provided for photocatalytic activity [44].
3) Under the excitation of visible light, the electrons generated by the conduction band of TiO2 were captured and transferred by the graphene layer, which improved the electronholes separation efficiency [45,46].

The electrons subsequently react with the oxygen molecules adsorbed on the surface of the catalyst to generate •O2 - to degrade MB. At the same time, the residual h+ within the TiO2 VB can be directly or through water oxidation to generate ·OH radicals, and in turn photo oxidize of MB [15]. In summary, the addition of Co metals to TiO2/reduced graphene oxide composite have demonstrated to be beneficial for degrading MB, which was consistent with the electrochemical measurements. The synergy effects of Cobalt doped TiO2 and rGO was conducive to the formation of the active sites and the facilitation of the high photocatalytic performance. Therefore, Co-TiO2/rGO composite offered an excellent combination of high activity and long-term performance durability.

Figure 6: Effects of radical scavengers on the degradation of MB over Co-TiO2/rGO-2 nanocomposite.

Figure 7: The probable photocatalytic degradation mechanism for MB by the Co-TiO2/rGO nanocomposites.

Conclusion

In conclusion, an efficient Cobalt doped TiO2/rGO photocatalyst was successfully prepared, and the properties of Co-TiO2/rGO nanocomposites were investigated. It was noticed that the Co-TiO2/ rGO-2 revealed an excellent photocatalytic performance in the MB degradation process. Compared to TiO2, MB degradation percentage was increased from 57.4% to 99.7% in the existence of Co-TiO2/rGO- 2. This phenomenon could be explained as the special properties of reduced graphene oxide components and cobalt dopant, which facilitate the separation of photo-generated carries and extend the adsorption spectrum of TiO2 into visible region. Furthermore, the degradation percentage of MB was still obtained to 78.2% after five cycles. Therefore, Co-TiO2/rGO nanocomposites have promising applications in degradation of the organic compounds in the coloring, petroleum and leather industries.

For more Articles on : https://biomedres01.blogspot.com/ 


Neurological Manifestations of COVID-19: A Brief Update on the Cuban Context

  Neurological Manifestations of COVID-19: A Brief Update on the Cuban Context Introduction Despite of severe acute respiratory syndrome cor...