The Introduction of Designing a Hybrid Brain Computer Interface System
Introduction
A Brain-Computer Interface (BCI) system can communicate without movement based on brain signals measured with Electroencephalography (EEG). BCIs usually rely on one of three types of control signals: The P300 components of the Event-Related Potential (ERP), Steady State Visual Evoked Potential (SSVEP), or Event Related Desynchronization (ERD). Research about BCI has been widely developed over the past few decades. BCI systems are used in various areas. However, different BCIs have their own advantages and disadvantages. In order to improve the performance of BCIs, Pfurtscheller et al. [1] proposed the hybrid BCI system increasing advantages and reducing disadvantages from different BCIs. A hybrid BCI system is composed of two different BCIs, or at least one BCI and another system. A hybrid BCI must fulfill the following four criteria like any BCI:
a) The device must rely on signals recorded directly from the brain;
b) There must be at least one recordable brain signal that the user can intentionally modulate to effect goal-directed behavior;
c) Real time processing; and
d) The user must obtain feedback [1].
A hybrid BCI can process different inputs simultaneously, either sequentially or in parallel. In the past decades, different kinds of BCI Speller systems have been researched in order to increase communication of disabled people with their peripheral environment and typing text rapidly. As a result, the conventional single modality of BCI speller systems have progressed in many ways while there are several problems as follows:
a) Most of the developed BCI speller systems are singlemodality.
b) Most of the developed BCI speller systems are experimented with expensive EEG devices such as BrainAmp DC amplifier.
c) There are limitations for people who have to use BCI speller because they use a special sentences just in some places like their home or their room in hospital while they need convenient and portable device for all places to spell everything to short time. In recent years, with the advancement of Hybrid BCI systems, many previous problems have been solved and also instead of using expensive devices, inexpensive and convenient devices have been replaced such as EMOTIV Epoc.
History and Literature Review
Before proceeding with any project, knowledge of the related work done in the past is very important. In this chapter, we review the related work of hybrid BCI systems and focus on a specific type of hybrid BCI systems that is related to the work in this thesis, i.e. the P300-SSVEP hybrid BCI systems.
P300-MI Based BCI
A possible combination for a hybrid BCI is P300 and motor imagery-based BCI. The basic concept in this type of hybrid is based on the features of P300 and ERD/ERS in control applications. P300 is a reliable BCI type for selecting one item out of several items and can be used for discrete control commands. On the other hand, due to the low degree of freedom presented by MI-based BCI, this type of BCI is more efficient for continuous control commands. These two types of BCIs can be joined to present more complicated control commands in one task. In [2], for controlling a wheelchair in a home environment, several approaches using different BCI techniques were introduced. The wheelchair control commands were divided into three steps; destination selection, navigation and stopping command. In first step, the user should select the destination of the wheelchair motion by selecting one of the items through a list of destinations by a P300 BCI presented at a screen.
The experiments on healthy subjects showed a response time of about 20 seconds, the false acceptance rate 2.5% and the error less than 3%. The results of this task showed that P300 was a suitable item for the interface. In Second step, the destination was selected and the wheelchair started its motion toward the destination following virtual guiding ways. A proximity sensor was considered for stopping the wheelchair facing obstacles. In third step, two methods were presented. The first method was the fast P300, in which, on the screen, there is only one item “The Stop” and the task is the detection of user’s intention. Experimental results showed reduction in response time. The second method was to use a MIbased BCI. The position of cursor was considered for presenting the visual feedback for the MI-based BCI system and control of the cursor was based on an arm movement imagination. Experimental results showed approximately the same response time as the fast P300 method, but for false acceptance, a rate of zero was achieved. Since the low false acceptance rate and fast response are the most important needs for this type of BCI, it seems that MI-based BCI is a more reliable system for this application.
In [3], P300 and MI were introduced to be components of the hybrid BCI in robotic control decision applications. Parallel and asynchronous classifications were introduced. The system task was to detect the intended pattern. Classification accuracy of hybrid model was evaluated during the experiment. Sixty trials were presented to four subjects: thirty trials for P300 presentation and thirty trials for MI. During the second thirty trials, the P300 stimuli were also presented but the subjects were not supposed to pay any attention to the stimuli. Empirical results indicated that subjects could achieve good control over the hybrid BCI. In particular, subjects could switch spontaneously and reliably between the two brain activity patterns. The hybrid classification reached an average P300 classification accuracy of 82% and the hybrid system reached an average MI classification accuracy of 71%. In conclusion, the performance of the hybrid system allows for the reliable control of devices such as robots.
SSVEP-Mi Based BCI
In [66], the proposed hybrid BCI was evaluated during the task and was applied under three conditions: MI-based BCI, SSVEPbased BCI, and MI-SSVEP based BCI. During the MI-based BCI task, two arrows appeared on the screen. When the left arrow appeared, subjects were instructed to imagine opening and closing their left hand. For the right arrow, subjects imagined opening and closing the corresponding hand. In the SSVEP task, subjects were instructed to gaze at either left (8Hz) or right (13Hz) LED depending on which cue appeared. In the hybrid task, when the left arrow was showed, subjects were imagining the left hand opening and closing while gazing at the left LED simultaneously. The task was similar to the right arrow (Figure 1). Results show the average accuracy of 74.8% for MI, 76.9% for SSVEP, and 81.0% for hybrid. The number of subjects who achieved less than 70% accuracy [4], reduced to zero from five using the hybrid approach.
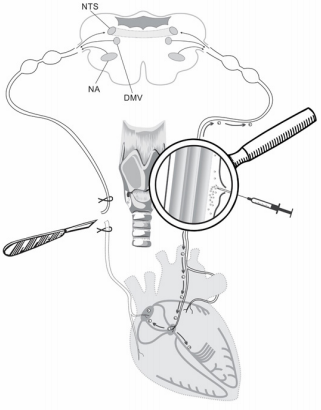
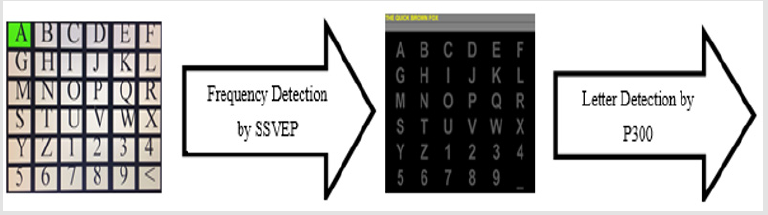
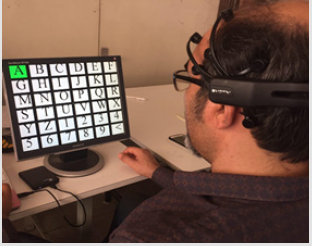
The objectives of this research consists of two parts: The first objective of this BCI research is to design a simple hybrid BCI platform that translate disabled people’s intentions into a control signal for an external device such as a computer (Figures 2 & 3). With this platform, a patient can select items from a (6×6) matrix on the screen in order to spell characters or phrases. To achieve this, we use two-modality (Steady state visual evoked potential & P300 Potential) sequentially for detecting desired character and we expect to improve the performance of the single-modality (only SSVEP or P300) BCI systems. The second objective of this BCI research is to use a low cost device for recording brain signals instead of expensive device that gives us good performance relatively.
Experimental Setup for Dataset II of Berlin BCI Competition III P300 Speller
We performed initial experiments with the P300 datasets from the BCI competition 2004 [5] to test and compare the efficiency and reliability of our P300 speller-based BCI approach. First, the competition dataset description is presented, and then is discussed; the experiment step followed by data preprocessing and feature extraction step, and classification training and validation step.
The Competition Dataset Description
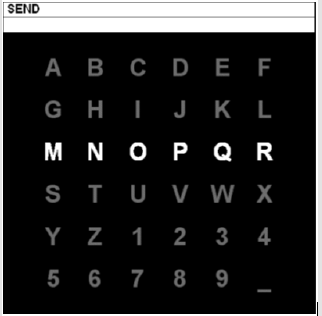
This competition dataset indicates a complete record of P300 evoked potentials recorded with 64 channel EEG according to 10- 20 system by BCI2000 software. The user was presented with a 6 × 6 matrix of characters as shown in Figure 4. The user should focus attention on characters in a word (for example one character at a time). All rows and columns of this matrix randomly intensified at a rate of 5.7Hz. Two out of twelve intensifications of rows or columns contained the desired character (i.e., one particular row and one particular column). The responses evoked by these infrequent stimuli (i.e., the 2 out of 12 stimuli that did contain the desired character) are different from those evoked by the stimuli that did not contain the desired character and they are similar to the P300 responses reported originally by Farwell et al. [6]. The signals are collected from two subjects (A and B) in five sessions and each session includes a number of runs. In each run, the subject focused attention on a series of characters. Afterward, each row or column in the matrix is intensified randomly for 100ms. After intensification of a row/column, the matrix was blank for 75ms. Row or column intensifications were block randomized in blocks of 12. The sets of 12 intensifications repeated 15 times for each character epoch. For example, any specific row/column is intensified 15 times, thus there were 12×15 =180 intensifications totally for each character epoch that 2×15 = 30 of them is caused P300. Each character epoch was followed a 2.5 s period and during this time, the matrix was blank. This period informed the user that this character was completed and the user could focus on the next character in the word that displayed on the top of the screen. As mentioned above, the goal in the competition is to use the training data with label of both subjects A and B to predict the character sequences in the test set of each subject. Finally, the recorded data converted into four MATLAB. Mat files, one training with 85 characters and one test with 100 characters for each of the two subjects A and B.
Data Processing and Feature Extraction
Before processing the signals, we should preprocess them because we only interest in part of the EEG signals occurring after each intensification and we want to build some features that can be fed to a classifier. At first, since the evoked potentials appear about 300ms after the stimulus, we understand that this window is large enough to get all needed time features for a classification. Initial sampling frequency was at 240Hz. We filtered with an 8-order band-pass filter (Chebyshev Type I) which cut-off frequencies are 0.1 and 10Hz and we down sampled to 24 samples. After filtering, we normalized the data to an interval of [-1, 1]. We used only one channel (Cz electrode) through the 64 channels to extracting the stimuli for plots and analysis. To perform the classification, we averaged all 15 intensifications and showed averaged P300 responses over Cz channel among all training samples. The data is labeled as a target or non-target set corresponding to the matrices including the event cue onset such as Stimulus-Code, Stimulus-Type and Flashing prepared with the datasets. If the averaging is applied, datasets are averaged based on target and non-target bases. Due to facilitating and avoiding the errors, the signals should have divide into the sections that start to intensify in one row/column and to be continue for 1 sec (equivalent to 240 samples).
Data was recorded by 64-channel EEG with 10-20 system, but it is necessary to choose appropriate channels because of the number of channels and the calculation’s volume are high. In feature extraction step, we use only seven channels through 64 channels consist of Cz, Pz, C4, C3, Fz, Po8 and Po7 [7]. The 240 time samples are used as features that we down sample them to 24 samples (feature dimensions are 7 (channels) ×24 (samples)). The extracted features scaled to zero mean and unit variance to feed to the classifier. Scaling constants computed for each channel from all trials in the training set and then applied to the testing data. It is important since scaling each trial individually could destroy important amplitude information characterizing the P300.
Machine Learning
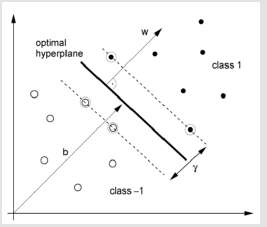
After preprocessing the training data sets of both subjects (A and B) and extracting distinct P300 wave features, the classifier is trained. The svmtrain function is used for training the classifier and the svmpredict function is used for predicting the character in MATLAB. We used Support Vector Machine (SVM) as classifier. Support vector machine is a practical learning method based on statistical learning theory and have been successfully applied for classification and regression in various domains of pattern recognition. SVM which has been introduced by [8] aims to separate data into two classes using the best hyperplane to solve classification problems. In this research, we used SVM for classifying EEG signals to detect presence or absence of the P300 component in EEG ERP that is very important for the P300 speller paradigm in field of BCI. For the support vector machine, the Libsvm open source is used. Main features of Libsvm include different SVM formulations, efficient multi-class classification, Cross validation for model selection, probability estimates, various kernels and Weighted SVM for unbalanced data. A kernel function with a second order radial basis (Gaussian) and C = 0 are used. Different values of hyperparameter C has been tried as mentioned in [9]. The study proposed in the competition winner, introduced the use of the ensemble classifiers method and showed the best results for the BCI competition.
Process of Characters Prediction in the Test Set
Test sets are processed similarly to the training set and then fed to a classifier. For the competition, performances is evaluated based on the correctness of predicted characters in the test sets. We showed target character sequences as announced in the competition and predicted the character in each epoch then the correct characters from labeled data are obtained in percentage whether the resulting character is or is not correctly predicted. We used the labeled training data to predict the character sequences in the test sets.
The Design of the Proposed Visual Stimuli
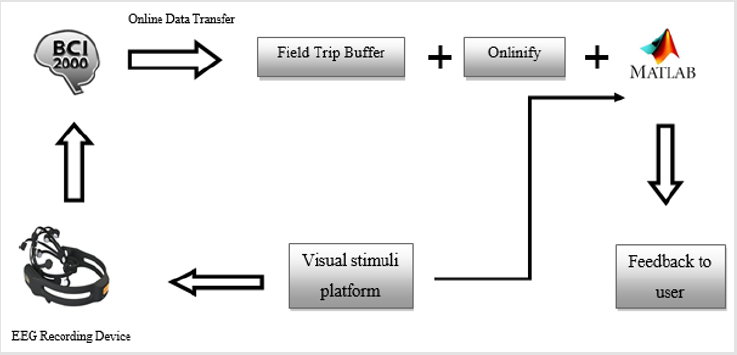
After reviewing the literature and studying several paradigms used for testing the reliability of the SSVEP and P300 in different applications, we decided to use two types of paradigms that enable the user to interact with visual stimuli and evoke the SSVEP and P300 wave. To design our paradigms, we used MATLAB GUI, Psych Toolbox MATLAB and BCI2000 platform. Before describing the platform design, we would like to introduce general implementation diagram as shown in Figure 3. According to the above block diagram, general process performed in this research consists of several steps that we describe them briefly; EEG recording device that we used is EMOTIV Epoc headset in our research and it records the brain signal after applying stimulation and sent it into a receiver module that is connected to a computer through USB port. BCI2000 software is used to save and transfer data to MATLAB. Fieldtrip Buffer can transfer data to MATLAB by onlinify code in real-time or process them in future and then classification results of system, give feedback to user for next action. For all experiments, we should perform all above steps to collect considered data.
The SSVEP Speller Paradigm
For designing SSVEP speller, we create a periodic stimuli mechanism with six low-range frequencies by a MATLAB Psych Toolbox that is used to evoke the SSVEP. The Psych toolbox is a software package that adds this capability to the MATLAB application on windows and Linux computers. MATLAB and Psych toolbox environment is flexible and relatively easy to learn. We used Psych toolbox version 3 (PTB-3) that is a free set of MATLAB functions for vision and neuroscience research. It makes it easy to synthesize and show accurately controlled visual and auditory stimuli and interact with the observer [10]. As described in chapter 2, the SSVEP is a periodic response evoked by a visual repetitive stimulus and it can be detected from the visual cortex. We use only six frequencies in the matrix. First, we designed SSVEP visual stimuli in MATLAB GUI with frequencies of 8.18, 8.97, 9.98, 11.23, 12.85, and 14.99 due to one of articles that we studied [11]. As shown in Figure 4, yellow lines are used to demonstrate the lack of repetitive frequencies appearing in the same column or row and all of squares flicker at different frequencies in each row or column. This platform had three problems:
a) The first problem in this platform can be referred to choosing the frequencies. Some of these frequencies were not match with refresh rate of MATLAB GUI and monitor.
b) The second problem was which frequencies were interrupted a short time after activity and this problem caused us to be faced with many errors. Because of this, we decided to switch to another platform design and software.
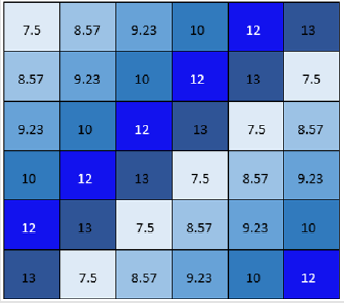
c) We did not pay attention to monitoring refresh rate. The visual stimulator plays an important role in a SSVEP based BCI that can be presented using flicker on a computer screen. In a 60Hz refresh rate monitor, there are 60 frames per second and the frame number per cycle is a constant. For example, we can use stimulus frequencies at 7.5 Hz (eight frames per period), 8.57 Hz (seven frame per period) and the number of frames is calculated by dividing monitor refresh rate (60 HZ) to flickering frequency (60/7.5=8 frames). Therefore, when we use a framebased design to ensure a flicker’s frequency stability, the number of stimuli is limited with the refresh rate of a monitor. Our second platform that is designed by Psych toolbox solve the previous problems. We choose six frequencies, which set at 7.5, 8.57, 9.23, 10, 12 and 13 Hz and are selected due to the several causes:
a) The SSVEP amplitude in the frequencies of 6-15 Hz is higher than the other frequency bands [68, 69] and desired frequencies are selected corresponding to our monitor refresh rate.
b) The stimuli with harmonic frequencies cannot be used for SSVEP detection [10].
c) The larger differences between frequencies will benefit the detection of the target frequency.
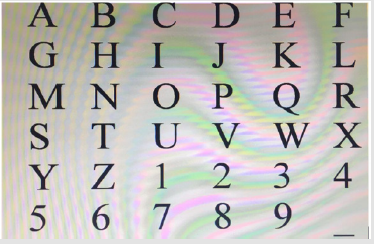
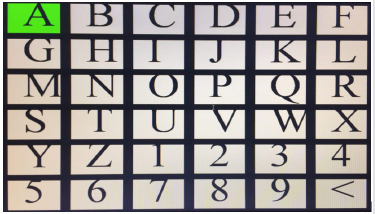
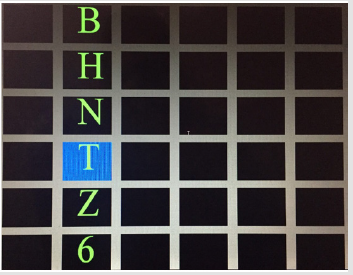
In addition, we design two types of SSVEP paradigms with Psych toolbox that are shown in Figures 5 & 6 and In Figure 5, we put together all squares without space and in Figure 6, we put together all squares with space and after recording data from both paradigms, we compare their performance. In Figure 7 frequencies layout due to our SSVEP design is shown with different colors and each color is related to a frequency. The P300-Speller Paradigm. The P300 speller paradigm use visual stimulation enabling to write by spelling. Our paradigm is designed by MATLAB Psych toolbox. To create visual stimuli for P300 speller, we use row-column (RC) paradigm as described in chapter 2. This panel is similar to RC paradigm that is introduced by Farewell et al. [6]. The method consists of displaying a 6×6 matrix composed by the numbers and letters as shown in Figure 7. Target letter is demonstrated to user with blue color in training run. Rows and columns of the matrix are successively highlighted. When the row or the column contains the chosen letter, a P300 ERP appears in EEG signal. In P300 paradigm, Synchronization is an important parameter to design because the P300 potentials are very hard to detect in EEG background. In this paradigm, we tried to show that time of onset intensification match with our EEG system results (signals recorded by our EMOTIV device) when we synchronize events accurately. To be more precise signals recorded by our EMOTIV device shows it’s a target or nontarget when the stimulus is on the screen. Since that our data are read from field trip buffer and there is a delay time, our platform was not reliable to BCI systems in order to type letters. Therefore, for solving this problem, we decide to use BCI2000 platform that do not have these problems. (Figures 8 & 9) shows BCI2000 row/ column P300 speller platform that is derived from Donchin’s matrix speller paradigm [12,13].
The P300-SSVEP Speller Hybrid paradigm
In this research, we design two-stage hybrid BCI with using two evoked potential detection patterns (SSVEP and P300) sequentially. The first protocol of acquisition is defined by SSVEP method and second by P300 as presented in Figure 10. Our main goal was that both paradigms are designed using same software (Psych toolbox), while in the last design our first platform is designed using Psych toolbox MATLAB and our second platform is designed using BCI2000 software. To design SSVEP, we used Psych toolbox that is described in section 4.3.1 and for P300 we used BCI2000 platform that is introduced in section 4.3.2. The general concept of our hybrid BCI system is demonstrated in Figures 11 & 12. SSVEP task is designed to frequency detection through six selections because we have only six frequencies that each frequency belongs to six characters (one row or one column). One of the six selected characters is target character that is determined by P300 task. P300 task is implemented by BCI2000 platform.
Implementation of Offline SSVEP Speller Using EMOTIV EPOC
Our data are recorded from 14 channels by the means of EMOTIV EPOC Neuroheadset and are transferred to MATLAB via BCI2000 so that we used a MATLAB toolbox to make online analysis of EEG data transferred by BCI2000. It used Fieldtrip Buffer to transfer data to MATLAB in real-time. Obviously, fieldtrip buffer and BCI2000 must be available and they must be added to the MATLAB path. This BCI system is non-invasive and synchronous. Five healthy subjects (one female and four males) with age between 23 and 38 years participated in initial experiment as volunteer. The purpose of the required task was explained to subjects in detail before preparation for the EEG recording. For SSVEP detection, we design two platforms as we descried in section 4.3.1 and then we compare them.
The initial experiments is performed in a normal and quiet laboratory room, after preparation for the EEG recording, the subjects seated in a comfortable chair in front of the LED FLATRON monitor. First, we performed experiments in SSVEP Condition with simple paradigm, which is available at this site http://omidsani. com/. Then we started our tests with our both paradigms (with space and without space) show one of the SSVEP experiments in the laboratory. Only six frequencies used in two paradigms that set at 7.5, 8.57, 9.23, 10, 12 and 13 Hz. All five subjects participated in all experiments in six sessions so that each session includes three runs. Totally, all subjects should take part in eighteen runs and subjects should focus on one special character for along 15 and 40 seconds to detect frequency in each run. All of conditions are same for two experiments. Between each run, we considered 2-second rest time to avoid subject fatigue. Finally, we recorded EEG signals for all five subjects in offline runs and after processing them, we calculated classification accuracy, averaged accuracy and standard derivation.
Implementation of Offline P300 Speller-based BCI System Using EMOTIV EPOC
First, we performed experiments in P300 condition with Psych toolbox paradigm and then we started our tests with BCI2000 paradigm. One healthy male subject (38 years) are participated in these experiments. Each session included a number of runs. In each run, the subject focused attention on a series of characters. The sets of 12 flashing repeated 15 times for each character. There were 12×15 =180 intensifications totally for each character. Each row/column was randomly intensified for 100ms and after intensification of a row/column, the matrix was blank for 75ms (Figure 4) shows experimental environment with platform. After finishing initial experiment, we started tests with second paradigm. The second implemented system is an offline P300 speller that used platform of BCI2000 software. In BCI2000 platform, the P300 Speller implements a BCI that uses evoked responses to select items from a rectangular matrix, a paradigm originally described by Farwell et al. [6]. In this experiment we asked user to focus on the number of the characters one by one in calibration run and then main runs. We asked the subject to consider below words one by one in P300 speller platform.
The Quick Brown Fox
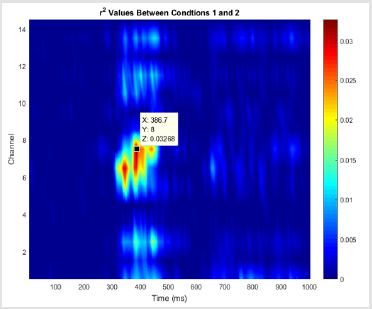
To calibrate the P300 speller for an individual subject, we first operated in a ‘copy spelling’ mode that prompts the user to pay attention to desired letters in sequence. As the user counts the number of times the desired letter intensifies in the word, a P300 response is created. The purpose of the calibration session is to de detect those features that discriminate between the desired and undesired rows and columns. After the initial runs, we used the BCI2000 offline analysis tool to determine which features correspond to row/column of the desired letter and we saw a feature map that is shown in Figure 13. In this plot, the vertical axis corresponds to the different locations, while the horizontal axis corresponds to the time after stimulus. The signals are shown at a particular location and time after stimulus in 14 channels and the color shows the value of r2 calculated between correct and incorrect row/columns. Red colors demonstrate a high correlation of the brain signal amplitude at the time/location with flashing of the desired row/column, and blue colors demonstrate low correlation. We are interested in finding large r2 values between 200 and 550ms because they had most distinction between target and non-target.
As we expected, the large r2 values between 250 and 500ms are shown and electrodes of O1 and O2 located in occipital lobe have better features than the others for our subject. We choose four best data points have r2 values 0.03268, 0.02596, 0.02506 and 0.02808 that occur at times of 386.7ms, 394.5ms, 402.3ms and 378.9ms respectively and all four data points are detected by channel eight. We could product time-course plot for target/non-target row/ columns. The target reaction was stronger than for the non-target. Then we used BCI2000 P300 classifier tool that determines optimal features such as channels and signal times corresponding weights. After calibration run, we started main runs. We asked a 38-years male to focus on each character one by one in P300 Speller. We considered two string characters as shown below:
First String of Characters: BROWNTHE_MANCATDOGFAKHRSHAM
Second String of Characters: GBADMANGFTMKHODATF
The first string of characters is used as train data and the second string of characters are used as test data. Experiment conditions was similar to initial test. There were 180 intensifications totally for each character. Each row/column was randomly intensified for 100ms and after intensification of a row/column, the matrix was blank for 75ms and stimulus duration last 175ms for each intensification. To focus and avoid distraction of user, we asked him to count numbers of time that desired character intensified. The data recorded with 128Hz sampling rate. We considered 2-second rest time after each four or five characters to prevent subject fatigue.
Implementation of Offline P300-SSVEP Speller Using EMOTIV EPOC
In hybrid condition, we also used the EMOTIV Epoc to capture EEG signals. One healthy subject (38 years male) is participated in offline experiment that includes two steps. In first step, the subject focused on desired character (for example A) to spell and if the frequency is detected, the characters corresponding to detected frequency are shown in another color in platform (Figure 14). In next step, the subject focused on same character (for example A) in P300 paradigm that finally target character is detected. SSVEP task last 15 second for each character and P300 task take long 31 second in each run.
EEG Signal Processing and Machine Learning Algorithms
a) Data Acquisition: In the data acquisition part of the BCI application, the selected input is acquired by the recording electrodes, amplified and digitized. Our data are recorded from 14 channels by the means of EMOTIV EPOC Neuroheadset that are transferred to MATLAB via BCI2000 or without using BCI2000 are read from fieldtrip buffer directly.
b) Pre-processing Methods: The pre-processing stage provides the signals in a suitable form for further processing, so careful selection of preprocessing steps is crucial to the success of any classification scheme. Appropriate application of preprocessing steps can decrease data dimensionality and emphasize portions of the data with discriminative power, thereby reducing computation time and improving classification rates. For SSVEP, we used Fast Fourier Transform (FFT) and Power Spectrum Density (PSD) in pre-processing stage. For P300, we used averaging in preprocessing stage. PSD finds the power density for filtered EEG recordings. Mathematically, PSD is defined as a Fourier Transform of the autocorrelation sequence of the time series. One of the non-parametric power spectral density estimation methods is Welch method that it divides the EEG signal into overlapped windowed segments and then average the periodograms for all segments. Welch method uses windowed segments to reduce the effect of the discontinuity of the segments.
Signal processing and Classification:
a) Canonical Correlation Analysis (CCA): We used Canonical Correlation Analysis (CCA) method for SSVEP frequency detection in this thesis. The CCA is used to process the SSVEP data and the Fourier Transform (FT) is used to evaluate the performance of the CCA. CCA is generally used for finding the correlations between two sets of multi-dimensional variables. Before using CCA method for SSVEP detection, we asked users to perform the training stage to each frequency for 60 sec. Then, the resulting signal is analyzed to two-second blocks that for each of these two-second window blocks, the CCA coefficients corresponding to each frequency are calculated. Therefore, after acquiring training data for each user and each two-second window size of its signal, create a six-labeled data (label 1 denoting observed frequency by user). Then, we used Logistic Regression (LR) method to detect SSVEP event and in result, generated vector of coefficients that were inner multiplied in the feature vector. Finally, for frequency detection we used CCA method and obtained results for each subject.
b) Support Vector Machine (SVM) & Stepwise Linear Discriminant Analysis (SWLDA): SVM analysis also has three main steps: Data processing to ease later analysis, SVM classifier training on the labeled training set, test set classification using the trained SVM classifier. SVM classifier and SWLDA classifier are used for P300 speller classification separately and then we compared these two methods.
Evaluation
a) Classification Accuracy (CA): We calculated classification accuracy to evaluate our experiments and compared results of our tests that was calculated with following formula:
Classification accuracy = (the number of sample cases correctly classified/ total number of sample cases) ×100.
Results of BCI Competition Data Sets
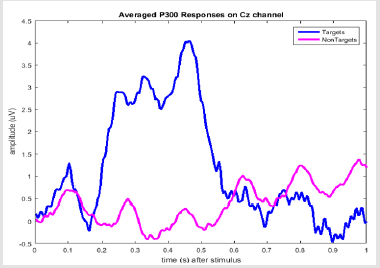
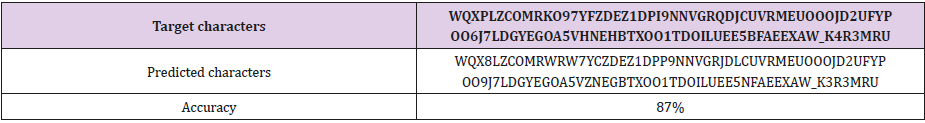
In 2004, a BCI competition was held and the sets of this competition are available for free on the website of the competition. In this competition, one of the datasets is obtained from a complete record of P300 evoked potentials recorded with 64 channel EEG according to 10-20 system by BCI2000 software. Some of the typed characters were said to the participants and they should have achieved another typed characters by signal processing. In this thesis, we also processed the same datasets and obtained the relatively good accuracy. We used 8-order band-pass filter (Chebyshev Type I) for pre-processing and a SVM classifier with Gaussian kernel was used for classification (Figure 15) presents the mean signals averaged over all training signals for the channel Cz for both target and non-target. As expected, the blue curve demonstrates the target (with P300) and the pink curve shows non-target (non-P300) in time course of average signal waveforms at Cz channel. This Event Related Potential occurs around 250- 500ms after the stimuli that is acceptable. Illustrates results of classification character with SVM classifier. SVM is trained with 85 known characters in training phase then we can detect 100 unknown characters with relatively good accuracy (87%). These classification results are achieved for subject A.
Results of Proposed Offline SSVEP Speller Classification
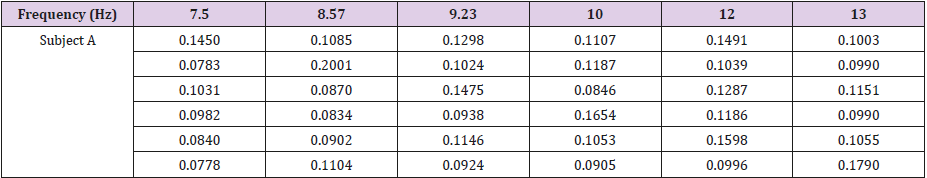
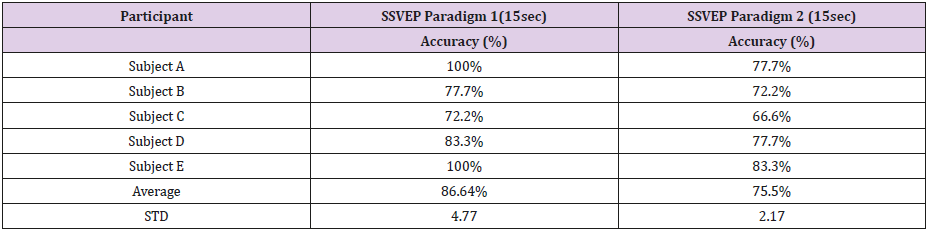
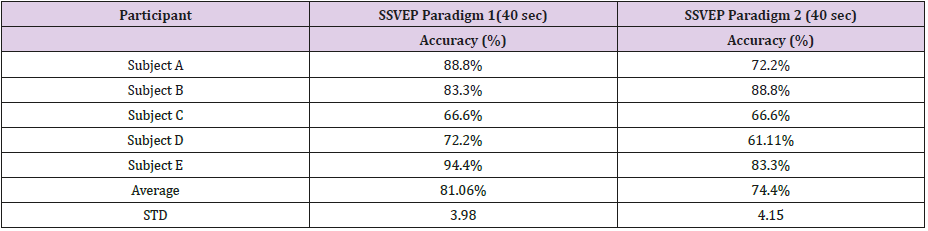
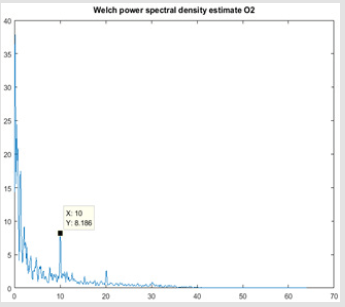
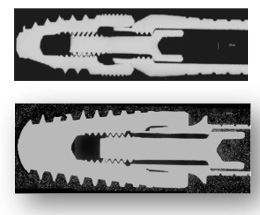
As we described in chapter four, the experiments were performed for five healthy subjects in eighteen runs. For SSVEP detection, we estimated power spectral density for each frequency. Obtained results from welch power spectrum estimation for 10Hz frequency are shown in Figures 2 & 3 at only over O1 and O2 electrodes. The first harmonic frequency of 10Hz is shown in 20Hz. We used CCA method and then evaluated our results with classification accuracy as shown in Tables 1 & 2 shows the results of CCA method of subject A for one run (15 sec). The numbers that are shown in red color are maximum value of each group as frequency detection through six frequencies. These six columns are corresponding to PSD peak in six frequencies. The histogram of frequency detection using CCA for 10 Hz is shown in Figure 5, Table 3: Offline Performance Comparisons Between Two SSVEP Paradigms (40 sec). In Table 4, we compare performance of two SSVEP paradigms that we proposed in this thesis for 15 seconds. SSVEP paradigm 1 performed better than SSVEP paradigm 2 with averaged accuracy 86.64 and 75.5 respectively. In Table 4, we compare performance of two SSVEP paradigms for along 40 second. SSVEP paradigm 1 performed better than SSVEP paradigm 2 with averaged accuracy 81.06 and 74.4 respectively.
Results of Proposed Offline P300 Speller Classification
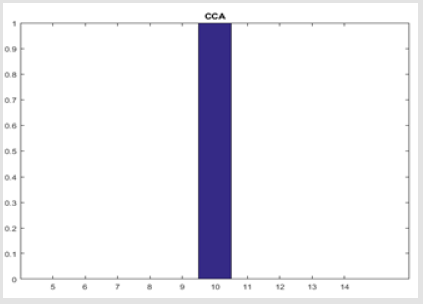
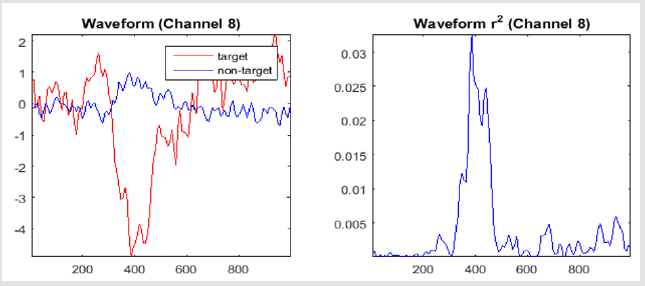
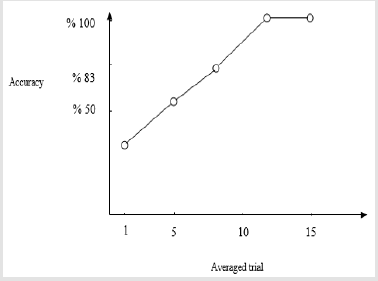
As we described in chapter 4, we designed a P300 Speller paradigm with MATLAB Psych toolbox and collected data from this platform. Before classification, we got average from all trials for each subject that specifies target and no-target plot (Figure 5) shows target and non-target plots for character O at O1 electrode with our platform that is not acceptable to detect P300 because onset of our stimulation was not synchronized with onset of recording through the fieldtrip buffer (Figures 16-19). In order to obtain results from our platform, we had to use BCI2000 platform and acquired new data from it. All data collected from suitable conditions as we presented before. (Figure 20) shows example of averaged signal over O1 channel for character H. sampling rate is 128 Hz. Classification accuracy calculated from BCI2000 platform by SVM classifier for one subject is shown in Table 5. 5-fold cross validation is done. The data set is divided into 5 subsets, and the k-fold method is repeated 5 times. Each time, one of the 5 subsets is used as the test set and the other 4 subsets are put together to form a training set. Averaged accuracy is performed on different trials. The results of SWLDA classifier of BCI2000 are shown in Tables 5 & 6. Waveform plot is produced by the offline analysis for channel 8 is shown in Figure 21. In left figure, Waveform of target or non-target for channel 8 is shown and in right figure, waveform of r2 due to the topographic feature map in chapter 4 is shown. As shown in Figure 22, we showed graph of accuracy in terms of number of averaged trials according to (Tables 5 & 6). We achieved 100% accuracy from the 12th trial with SWLDA classifier.
Results of Proposed Offline Hybrid Speller Classification
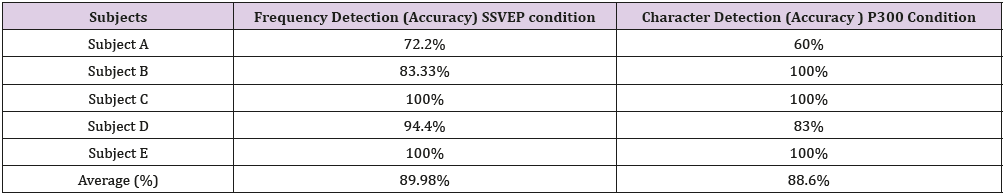
For our hybrid BCI system in offline experiments, we achieved classification accuracy for both of tasks consist of SSVEP condition and P300 condition that have been shown in Table 7. Three subjects are participated in these experiments. Each subject focused on one character on first platform (SSVEP) for 15 seconds to frequency detection then the subject focused on another platform (P300) for character detection for about 31 seconds. In first step, frequency of the desired character is detected and then all characters with the same frequency are changed to another color in SSVEP platform. In second step, the desired character is identified through six frequencies in P300 platform. This time includes 15 trials. The results obtained from five healthy subjects show that an offline classification accuracies of 89.98% and 88.6% were achieved using the proposed hybrid BCI speller.
In this project, we have investigated a hybrid BCI system sequentially to purpose to type letters for disabled people. The whole system includes three main parts: design visual stimuli paradigm for SSVEP detection, P300 detection and hybrid detection. The experiments are performed using EMOTIV Epoc device. We succeed to create an acceptable platform for each experiment and get suitable data that are used in signal processing step. Since CCA had been used successfully in many BCI applications, we used CCA to classify the SSVEP data and frequency detection. SWLDA and SVM are used for P300 detection and we conclude that both methods are suitable for P300 classification. We designed a hybrid SSVEP-P300 BCI platform with the random flashings and periodic flickers to evoke the P300 and SSVEP simultaneously that we did not result.
Then, we decided to design a sequential hybrid BCI platform by same software but we could not detect P300 response from its collected signals. Finally, we designed a hybrid SSVEP-P300 BCI platform by two different software. Our hybrid BCI system consists of two sections including SSVEP condition and P300 condition. In first section, as respect we had only six frequencies in a 6×6 speller matrix, we should detect one-group characters with the same frequencies through six groups. In second section, we must detect desired character that there is in selected group in previous section. This hybrid system can help to SSVEP condition to choose more commands using P300 condition so that it can help to increase the number of commands from 6 to 36 commands. In our system, we can achieve only six choices by SSVEP condition.
More BJSTR Articles: https://biomedres01.blogspot.com/