Showing posts with label journal of scientific and technical research. Show all posts

Friday, June 24, 2022

Diaphragmatic Eventration in Nf1 Microdeletion Syndrome: A Rare Association Unmasked by Pregnancy

Diaphragmatic Eventration in Nf1 Microdeletion Syndrome: A Rare Association Unmasked by Pregnancy

Introduction

Neurofibromatosis type 1 (NF1), also known as von Recklinghausen disease, is a neurocutaneous condition with an estimated prevalence between 1 in 2000 to 1 in 4000, characterized by a great variability in its clinical presentation. Clinical hallmarks such as café au-lait macules, neurofibromas, axillar or inguinal freckling, optic pathway glioma and iris hamartomas (Lisch nodules) represent the main NF1 diagnostic criteria set by the U.S. National Institutes of Health (NIH) in 1988 [1]. Beside these typical signs, the possible association with skeletal, endocrine, cardiovascular and oncologic complications make NF1 a multi-systemic disorder [2]. A similar broad spectrum of clinical manifestation is caused by mutations occurring in the Neurofibromin on co suppressor gene, on chromosome band 17q11.2, and inherited in an autosomic dominant manner [3]. In about 5–10% of cases takes place a large deletion involving the NF1 gene and its flanking regions which results in the “NF1 microdeletion syndrome” [4]. Despite the lack of genotype–phenotype correlations in NF1, patients with Type 1 microdeletion (1.4 Mb encompassing about 14 genes) typically present a serious illness, mainly characterized by dysmorphic facial features and developmental delay [5]. During pregnancy, NF1 women should be monitored because they are more prone to complications such as hypertension, preeclampsia, fetopelvic disproportion, poor fetal growth and oligohydramnios [6]. Furthermore, pregnancy for NF1 women is related to an increased number and size of cutaneous neurofibromas [7]. Regarding pregnancy in women with NF1 microdeletion, no specific literature data are available, possibly due to their low fitness and to the rarity of the condition.

Diaphragmatic defects have never been described before as a pregnancy complication in NF1 women. Similar conditions are also unusual in general population, with only 56 reported cases until 2018 [8]. The increased abdominal pressure experienced by women during pregnancy might represent a risk factor for unmasking hidden congenital diaphragmatic defects (CDD). Among these defects, diaphragm eventration (DE) represents an uncommon finding, defined as the upward displacement of a portion or the entire diaphragm, otherwise intact. Congenital DE (CDE) diagnosis is often an incidental finding in adults, as it can remain completely asymptomatic. Even if scarcely described first presentation of CDD during pregnancy, owing to the risk of rupture, represents a lifethreatening complication both for mother and fetus [9]. Here we report a case of (CDE) complicating the pregnancy of a 30-year-old patient with NF1 Type 1 Microdeletion Syndrome.

Case Report

The patient is a 30-year-old pregnant woman, affected by NF1 type 1 microdeletion syndrome, followed since the age of 24 at our Clinical Reference Centre for NF1. She has undergone numerous clinical and instrumental evaluations over the years; the main clinical issues that have emerged are summarized here: mild intellectual disability, typical NF1 cutaneous features (cafè au laits spots and diffuse cutaneous neurofibromas) and two plexiform neurofibromas on the scalp and on the left hemiabdomen. Furthermore, multiple spinal neurofibromas were reported at the age of 26, involving all the conjugation foramina, especially in the thoracic and lumbar tracts of the spine. At the age of 28 due to a suspected diagnosis of pheochromocytoma, the patient underwent left adrenalectomy; histological examination diagnosed a ganglioneuroma and steroid replacement therapy was therefore introduced. In addition, a nonfunctioning pituitary microadenoma was detected on routine brain magnetic resonance imaging (MRI), steady in size on control MRI in the following years. In view of these comorbidities, as the patient got pregnant, she was followed by a multidisciplinary team, consisting of gynecologists, endocrinologists, neurologists and medical geneticists. Regular ultrasound evaluations were performed throughout the entire pregnancy. The patient and her partner decided not to proceed with any invasive tests for prenatal diagnosis.

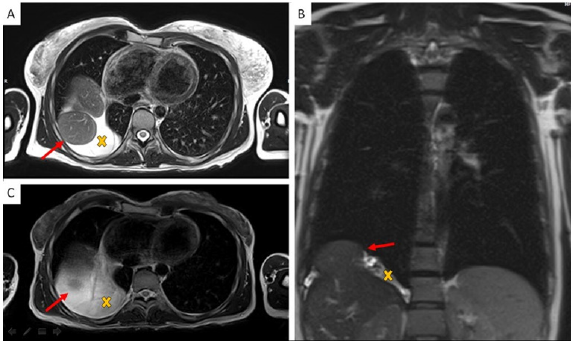
The pregnancy progressed regularly. In preparation of spinal anesthesia, a spine MRI was performed to monitor the wellknown spinal neurofibromas that appeared to be steady in size and number. Serendipitously, three round-shaped images at the base of right chest were reported and interpreted as possible diaphragmatic hernia (DH) with partial displacement of the liver to the chest. A right-sided pleural effusion was also reported, which retrospectively appeared to be present and unchanged since the previous control. An echocardiogram and an abdominal ultrasound were performed as follow-up investigations. The former reported mild mitral and tricuspid insufficiency, but no pericardial effusion was observed. The second examination showed a moderate pleural effusion on the right side with thin fibrinous septae and gross outpouchings of the liver parenchyma, the largest of almost 4cm. Thus, the previous suspicion of DH was confirmed. In view of the numerous comorbilities, a caesarean section was performed and the patient gave birth to a female newborn. Genetic NF1 analysis performed after birth revealed the transmission of the maternal NF1 microdeletion to the baby. Since both the mother and the newborn were in good health, they were discharged five days after delivery, once DH-related complications were excluded. Computed Tomography (CT) of the upper abdomen performed two months later showed three diaphragmatic bulges, with a maximum diameter of 4.2cm on the VIII segment of the liver and of 4.8-2.8cm on the VII segment. The right-sided pleural effusion was still present and, as the diaphragm was not clearly visible over hepatic protrusions and appeared worsen from previous imaging, the hypothesis of hernias was corroborated (Figure 1). Therefore, surgical correction of the defect was planned after the weaning of the child. The patient underwent video-assisted thoracoscopic surgery (VATS), which revealed an intact but very thin diaphragm, consistent with a diagnosis of DE. There was no evidence of occult neurofibromas nearby, nor adjacent lesions that might be the very first cause of the diaphragmatic eventration. In addition, a voluminous pleuro-pericardial cyst was found, explaining the pleural effusion previously reported. Finally, a diaphragm plication and cyst excision were performed. The removed tissue was biopsied and this examination revealed the presence of a cystic wall, covered by a single stratified cubic-cylindrical epithelium. No atypia was found. The post-operative course was uneventful.

Figure 1: Chest MR Imaging:

A. Two round shape images with partial liver shift in right pleural space (red arrow) and surrounding fluid collection (yellow X);

B. Coronal plane;

C. MR imaging three years before pregnancy.

Discussion

Diaphragmatic weakness became clinically relevant during pregnancy, when the rising abdominal pressure pushes the diaphragm upwards while the muscle itself contracts downwards. In our patient, these two opposing forces probably enlarged a preexisting diaphragmatic defect, resulting in liver herniation. To our knowledge this is the first reported case of a patient with NF1 microdeletion showing a DE and a pericardial cyst, three extremely rare conditions. Fortunately, the liver was the only organ involved in herniation and the patient remained asymptomatic, even during pregnancy. As mentioned, among NF1 population, patients with type 1 microdeletion generally display a more severe phenotype. This is possibly due to the deletion not only of the NF1 gene, but also of its flanking genes, which could partially influence the clinical manifestation of the disease. In particular, NF1 type 1 microdeleted patients are more likely to develop malignant peripheral nerve sheath tumors (MPNSTs), cardiovascular anomalies [5] and connective tissue abnormalities [10]. Although the precise molecular basis of connective tissue involvement in NF1 is still unclear, neurofibromin has been shown to play a regulatory role in mesenchymal stem cell differentiation [10]. Moreover, during embryogenesis, this protein also takes part to axons’ elongation in order to ensure the correct activity of the nervous system [11]. The involvement of NF1 gene in proper neuronal and mesenchymal development must be particularly stressed as neurons and connective tissue, together with several other structures from different embryonic origins, participate to the complex sequence of events that leads to diaphragm development [12]. In particular, CDE has been related to defects in migration and proliferation of muscle fibres, two steps leaning on the regulatory action of connective tissue cells [13].

Whether the association between NF1 and CDE is causal or is in fact a possible associated complication, the management of our case demonstrates the crucial importance of a multidisciplinary approach to pregnant women affected by a rare disease. NF1 microdeletion syndrome is associated with numerous comorbidities, most of which are just barely known. Particularly, knowledge about pregnancy-related complications in NF1 microdeleted women is still lacking and even more about possible urgent events; as a consequence, no specific management guidelines are available yet. As shown by our case report, pregnancy in these women can turn out to be a challenging moment and should be carefully supervised, as it represents an event in which the delicate equilibrium of such fragile patients might unbalance, possibly leading to unexpected, unknown and potentially serious complications. In our opinion the complexity of this condition, the unpredictability of complications’ onset and severity can be properly managed only by gaining a wider and multifaceted vision of the disease, which can be obtained only by means of a dedicated multidisciplinary team. A well-coordinated multi-specialized equipe could represent the primary step towards widening our perspective of the condition and towards implementing tools for personalized care and follow-up, with the ultimate aim of ensuring early diagnosis and prompt management of possible upcoming emergencies, especially during pregnancy in these vulnerable women.

For more Articles on : https://biomedres01.blogspot.com/
Monday, May 23, 2022

Nutrition Knowledge, Dietary Diversity and Nutritional Status of Adolescents in Three Selected Local Government Areas of Ibadan Municipality, Nigeria

Nutrition Knowledge, Dietary Diversity and Nutritional Status of Adolescents in Three Selected Local Government Areas of Ibadan Municipality, Nigeria

Introduction
Adolescence is a transitional period from childhood to adulthood which normally begins with the onset of signs of puberty, physical and mental development, involving biological, social and psychological changes occurring between 10-19 years of age [1]. Of the 7.2 billion people in the world, about 1.2 billion are adolescents aged 10-19 years, making up 16 per cent of the world population [2]. They constitute about 25 per cent of Nigeria’s population [3] and are critical target population with regard to influencing global public health outcomes. Nutritional needs during adolescence are increased because of increased growth rate and changes in body composition associated with puberty [4,5]. The dramatic increase in energy and nutrient requirements coincides with other factors such as the quest for independence and acceptance by peers, increased mobility, greater time spent at school and/or work activities, and preoccupation with self-image, that may affect adolescents’ food choices and nutrient intake [4]. Due to urbanization, globalization and technological advancement, most adolescents in the urban regions are gradually moving from the traditional diets that are primarily derived from plant-based food sources which are low in fat and high in fibre, to more western diets that are energy dense, high in fats and sugars, and low in fibre; coupled with little or no physical activity. Population-based surveys have found that adolescents often fail to meet dietary recommendations for overall nutritional status and for specific nutrient intakes [6,7].

According to the report of Abdulkarim, et al. [8], 28.8% of adolescents are malnourished in Nigeria (13.2% overweight, 11.3% stunted, 2.6% obese, and 1.7% wasted) [8]. Adequate nutrition can play significant role in prevention of several chronic diseases, including obesity, coronary heart disease, and certain types of cancer, stroke, and type-2 diabetes [9]. To help prevent diet-related chronic diseases, researchers have proposed that healthy eating behaviours should be established in childhood and maintained during adolescence [10-13]. However, the relationship between nutrition knowledge, food habit, dietary diversity and nutritional status of in-school and out-of-school adolescents has not been adequately researched in Nigeria. This study therefore, seeks to provide information on in- and out-of-school adolescents’ nutrition knowledge, food habit, and dietary diversity in relation to their nutritional status.

Methodology

The descriptive cross-sectional study was carried out in three randomly selected urban Local Government Areas (LGAs) namely Ibadan North, Ibadan Northeast and Ibadan Northwest among the five LGAs in Ibadan municipality. A total of 450 (225 In-school and 225 Out-of-school) adolescents were recruited for the study. A Five-section pre–tested interviewer-administered, semi-structured questionnaire was used to collect data on socioeconomic, demographic and household characteristics, nutrition knowledge, dietary diversity and anthropometric indices of the respondents. Nutrition knowledge was measured on a twelve-point knowledge scale which was rated as ≤8 – poor knowledge, and ≥8 – good knowledge. Dietary diversity questionnaire was used to gather information on individual dietary diversity score (IDDS) of the adolescents using the FAO recommendations [14], by scoring the number of foods consumed from each of the 14 food groups. Anthropometric measurements were done using a stadiometer to measure height and weighing scale to measure weight.

Data were analysed using descriptive statistics, Chi-square test, t-test, ANOVA and correlation at p<0.05. Anthropometric data was analysed using WHO Anthroplus to obtain BMI-for-age according to the World Health Organisation (WHO) cut-off points [1]. Ethical approval for the study was obtained from the University of Ibadan/ UCH Ethical Review Committee. Permission to collect data was obtained from the Chairmen of the LGAs, LGA Education Inspector, School Principals, Heads of Motor Parks and Market Leaders. Additionally, informed consent was obtained from the respondents before the data collection.

Results

Socio-Demographic Characteristics of the Respondents

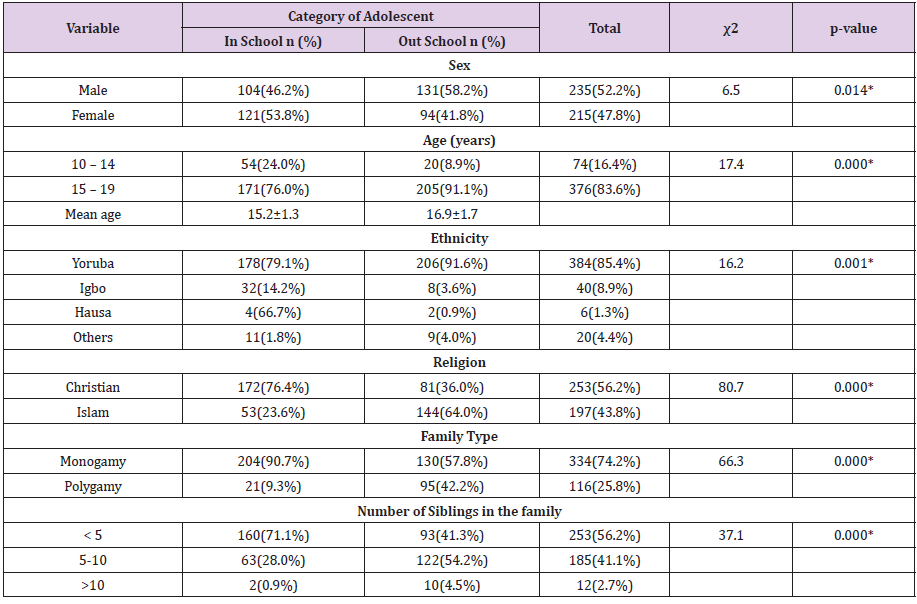
Table 1 shows the socio-demographic characteristics of the respondents. More than half (52.2%) of thee were male (46.2% in-school, 58.2% out-of-school) while female respondents were 47.8% (53.8% in-school, 41.8% out-of-school). Mean age of inschool respondents was 15.2±1.3 years, while that of out-of- school was 16.9±1.7 years. Majority (83.8%) of the respondents fell within 15-19 years age category (76.4% in-school, 91.1% out-of-school) while only 16.2% were within the ages of 10-14 years. Majority (85.4%) also were Yoruba, 8.9% Igbo, 1.3% Hausa and 4.4% other ethnic groups; with 56.2% being Christians, 43.8% Muslims, and 74.2% were from monogamous family with 56.2% having less than five siblings in the family. Socio-demographic characteristics were significantly associated with adolescent’s sex, age category, ethnicity, religion, family type and number of siblings for both inand out-of-school adolescents (p<0.05).

Table 1: Socio-demographic Characteristics of Respondents.

Note: * - Values are significantly different at p < 0.05;
n = number of respondents

Socio-Economic Characteristics of the Respondents

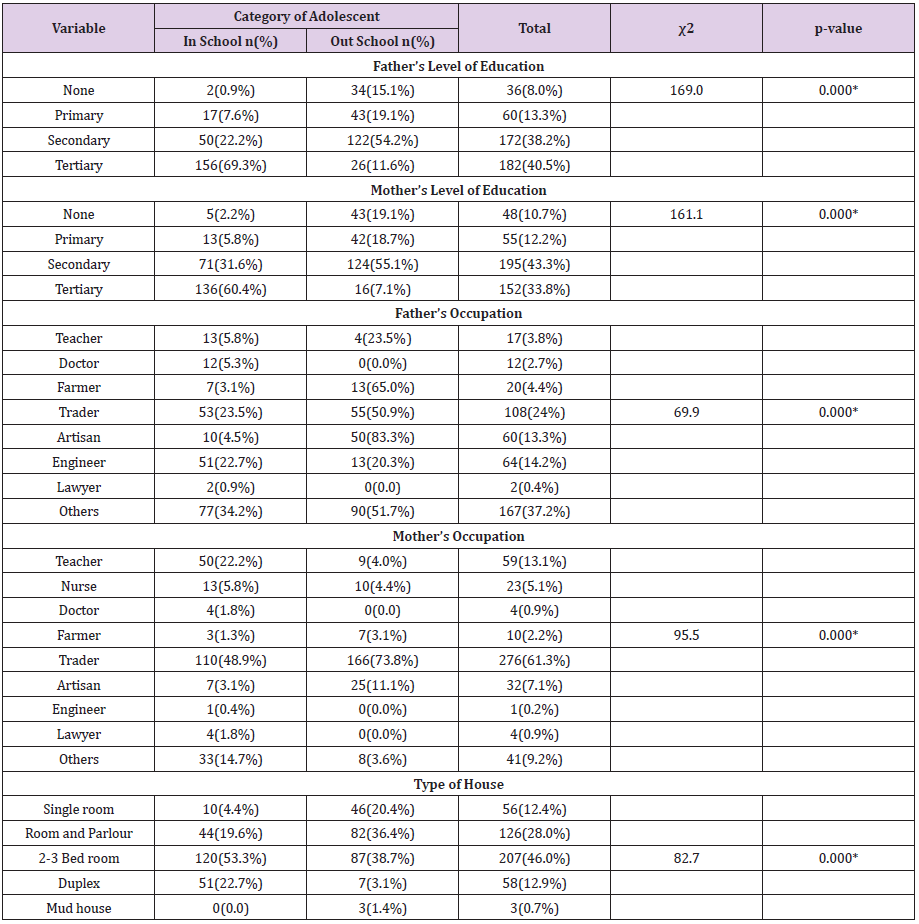
For the socio-economic characteristics of the respondents, 40.5% (69.3% and 11.6% in-school and out-of-school) of respondents’ fathers had tertiary education, 38.2% (22.2% and 54.2% in-school and out-of-school) had secondary education, 13.3% (7.6%, and 19.1% in-school and out-of-school) had primary education, while 8.0% (0.9% and 15.1% in-school and out-of-school) had no formal education, respectively (Table 2). The proportion of in-school respondents’ fathers and mothers who had tertiary education were significantly higher than that of out-of-school respondents’ parents (p<0.05). Majority of the outof- school respondents’ fathers were artisans (83.3%), or farmers (65%) or traders (50.9%), compared with 4.5%, 3.1%, and 23.5% for in-school respondents, respectively (p<0.05). Majority (61.3%) of the respondents’ mothers were traders (48.9% in-school, 73.8% out-of-school), 13.1% teachers (22.2% in-school, 4.0% out-ofschool), 7.1% artisans (3.1% in-school, 11.1% out-of-school), while 9.2% (14.7% in-school, and 3.6% out-of-school) were classified as others (p<0.05). Many (46.0%) of the respondents resided in 2 or 3-bedroom flats, 28.0% resided in room and parlour, while 12.9% and 12.4% resided in duplex building and single rooms, respectively. More of the in-school respondents resided in 2 or 3-bedroom flats and duplex (p<0.05), while more of out-of-school respondents resided in single rooms and room and parlour compared with inschool adolescents (p<0.05).

Table 2: Socio-economic Characteristics of Respondents.

Note: * - Values are significantly different at p < 0.05;
n = number of respondents

Household Characteristics of Respondents

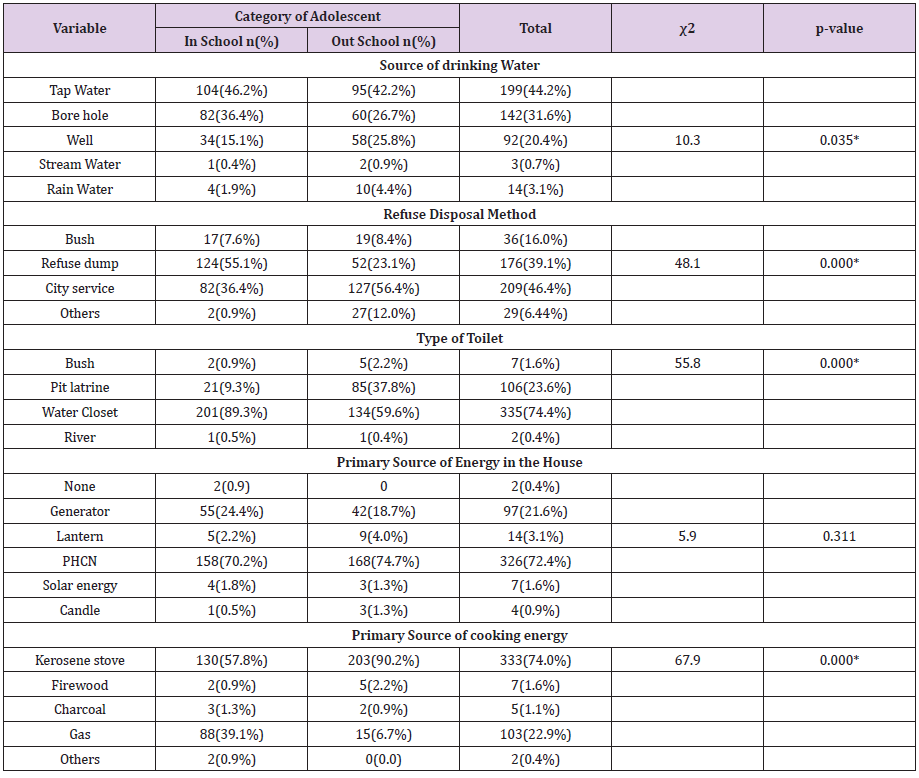
Table 3 describes the household characteristics of the respondents. Primary source of water of the respondents was mainly tap water (44.2%), followed by borehole ((31.6%), well water (20.4%) and rain water; with a higher percentage of families of in-school respondents using tap water and borehole (p<0.05), and higher percentage of out-of-school respondents using well and rain water (p<0.05). Almost half (46.4%) of the respondents made use of the city service as means of refuse disposal, while a higher percentage of the respondents (56.4%) from out-of-school compared to the in-school respondents (36.4%) (p<0.05); 39.1% (55.1% in-school, 23.1% out-of-school) made use of refuse dumps (p<0.05). Majority (74.4%) of the respondents made use of water closet, with a higher percentage from in-school respondents (p<0.05) while 23.6% made use of pit toilet, the out-of-school having higher percentage (p<0.05). Majority (72.4%) of the respondents depended on government source of electricity supply (PHCN) as the main source of energy, with no significant difference (p>0.05) between the in-school and out-of-school adolescents. Also, kerosene stove was the primary source of cooking energy for 74.0% of respondents with 90.2% coming from out-of-school while 57.8% was from the in-school respondents; while 22.9% used gas cooker, with higher percentage from in-school respondents (p<0.05).

Table 3: Respondents’ Household Characteristics.

Note: * - Values are significantly different at p < 0.05; n = number of respondents

Nutrition Knowledge and Status of Respondents

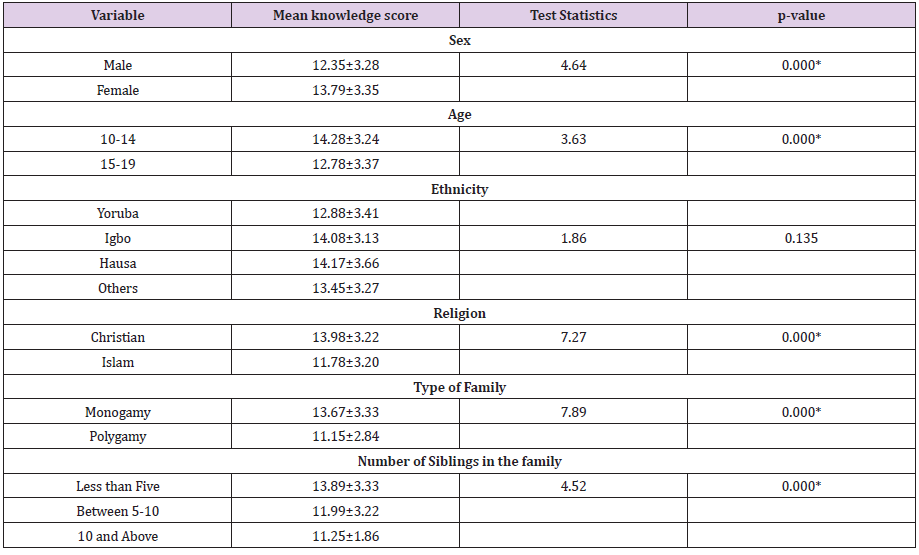
In Table 4, 58.7% of respondents had poor nutrition knowledge with majority coming from the out-of-school respondents (p<0.05), while 41.3% had good nutrition knowledge, with higher proportion from in-school respondents (p<0.05). Significant association existed between nutrition knowledge and the sex, age, religion, type of family and number of siblings of the respondents. However, no significant difference was observed between nutrition knowledge and ethnicity of the respondents (p>0.05) (Table 5). Almost all (92.8%) of the respondents had normal height-for-age, 5.7% were mildly stunted and 1.5% were severely stunted (Table 6). More of in-school respondents had normal height-for-age, while more of out-of-school respondents were mildly and severely stunted (p<0.05). Most (87.3%) of the respondents had a normal BMI for age, 7.3% were underweight and 4.9% were overweight. The prevalence of underweight and overweight was higher among the in-school adolescents (8.0%, 6.7% respectively) compared with out-of-school respondents, with no significant difference in the prevalence level (p>0.05).

Table 4: Nutrition Knowledge of Respondents.

Note: * - Values are significantly different at p < 0.05

Table 5: Association between Nutrition Knowledge and Socio-demographic factors.

Note: * - Values are significantly different at p < 0.05

Table 6: Nutritional Status of Respondents.

Note: * - Values are significant at p < 0.05dx

Dietary Diversity of Respondents

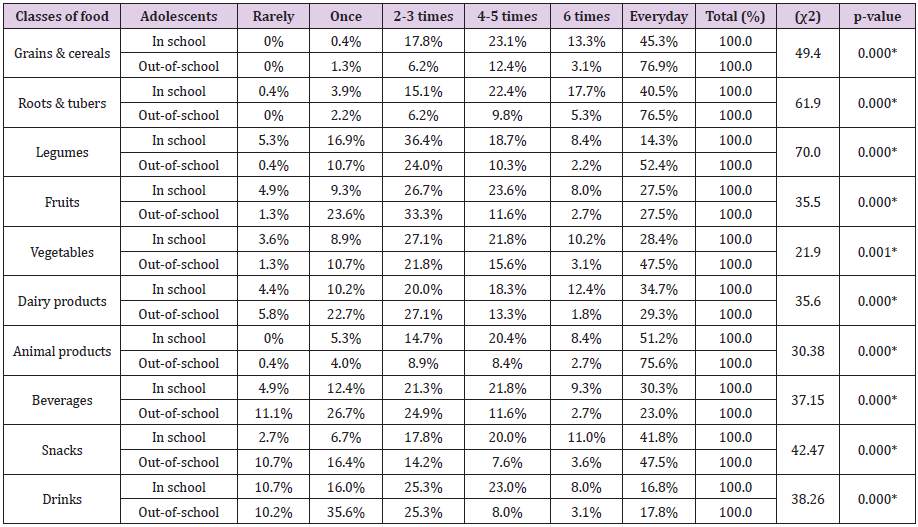
In Table 7, majority of the respondents had high dietary diversity, with no significant difference between the in- and outof school respondents. None of the out-of-school respondents had low dietary diversity while 2.7% of in-school respondents had low dietary diversity. Higher percentage of out-of-school adolescents had average dietary diversity (p<0.05) compared with the in-school respondents. The dietary diversity score of the inschool respondents was slightly higher than that of out-of-school respondents (p<0.05). Table 8 shows the association between frequency of food consumption and the category of adolescent. A higher percentage of out-of-school respondents consumed more cereals and grains, roots and tubers, legumes, animal products, and snacks daily compared to the in-school respondents, while greater percentage of the in-school respondents consumed more dairy products and beverages on daily basis (p<0.05. There were significant differences in frequency of food consumption in all the classes of food groups among the respondents (p<0.05) with no regular pattern of differences.

Table 7: Dietary Diversity of Respondents.

Note: * - Values are significant at p < 0.05

Table 8: Frequency of food consumption weekly and category of adolescents.

Note: * - Values are significant at p < 0.05.

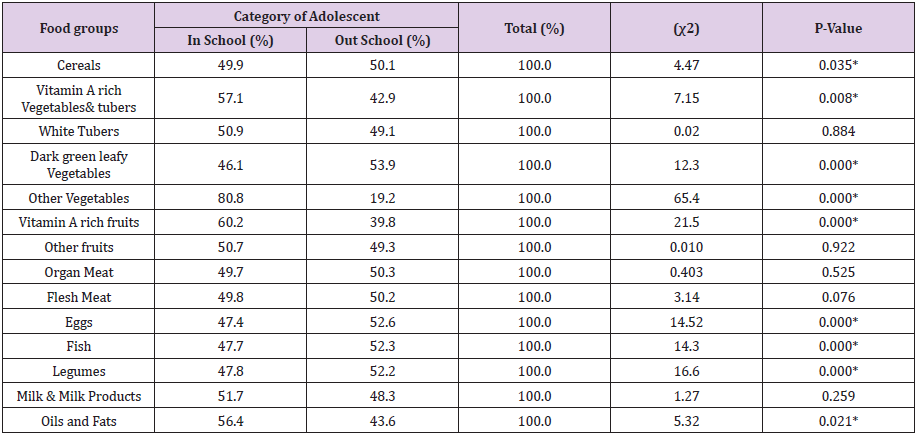
In Table 9, higher percentage of in-school respondents consumed vegetables, tubers, fruits, milk and milk products, and oils and fats compared with out-of-school respondents (p<0.05); while higher percentage of out-of-school respondents consumed cereals, dark green leafy vegetables, organ meat, flesh meat, egg, fish and legumes compared with the in-school respondents (p<0.05). Table 10 shows the correlation between BMI-for-age and dietary diversity scores of in- and out-of-school respondents. The BMI-for-age of the in-school respondents had a significant negative correlation with dietary diversity scores (p<0.05), while the outof- school respondents also had negative correlation with dietary diversity scores which was not significant. In Table 11, there was positive correlation between BMI-for-age and nutrition knowledge of in- and out-of-school respondents with no significant difference between both groups.

Table 9: Relationship between dietary diversity of respondents.

Note: * - Values are significant at p < 0.05.

Table 10: Correlation between BMI for Age and individual dietary diversity score.

Note: * - Value is significant at p < 0.05. IDDS = Individual dietary diversity score

Table 11: Correlation between BMI for Age and Nutrition Knowledge.

Discussion

Socio-Demographic Characteristics of Respondents

The mean age of in-school respondents recruited for this study is similar to the mean age of the in-school respondents (15.5±2.5 years) reported by Sidiga, et al. [15]. Most of the respondents were within the age range of 15-19 years (especially the out-of-school respondents), and were Yoruba. This is similar to the findings of Omobuwa, et al. [16]; and is believed to be due to the geographic location of the study where Yoruba ethnic group is dominant in the South-western Nigeria. Most of the in-school respondents were from the monogamous family. This is also similar to the report of Omobuwa, et al. [16]. About half of the out-of-school respondents were from polygamous family and more than half of them reportedly had five or more siblings. The large family size among these out-ofschool respondents could have led to inability to achieve optimum care due to possible sharing of available resources among larger number of people compared with monogamous families with lesser siblings. This could have resulted in some of the respondents not being enrolled in secondary school, or dropping half way.

The parents’ level of education was observed to be associated with the adolescent type. Majority of the out-of-school respondents’ parents either had no formal education or had maximum of secondary school education compared with their in-school adolescents’ counterpart parents where either secondary or tertiary level of education were the educational level of majority of them. Educated parents can make more informed choices and have better socio-economic status to ensure their children get sound education in schools. Overall, the in-school respondents had significantly better socio-economic and socio-demographic characteristics than the out-of-school respondents.

Nutrition Knowledge and Status of Respondents

Most of the out-of-school respondents had poor nutrition knowledge while majority of the in-school respondents had good nutrition knowledge. This finding is similar to that of Nurul, et al. [17]. Knowledge directly impacts health and nutrition, and this study revealed that the respondents were not aware of the importance of good nutrition to supporting growth and development at adolescent stage. Nutrition knowledge score for in-school respondents was significantly higher compared with that of out-of-school respondents. This finding is different from the result of the study by Manijeh, et al. [18]. The observed difference between the two classes of respondents in this study may be due to the fact that the in-school respondents were exposed to/or enlightened with basic nutrition knowledge in school, as compared to their out-of-school counterparts who may not have access to such information. The prevalence of underweight, overweight and obesity were higher among in-school respondents compared to their out-school counterpart. This finding is in line with that of Ejike, et al. [19].

The prevalence of underweight in this study is higher compared with the study of Adesina, et al. [20], but lower than that of the studies of Alabi [21] and Adegoke, et al. [22]. The Prevalence of overweight in this study is higher than the ones reported by Olumakaiye, et al. [20,23,24]; while it is lower compared with findings of Omuemu and Omuemu [25], Ejike and Ijeh [26]; and much lower than the value reported by Abdulkarim, et al. [8]. The result obtained in this study is an indication of the rise in the level of overweight and obesity among adolescents, which can be linked to the level of their physical inactivity [2] and exposure to snacking, as confirmed from Table 8. The result of the respondents where most of them had normal BMI-for-age is similar to the one reported by Adamu, et al. [27]. There was no significant correlation between BMI-for-age and nutrition knowledge in both groups; and this observation is similar to that of Esfarjani, et al. [28]. The BMI-for-age of the in-school respondents was negatively correlated with their dietary diversity scores. This finding is similar to that of Olumakaiye [29].

Dietary Diversity of Respondents

Majority of the respondents had high dietary diversity scores, the in-school respondents having slightly higher mean score than out-of-school respondents. This is however different from the work of Mahdis, et al. [30] who reported a lower dietary diversity score for out-of-school adolescents compared with in-school adolescents. Dietary diversification is one of the four main strategies advocated internationally for improvement of micronutrients intake and nutritional status, especially in undernourished individuals [31]. Many studies among several age groups have shown that an increase in individual dietary diversity score is related to increased nutrient adequacy of the diet. Dietary diversity scores have been positively correlated with increased mean micronutrient adequacy of complementary foods [32], and micronutrient adequacy of the diet in adolescents [33] and adults [34,35]. The dietary diversity score improved when consumption of healthy food groups increased. Higher dietary diversity score is not always associated with increased weight gain, because it may be due to increase in consumption of low-calorie foods such as vegetables, whole grains and fruits [33].

Conclusion
Majority of the in-school adolescents in this study had better nutrition knowledge compared with the out-of-school adolescents, and the socio-demographic characteristics of adolescents had significant influence on their nutrition knowledge. In-school adolescents had higher dietary diversity score as well as higher prevalence of both underweight and overweight compared with the out-of-school adolescents. There is therefore, the need for nutrition education targeted at the in-school and out-of-school adolescents to increase their nutrition knowledge and dietary diversity; especially the right choice of meals and adequate, healthy diet. There is also the need for increased awareness of the benefits of healthy eating habits and importance of good nutrition to growth and development to prevent the upward trend in prevalence of malnutrition among the adolescents, who are would-be future adults.

For more Articles on : https://biomedres01.blogspot.com/
Tuesday, May 17, 2022

Computational Investigation of Secondary Acoustic Radiation Force Between Cells and Particles Out of Nodal Pressure Line

Computational Investigation of Secondary Acoustic Radiation Force Between Cells and Particles Out of Nodal Pressure Line

Introduction
The wide applications of acoustofluidic devices which have been studied in recent years, play a key role in cell manipulation and separation [1,2]. In such cases, the first part of acoustic force, which is called primary acoustic radiation force, has been widely investigated in last few decades [3-5]. This force acts on cells and particles with different properties related to the containing fluid and causes some effects on cell deformation which have also been studied experimentally and theoretically in recent years in which, the investigators have tried to improve their simulations by using the solid models [6,7]. Recently, Aghaie, et al. [8] found that the viscoelastic model predicts the cell deformation behavior more relevant to the experimental data in comparison with previous models which were applied to cells with no respect to inter-particle force. When two or more suspended objects (particle or bubble) are subjected to an external acoustic field, the inter-particle force appears [9]. This mutual force between particles which is known as secondary acoustic radiation force results in attraction or repulsion and under this condition and each particle is exposed to both the incident field (equal to the primary force) and the scattered field from the neighboring [10]. This inter-particle force may affect some applications like cell trapping, cell clustering, and cell sorting [11]. Most of the studies have developed and reported the secondary force on bubbles in the acoustic field [12-16]. In 1906 a theoretical investigation of acoustic interaction force between a pair of air bubbles was derived by Bjerknes [9].

Crum [13] extended his analysis to the experimental study on pulsating bubbles in a sound field. By considering a wide distance range between two small gas bubbles in a viscous liquid, Doinkov [16] showed a repulsion between the bubbles which was in contradiction with Bjerknes formula. In addition to the bubbles, this mutual interaction force has been expressed both theoretically and experimentally for particles [17-19] and fluid spheres [20] in a plane wave field. Silva and Bruus [21] obtained a theoretical formula for interaction forces in the Rayleigh scattering limit. They calculated the inter-particle force by a potential field in an inviscid fluid. Sephrirahnama, et al. [10] proposed a numerical solution by using a weighted residue procedure to compute the total acoustic radiation forces. Their investigations were carried out in close proximity to pressure node with no restriction on the spherical particles size. Recently, Habibi, et al. [22] conducted a numerical simulation to find out the impact of particle size and material properties on the acoustic forces, including the secondary force. They demonstrated a various behavior in regimes and forces direction due to the resonant modes. The current literature lacks a research on the secondary acoustic force out of the nodal pressure. The monopole part of the secondary acoustic force vanishes in the pressure node. Most of the previous studies were also restricted to the bubbles in which, the dipole effect is eliminated, whereas the compressibility influences the secondary force.

Moreover, a few researchers have simulated the secondary acoustic force by numerical method. For example, Habibi, et al. [22] placed the particles in the wave propagation direction and considered a same direction for both the primary and the secondary forces. In this paper, we present a numerical and experimental study for two groups of particles to calculate the primary and secondary acoustic forces. In order to achieve our purpose, firstly, we select two polystyrene particles of different sizes (4.8 and 25μm). In the second section we use a red blood cell and silica particle with sizes 6 and 22μm, respectively. By considering a fixed position outside of the pressure node for larger particle, and a moving pathway for the smaller particle, the primary and secondary acoustic forces are calculated. As a consequence, the dependence of the secondary acoustic force on the inter-particle distance is obtained. Additionally, a summary on the experimental procedure is presented and all results are compared with the experimental analysis.

Theory and Formulation

Primary Acoustic Force

In the case where particles are suspended in a fluid and driven by an acoustic wave without considering an interaction phenomenon, they will be affected by the primary acoustic force. For a compressible particle in an ideal fluid, this force is written as [23]:

where R is the particle radius, k is the acoustic wave number, Eav is the acoustic energy density, and z is the distance till the nearest pressure node. Φ denotes the acoustic contrast factor defined as:

Here β is the compressibility, ρ is the density and the subindex p and f correspond to particle and fluid, respectively. Positive or negative value of contrast factor determine the particle/cell moving direction to the pressure node or antinode, respectively [23].

Secondary Acoustic Force

In the acoustic field, when particles are in close proximity to each other, the inter-particle force starts becoming significant. Investigation of secondary acoustic force on particles back to the study of Weiser, et al. [19]. They derived this interaction force for two solid particles with radius of Rp1 and Rp2 in two expressions:

where Vac is the incident field velocity, d is the inter-particle distance, and θ is the angle between the propagation direction of the incident wave and the centerline connecting the two particles. For the case where the particles lined up in the wave propagation direction (θ=0) the secondary acoustic force is repulsive. On the other hand, the force between the particles lined up perpendicular to the propagation direction (θ=90) is negative and attractive. Gröschl [1] by extending the Crum [13] study, carried out the formula including both the orientation and particle position effects. This force for two similar particles is given by:

where ω is the angular frequency. v(z) and p(z) are the velocity and pressure in the particle position, respectively, of the unperturbed incident acoustic field. The first term (dipole term) represents either attraction (θ=90) or repulsion (θ=0) and it vanishes at the pressure anti node. Likewise, the second term (the monopole term) depends on the compressibility representing an attractive force and it vanishes in the pressure node. For particles in between the pressure node and the velocity node, both terms should be considered. In the present study, in order to compute the primary and secondary acoustic forces, we use the perturbation method by considering a series for the pressure, velocity and density. These fields begin with the stationary part (p0, v0, ρ0), followed by the first order (p1, v1, ρ1) and second order terms (p2, v2, ρ2). Then the pressure, velocity and density can be written as [24]:

The acoustic radiation force acting on a particle, in an inviscid fluid can be calculated by integrating the time averaged second order pressure field on the surface of particle as given in the following equations [24]:

Here, C is the speed of sound in fluid, n is the normal unit vector, s is the surface of the particle, and < > is the time average operator. In Eq. (6) the first two terms are the kinetic and hydrostatic energy, and the third term is the momentum flux across the boundary surface of the particle [25]. The first order parameters (p1,v1) consist of the incident and scattered parts, for instance, the pressure can be expressed as:

where index in and sc refer to the incident and scattered wave, respectively. In the small size particle cases (R<<λ) the psc2 term will be negligible compared to pin2 and 2pinpsc [25]. However, for large particles the scattered terms must be considered. Also, the scattered-scattered and scattered-incident terms play a key role in the secondary acoustic force calculation because the acoustic inter-particle force depends strongly on the particle distance and scattering effects. In calculating the primary acoustic force acting on a particle, Gorkov’s equation cannot provide a precise solution because it does not take the scattering effects into account. Thus, due to the small distance between the particles in the present work, we employ the perturbation theory by using the first order terms to calculate the primary and secondary acoustic force.

Simulation Procedure

Algorithm and Boundary Condition

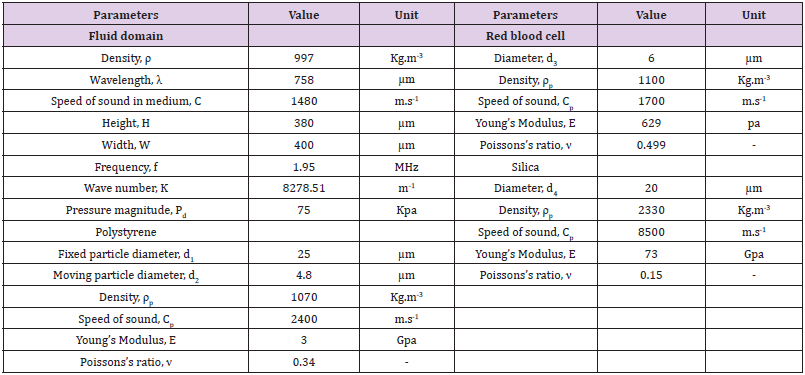
The commercial finite element software (COMSOL Multiphysics @ V.5.3) is implemented so as to simulate 2D and 3D models of two particles/cell in an acoustic field. The simulation model consists of two particles and particle/cell, experiencing acoustic force in different positions. The aim of simulation is to evaluate the primary and secondary acoustic force and the correlation between them in special positions out of nodal pressure. In the current study, we use the Acoustic Pressure physics to obtain the acoustic pressure field at the first steps. Furthermore, we employ the Solid Mechanics physics to obtain the impacts of linear elastic behavior particle as a scattering point. The computational domain is modeled by coupling the Pressure Acoustic and Solid Mechanics physics and acoustic radiation forces (primary and secondary) are evaluated by integrating from Eq.6 over the particle surface. The material and domain properties considered in the model, are given in (Table 1). The fluid characteristics are obtained from the COMSOL library. At the first case, both the fixed and moving particles are selected as polystyrene with sizes 4.8 and 25μm, respectively. Secondly, we consider a red blood cell (6μm of diameter) as a moving particle and silica particle as a fixed particle (20μm of diameter). These sizes were chosen to compare the simulation results with experimental data. While thanks to the axisymmetric domain we use a 2d model, in order to simulate the current study presented in results and discussion part, a 3d model is implemented.

Table 1: Parameters used in modeling.

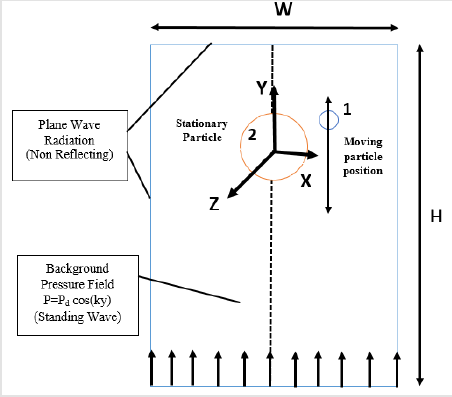
The applied boundary conditions are shown in (Figure 1). It is indeed a 3d case in which, surrounding fluid is deliberately represented as a rectangular geometry instead of cylindrical one to clearly show the boundaries. And particles are also depicted by a circular domain. The standing wave field is generated as p=pdcos(ky) propagating along the y-axis. We use the plane wave radiation for boundaries to surround the model with minimum acoustic reflection. The larger particle is fixed in between the pressure node and pressure antinode and the smaller particle is placed on particular positions in the neighboring of the stationary particle. Actually, we consider a definite pathway for the moving particle and determine the acoustic force based on this positioning. The primary acoustic force is obtained by Eq. (6) along the y-axis (the wave propagation direction) and compared with Gorkov’s theory. Integrating Eq. (6) over the smaller particle (moving particle) surface in the center-to-center line direction, leads to the secondary acoustic force and the results are compared with the experimental data in following sections.

Figure 1:Geometrical configuration and boundary conditions.

Grid Generation

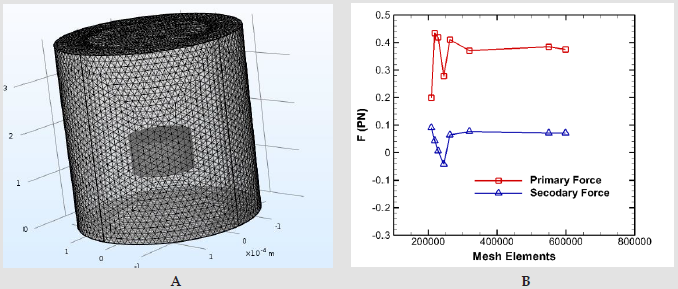
In order to obtain an appropriate mesh size, many different grid networks were tested. Finally, 423513 triangular elements are chosen as shown in (Figure 2a). We adopt a uniform mesh in outer region of the particles and moreover, a very refined meshes are used close to the particles. The maximum mesh size limited to 20.9μm for the fluid domain and 3.59μm for the solid domain. Also, the grow rate of the fluid and solid domain is set to 1.3. The grid independency is studied in (Figure 2b). To find an independent grid system, the primary and secondary acoustic forces are obtained for different cellular element sizes.

Validation

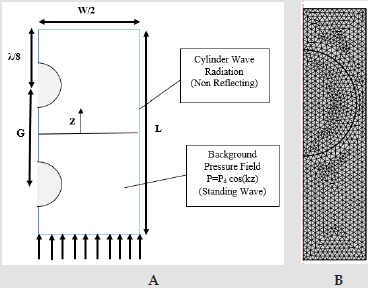
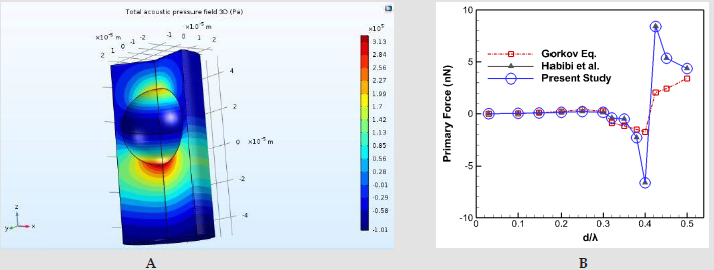
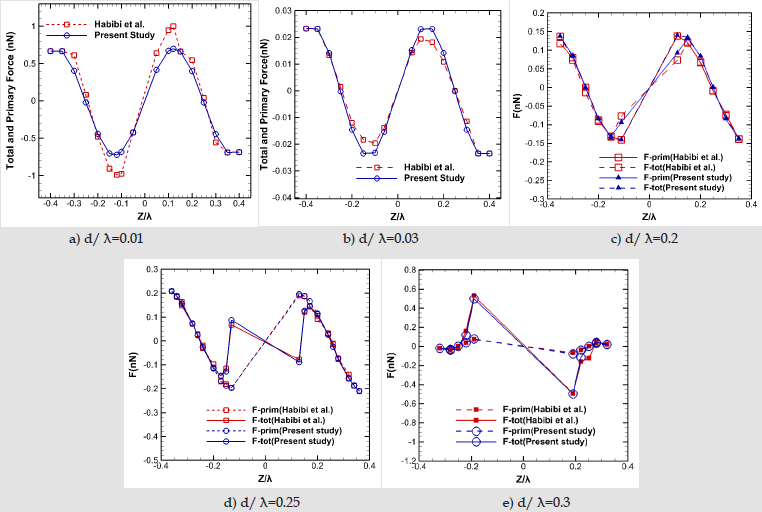
In order to investigate the validity of the current model, a numerical study is simulated, and its results are compared with [22]. A 2D axisymmetric model and grid network elements are demonstrated in (Figure 3). The polystyrene particle size varies from 0.03λ up to λ and its properties plus fluid domain parameters are mentioned in [26]. (Figure 4) illustrates the acoustic pressure contour and the primary radiation force which is compared with [22] results and Gorkov’s equation. As shown, our results are compatible with their models. However, there’s a difference between the numerical results and Gorkov’s theory. For the larger particles, it happens due to the restriction of Gorkov’s equation in considering the scattering effects. In the second case where there are two identically sized particles, the secondary acoustic force is presented and compared with [22] study. (Figure 5) illustrates the primary and total force acting on single and two particles. They determined the magnitude of secondary acoustic force by evaluating the primary and total forces. At first, they calculated the primary acoustic force for a single particle. By adding the second particle, they computed the acoustic force acting on first particle which was called total acoustic force. Since these forces are applied in the same direction, they calculated the secondary acoustic force by:

Figure 2:a) an uniform mesh in fluid domain and a dense mesh region around particles b) Mesh independency plot.

Figure 3:a) Schematic of axisymmetric geometry and boundary conditions; b) Mesh elements.

Figure 4:a) Acoustic pressure field 3D b) Primary radiation force of present study compared with results of [22] and Gorkov’s theory.

Where tot F is the total acoustic force on each particle in the presence of two particles? tot F and prim F is the primary and the secondary acoustic forces, respectively. Accordingly, the difference between the primary and total force values resulting in the secondary acoustic force, in the current case. As shown in (Figures 5a & 5b) for the ratio of particle diameter to wavelength of 0.01 and 0.03, the primary and total acoustic forces magnitude is the almost the same and indistinguishable. So, the title of y-axis in these two graphs, is primary and total force which are equivalent. Hence, the secondary acoustic force in these cases is nearly zero due to the small size and insignificant scattering effects. By increasing the particle size (Figures 5c-5e) there is an obvious difference between the primary and total acoustic force which indicates the existence of secondary acoustic force. In these cases, for small inter-particle distances (gap < 0.4), secondary force is dominant and overtakes the primary force. It can be clearly seen that the present simulation follows a similar trend with good agreement. As depicted in (Figure 4a), we solve the Pressure Acoustic Physics on both the fluid and solid domains whereas [22] did not consider the solid region in the Pressure Acoustic computational domain. By doing so, comparison between the secondary acoustic force values, represents insignificant differences.

Figure 5:Comparison between the primary and secondary acoustic forces acting on polystyrene particles which obtained by current modeling and [22] for different ratio of particle diameter to wavelength (d/ λ) in different normalized particle positions (z/ λ).

Experimental Data

We divided our results into two different sections as firstly we considered previous studies of authors [26,27] and simulated their experiments and compared their results with our evaluated data. At the second part, we make new experiments and simulate them as well and finally compare their results whit each other. The experimental procedure is exactly the same with [26,27] and extensively explained in those studies. They presented a new method to measure the secondary acoustic force between particles/cells. In their method, a scattering particle is fixed in the channel and the trajectory of other particles and cells are studied in close vicinity of the fixed particle. By extracting the particle/cell trajectory and subsequently particle/cell velocity and considering Stokes drag, FDrag = 6π nvrp , where n is dynamic viscosity, v is particle velocity and p r is particle/cell radius, in low Reynolds number of particles, the secondary acoustic force can be calculated.

They used the polystyrene and silica particle with diameter of 25 and 20 μm, respectively, as scattering points. The moving particles in close proximity of the scattering points include polystyrene with diameter of 4.8 μm and RBC with diameter of 6 μm for polystyrene and silica fixed particle, respectively. In that study, authors used a rectangular cross section microchannel with sizes 375×110 μm made of glass-silicon-glass layers.

The microchannel was excited by using the bulk acoustic wave with resonant frequency of 2-MHz. More information about the method of fixing the particle and injection the moving particle/cell into the microchannel can be found in [26,27]. In order to find the secondary acoustic force and separate that from primary acoustic force they just considered the lateral movement of moving particle in the perpendicular direction related to the wave propagation direction to calculate the Stokes drag force.

Results and Discussion

Inter-Particle Force Between Polystyrene Beads

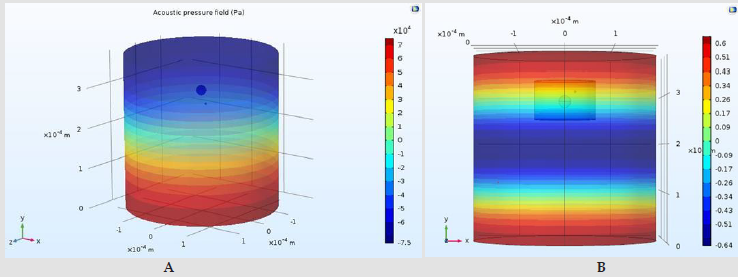
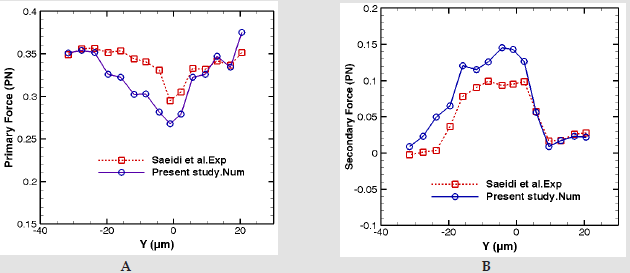
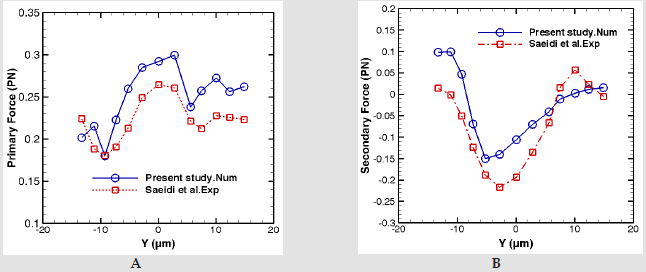
In this section, the numerical results of interaction of 25 and 4.8 μm polystyrene particles under the influence of acoustic field are compared. In order to consider the monopole and dipole effects, the polystyrene particles are located in between a pressure node and a pressure antinode. The acoustic pressure (which is generated by a plane wave and depicted in (Figure 6)and acoustic velocity are obtained by solving the 3D Helmholtz equation. As it can be seen, the acoustic pressure magnitude in the middle of channel is nearly zero which is indicated the nodal pressure plane, (Figure 6a). The time-averaged second order pressure () has been shown in (Figure 6b) and is approximately 1.25*105 times smaller than the magnitude of the first order pressure in (Figure 6a). This pressure acts on particles as an acoustic force and causes primary and secondary acoustic forces. The small moving and big fixed particles are shown in the (Figures 6a & 6b). (Figure 7)shows the primary and secondary acoustic forces on moving polystyrene particle positioned at different distances from the fixed particle. The location of the moving particle in simulation are chosen exactly in the same position which extracted from the experimental data [26]. The center of the fixed particle is considered as the origin of the coordinate system as the acoustic forces act on a small particle before and after reaching the fixed particle.

Figure 6:a) Color plot of acoustic pressure calculated by simulation in the 3D model at frequency of 1.95 MHz b) Color plot of the time-averaged second-order pressure at frequency of 1.95 MHz.

It’s also noticeable that when the moving particle reaches to the same level with fixed particle (position y = 0), the contact angel is approximately 0 and the center-to-center line is perpendicular to the wave propagation direction. In this condition, we face with a pure secondary acoustic force acting on the small particle. As it can be seen in (Figure 7a), the primary acoustic force decreases to the minimum value when the angel θ is close to 90. The distance between the fixed particle and the pressure nodal line is approximately 189μm. This force rises again in the further locations relative to the fixed particle. (Figure 7b) illustrates that contrary to the primary acoustic force, the secondary acoustic force is significant in the vicinity of fixed particle. Actually, the trends of primary and secondary acoustic force magnitudes change in the opposite way. Comparison between the numerical and experimental results of primary and secondary forces are depicted in (Figures 7a & 7b). The behavior of both forces from numerical results agrees with experimental data [26]. 2 Acoustic force between RBC and silica particle. In the second case, the same investigation has been done on the RBC and silica particle. The small RBC passes by the fixed silica particle.

Figure 7:Acoustic radiation force on polystyrene particle vs. y position : blue solid line shows the numerical results and the experimental data[26] is depicted by the red dashed line a) Primary acoustic force b) Secondary acoustic force

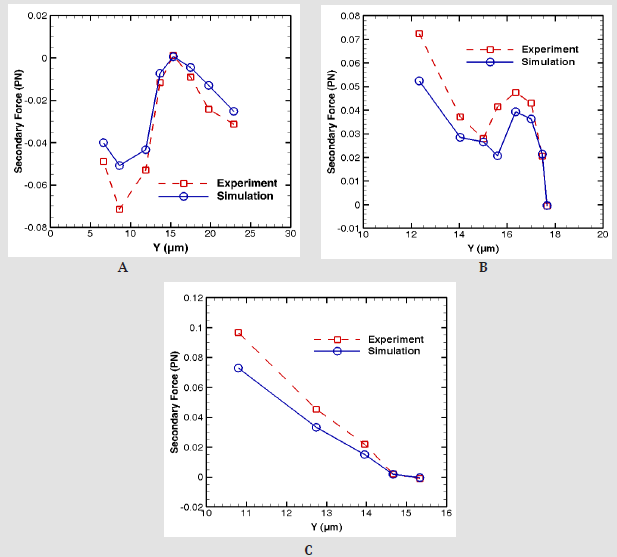
The primary and secondary acoustic forces acting on a red blood cell are calculated and shown in (Figure 8). In this case, the silica particle with a high stiffness (E=73Gpa) shows different trend in comparison with polystyrene particle. In general, the high magnitude of Young’s modulus, leads to the larger resonant frequency and in most cases, the eigenfrequencies strengthen the inter particle forces. (Figure 8b)shows that the secondary force acting on red blood cell varies from +0.1 to -0.15PN while the values from polystyrene particle changes approximately between 0 and 0.1PN. In other words, the higher stiffness of silica strongly affects the secondary acoustic force on RBC. In addition, by considering the fact that RBC has weaker acoustic properties relative to the polystyrene particle, we compensate this weak property with silica particle to highlight the secondary acoustic force acting on RBC. Considering that our simulation follows the previous experimental results with good accuracy, here we implemented new experiments for more investigation. In third section, new experiments by considering the RBC and silica particle have been done and their results are summarized in (Figure 9). At all cases, (Figures 9a & 9c) the fixed silica particle is located in the middle of the channel wall and pressure nodal line and moving RBCs are getting close to the fixed particle from the upside of the silica particle.

Figure 8:Acoustic radiation force on red blood cell particle vs. position and comparison with [27] a)Primary force b)Secondary force.

As it shown in all cases by decreasing the vertical distance of moving RBC to the silica particle the magnitude of the secondary acoustic force increases. In addition, in all cases almost at the vertical distances about 15-18 micrometer from fixed silica particle the magnitude of secondary acoustic force is nearly zero which indicates that the minimum effect of acoustic force in RBC trajectory. In case 1, (Figure 9a), there is a decrease in the magnitude of secondary acoustic force when the vertical distance of moving RBC is about 7 micrometers. The reason is the contact between the RBC and silica particle which reduces the RBC moving speed. In case 9 b, the sudden reduction in secondary acoustic force in vertical distance of 15 μm between RBC to silica particle could be related to the unexpected movement of RBC in close proximity of fixed particle based on visual observation. This unanticipated movement causes the change in center-center distance of RBC and silica particle and subsequently change in the secondary acoustic force.

Figure 9:Acoustic radiation force on red blood cell particle vs. position and comparison with [27] a)Primary force b)Secondary force

Conclusion
In this paper, the secondary acoustic radiation forces acting on solid particles outside of the pressure node has been investigated both numerically and experimentally. Initially, the primary and secondary forces were determined by using a perturbation theory. We have simulated the experimental condition so as to obtain the forces acted on moving polystyrene particle. Afterward, the mentioned procedure used for silica and red blood cell. By comparison, the same behavior has been illustrated between the numerical and experimental results. The investigation of acoustic radiation force has shown that when the moving polystyrene particle is positioned close to the fixed particle, the secondary force rises significantly. It means that in the cases where the contact angel is nearly 0 and the center-to-center line is perpendicular to the wave propagation direction, the secondary force goes up, whilst the primary force decreases sharply in this region. Additionally, in the case of red blood cell and silica studied, we have observed the similar relationship between the primary and secondary forces. However, in this case, due to the larger stiffness of silica, the red blood cell has experienced the higher variation in secondary force than polystyrene particle.

For more Articles on : https://biomedres01.blogspot.com/
Variability in the Weight of Children Attending Two Tertiary Hospitals in Southern Nigeria: Associated Factors and Health Implication

  Variability in the Weight of Children Attending Two Tertiary Hospitals in Southern Nigeria: Associated Factors and Health Implication Intr...