Faba Bean Varieties Response to Phosphorus Application on Yield and Yield Components at Kulumsa Area of Tiyo District, Arsi Zone, South-Eastern Ethiopia
Introduction
Faba bean (Vicia faba L.) is one of the major pulse crops grown in the highlands (1800 – 3000 m) of Ethiopia. The main faba bean global producers are China (1.65 Mt), Ethiopia (0.61 Mt), France (0.44 Mt), Egypt (0.29 Mt) and Australia (0.19 Mt) [1]. It is the third most important cool-season food legume after chickpea and field pea with concentrated in nine major agro-ecological regions: The Mediterranean Basin, the Nile Valley, Ethiopia, Central Asia, East Asia, Oceania, Latin America, Northern Europe, and North America [2]. In Ethiopia faba bean is grown largely by subsistence farmers, during the cool season [3]. In 2014/2015 cropping season, out of a total grain crop area, 12.41% (1,558,442.04 ha) was under pulses. From this area, faba bean took up 3.53% (about 443, 074.68 ha) of the grain crop area. In terms of production, pulse contributed 9.88% about 2.672 million tons of grain production. Among pulses, faba bean accounted for 31.4% (0.84 million tons). However, the productivity of the crops under smallholder farmers is not more than 1.89 tha-1 [4]. The low yields per hectare were associated with susceptibility of the crops to biotic and abiotic stresses [5]. Among the abiotic category, declining soil fertility and low pH are the most determinant for low productivity of the most crops [6]. The causes for severe deficiency of most of the major nutrients mainly, nitrogen and phosphorus in Ethiopian highlands are the huge loss of soil from agricultural land, which is estimated to be 137 tha-1 per year; approximately an annual loss of 10mm soil depth [7].
Annual nutrient deficit also estimated to be -41 kg N, -6 kg P and -26 kg K ha-1 [8]. Phosphorus is the second most plant growth limiting nutrient next to nitrogen despite being abundant in soil both as organic and inorganic forms. Many soil throughout the world are phosphorus deficient because low free phosphorus availability [9]. Phosphorus deficiency has also been shown to be the major yield limiting nutrients in the highlands of Ethiopia [10] particularly soils of many areas in highlands that receive high rainfall suffer from remarkable phosphorus deficiencies due to phosphorus fixation at low pH. Phosphorus is an important mineral nutrient to the growth and BNF of legumes and the requirement of phosphorus by faba bean is relatively high, which is in the range of 20-30 kg P ha-1 [11]. Phosphorus is needed in relatively large amounts by legumes; in addition to promoting growth of the host legume, it has specific roles in N2 fixation, nodule initiation, nodule number, growth and development [12]. It also plays a vital role in increasing legume yield through its effect on plant and also on fixation process by Rhizobium [13]. On the other hand, phosphorus deficiency reduces N2 fixation due to decreased nodule formation and reduced nodule sizes and finally affecting the yield and grain quality and quantity [14]. Therefore, the present study was conducted to determine optimum rates of phosphorous fertilizers for different varieties of faba bean under balanced fertilizer; to assess economic feasibility of P fertilizer for faba bean under balanced fertilizer in southeastern highlands of Ethiopia.
Materials and Methods
Area Descriptions
The experiment was carried out on farmers’ fields and research stations for three cropping seasons during 2017-2019 at Kulumsa area of Tiyo district in Arsi zone of Oromia, South-eastern Ethiopia. Geographically, the study sites were located between 080 00’ 464» to 080 01’ 544» N, and 0390 09’ 417» to 0390 10’ 840» E with an elevation ranging from 2222-2261 meters above sea level at Tiyo district. The average weather data recorded on the weather station at Kulumsa located near the study areas from the years 2017 - 2019 indicate that the total annual rainfall for Tiyo district were 718.3, 742.1 and 939.0 mm respectively, and the annual mean minimum and maximum daily air temperature for the consecutive years were (11.7, 11.9, 12.0 0C) and (24.3, 23.5, 24.1 0C) respectively.
Design and Treatments
The experiment was set in combined RCBD by varying levels of Phosphorus fertilizer (0, 10, 20, 30, 40 kg ha-1 and faba bean varieties with three replications. The size of each experimental gross plot was 2.6 m * 4 m (10.4 m2). The faba bean varieties used for the experiment were Gabalcho, Hachalu and Tumsa. Phosphorus fertilizer levels were applied as side banding at sowing time and the other agronomic practices were kept uniform for all treatments.
Soil Sampling and Analysis
Surface soil, 0 - 20 cm depth, were collected from the entire experimental field before planting and after harvesting. The soil was daily air dried and made fine by using mortar and pestle. The fined soil was passed through 2mm sieve and the soil pH, Available P, Total N and Organic matter were determined at Kulumsa Agricultural Soil Laboratory. Soil pH (H2O) was measured by using a pH meter in a 1:2.5 soil: water ratio. Soil organic carbon was estimated by the Walkley-Black wet oxidation method. Total nitrogen was determined by the micro-Kjeldahl digestion, distillation and titration method, and available P was determined using the standard Olsen extraction method. Accordingly, the soil analysis result before planting at farmers sites indicated that the pH value was 5.67 (moderate) [15], available phosphorus was 18.57 ppm, high [16], total N was 0.21 % (medium) and Organic matter was 5.13 % (medium) [17].
Yield Data Collection
Data of seedling density, tiller per plant, plant height, number of spike per 50cm, number of pods per plant, number of seeds per pod, grain yield, above ground biomass, and thousand seed grain weight were collected from each plot. Grain, above ground biomass and thousand seed grain weight were analyzed gravimetrically by using sensitive balance and recorded in units of gram.
Statistical Analysis
The ANOVA procedure of statistical analysis system [18] was used for performing the significance of differences in grain and above ground biomass yields. A post hoc separation of means was done by least significant difference (LSD) test after main effects was found significant at P < 0.05.
Economic Analysis
As farmers attempt to evaluate the economic benefits of shift in practice, partial budget analysis was done to identify the rewarding treatments. Yield from on-farm experimental plots was adjusted downward by 10 % i.e., 5 % for management difference and 5 % for plot size difference, to reflect the difference between the experimental yield and the yield that farmers could expect from the same treatment. Average market grain price of faba bean ETB 15.00, and farm-gate price of phosphorus fertilizer ETB 15.00 kg-1 were used.
Results and Discussions
Soil Analysis Results
The soil analysis result of experimental sites collected after harvest showed that, effect of faba bean varieties were significant (p < 0.01 and p < 0.001) on pH, total N, and organic carbon soil contents of experimental sites. Analysis of variance revealed that application of P fertilizer levels had significant (p < 0.01 and p < 0.001) effect on pH, available P and organic carbon, but not significantly (p <0.05) affected total N for samples taken from experimental sites. Results indicated that the variety by P fertilizer level interaction (VxP) effect was significant (p < 0.01 and p < 0.001) on pH, available P, total N and organic carbon soil content at Kulumsa area in Tiyo district (Table 1).
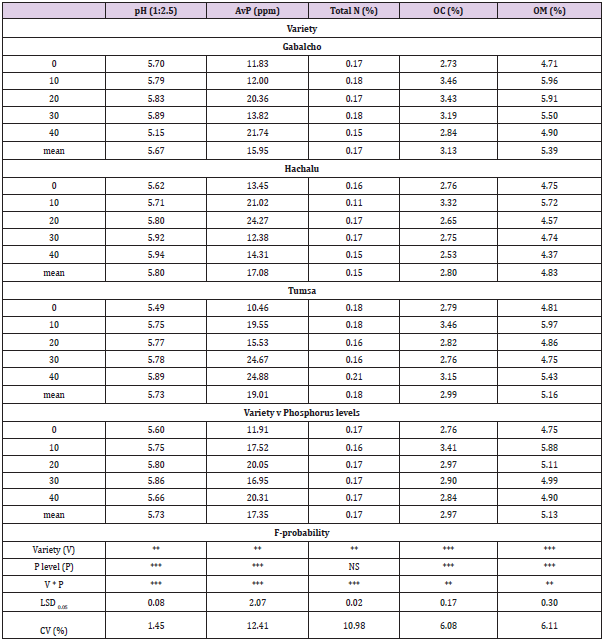
Table 1: Effect of fertilizer levels on soil chemical properties after harvesting faba bean at Kulumsa area in Tiyo district.
Note: **, *** = significant at p < 0.01, and p < 0.001; NS = Not Significant.
Yield Results of Faba Bean Varieties on Application of Phosphorus Fertilizer Level
Agronomic maximum grain and above ground biomass yield (5197 and 11652 kg ha-1) in 2018 and minimum (2743 and 6989 kg ha-1) in 2017 and 2019 cropping seasons were obtained, respectively, up on the application of phosphorus fertilizer rates. In terms of variety, the grain and above ground biomass yield were not significantly different. Numerically superior grain and above ground biomass yield (3934 and 9231 kg ha-1) were obtained from the application of 40 kg ha-1 phosphorus fertilizer, respectively (Table 2). The highest harvest index and thousand seed weight (47.4 % and 759.6 g) in 2018 and minimum (33.9 % and 616.2 g) in 2017 cropping seasons were obtained with the application of phosphorus fertilizer rates, respectively. In terms of variety, significant value of harvest index and thousand seed weight (42.8 % and 730.9 g) were obtained from Hachalu and Gabalcho. The value of harvest index and thousand seed were not significantly affected with the application of phosphorus fertilizer rates (Table 3).
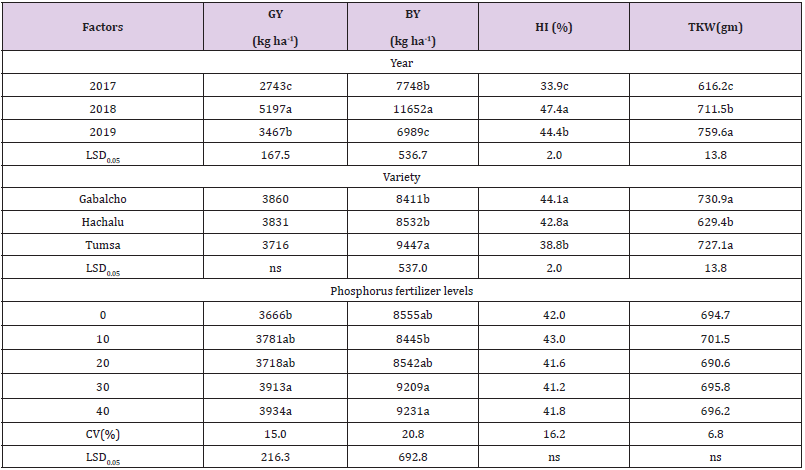
Table 2: Grain (GY), above ground biomass (BY) yields, Harvest index (HI) and thousand seed weight (TKW) analysis results on effect of phosphorus fertilizer for faba bean varieties at Kulumsa area in Tiyo district.
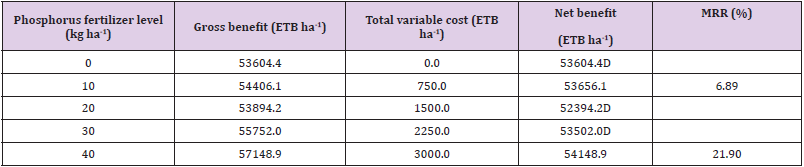
Table 3: Partial budget analysis on effect of phosphorus fertilizer for faba bean at Kulumsa area of Tiyo district.
Note: D =Dominated, Phosphorus fertilizer price = 15.00 ETB kg-1, faba bean grain price = 15.00 ETB kg-1.
Partial Budget Analysis
The maximum net economic return of 54148.9ETB ha-1 was obtained from the application of 40 kg ha-1 phosphorus fertilizer rate. Accordingly, treatments with no application of phosphorus fertilizer could be economically feasible for faba bean production and be recommended in the area and similar agro-ecologies (Table 3).
Conclusion and Recommendations
The soil analysis result of experimental sites collected after harvest showed that, effect of faba bean varieties were significant (p < 0.01 and p < 0.001) on pH, total N, and organic carbon soil contents of experimental sites. Analysis of variance revealed that application of P fertilizer levels had significant (p < 0.01 and p < 0.001) effect on pH, available P and organic carbon, but not significantly (p <0.05) affected total N for samples taken from experimental sites. Results indicated that the variety by P fertilizer level interaction (VxP) effect was significant (p < 0.01 and p < 0.001) on pH, available P, total N and organic carbon soil contents at Kulumsa area in Tiyo district. The maximum grain and above ground biomass yield (5197 and 11652 kg ha-1) in 2018 and minimum (2743 and 6989 kg ha-1) in 2017 and 2019 cropping seasons were obtained, respectively, up on the application of phosphorus fertilizer rates. In terms of variety, the grain and above ground biomass yield were not significantly different. Numerically superior grain and above ground biomass yield (3934 and 9231 kg ha-1) were obtained from the application of 40 kg ha-1 phosphorus fertilizer, respectively. The highest net economic return of 54148.9ETB ha-1 was obtained from the application of 40 kg ha-1 phosphorus fertilizer level. Generally, treatments with no application of phosphorus fertilizer could be economically preferable for faba bean production for the present study which could require further research study in the area and similar agro-ecologies.
Follow us for more Articles on: https://biomedres01.blogspot.com/
https://scholar.google.com/citations?user=OFtUOZYAAAAJ&hl=en
https://www.base-search.net/Search/Results?lookfor=Biomed+Journal+of+Scientific+%26+Technical+Research&l=en&refid=dcsuggesten
https://citefactor.org/journal/2574-1241/biomedical-journal-of-scientific-technical-research
https://ideas.repec.org/s/abf/journl.html
https://econpapers.repec.org/article/abfjournl/
https://www.ncbi.nlm.nih.gov/nlmcatalog/101723284
https://bjstr.org/
https://bjstr.org/about.php
https://biomedres.us/reprints.php
https://biomedres.net/submit-manuscript.php
https://independent.academia.edu/BJSTRAngelaRoy