Wednesday, July 31, 2024

Production, Reproduction, Metabolism, and Health of Heat-Stressed Purebred vs. Crossbred Holstein Cows


Production, Reproduction, Metabolism, and Health of Heat-Stressed Purebred vs. Crossbred Holstein Cows

Introduction

Crossbreeding is the mating of individuals from different breeds. A foundational aim of crossbreeding is to utilize desirable traits from two or more different breeds. Another goal of crossbreeding would be to take the advantage of heterosis Falconer, et al. [1]. Crossbreeding has received interest from dairy producers over the past 20 years. Heins, et al. [2] reported that more than 95% of the US dairy cattle were purebred Holstein. Because of the superiority of Holstein cows in terms of milk production, it has become the dominant dairy breed throughout the world over time. However, dairy producers have observed remarkable declines in fertility and survival and increased culling rates in purebred Holstein herds over the past few decades Norman, et al. [3]. One strategy to minimize heat stress effects on dairy cows is to selecet animals that are more resistant to heat stress. Heat stress is a major concern affecting milk production, reproduction, and health of dairy cows during hot and humid conditions Bernabucci, et al. [4]. The ambient Thermal- Humidity Index (THI) is a suitable measurement to express heat stress. Rectal temperature is a physiological parameter that could predict the severity of heat stress in dairy cows. It is believed that milk synthesis in mammary tissue begins to decline when the THI reaches 72 Bernabucci, et al. [4]. Recent data from the University of Arizona show that milk production in high milk-producing dairy cows starts to decrease at a THI of roughly 68. Cow becomes more sensitive to thermal stress as milk production increases Zimbelman, et al. [5]. Increasing milk production from 35 to 45 liters per cow per day increases sensitivity to heat stress and decreases the threshold temperature by 5 degrees celsius. Researchers reported that the THI two days earlier had the greatest effect on milk yield. Overall, therefore, dairy producers tend to cross pure Holstein heifers and cows with other breeds’ bull semen in an affort to reduce challenges and complications associated with heat stress.

Over the past decades, dual-purpose breeds (e.g., Montbelliard and Simmental) have been introduced to Iran and many other countries around the world to be crossed with purebred Holstein cows. To our knowledge, no study has compared purebred Holstein cows vs. crossbred Holstein×Montbeliarde and Holstein×Simmental cows under intensive dairy farm systems during hot and humid summer conditions. Crossbred lactating cows were hypothesized to outperform Holsteins in fertility and health traits under environmental stresses. The objective of this study was, therefore, to compare production, reproduction, metabolism, and health of purebred Holstein cows vs. crossbred Holstein×Montbeliarde and Holstein×Simmental cows under hot and humid conditions of northern Iran (Sari, Mazandaran).

Materials and Methods

Dairy crosses were produced by crossing Holstein (H) cows with Montbeliarde (from France) and Simmental (from Germany) bulls’ semen. The performance and health of 70 primiparous cows from each breed (210 cows in total) were compared during their first lactation. This experiment was conducted at Mahdasht Dairy Facilities of Dasht-e-Naz Co., in Sari (Mazandaran, Iran). The experimental heifers’ parturition occurred approximately at 24 months of age. Calving and reproductive data including the first and last insemination date, parturition date, and calving ease were recorded. As a result, traits such as days until first service, days open, insemination times, and days between the first and last service were obtained. The success for the first service was recorded as 0 being no success and 1 being success. Calving ease or difficulty (or calving status) was categorized 1 to 5, with 1 being natural calving, 2 being calving with the assistance of one individual, 3 being calving with the assistance of two individuals and some damage to calf, 4 being calving with the assistance of several individuals and large damage to calf, and 5 being calving needing cesarian. The frequqncy of some categories (i.e., 4 and 5) was low. As a result, to prevent Extreme Category Problem (ECP) while analyzing the data, the categories 1, 2, and 3 were considered as calving with ease and the categories of 4 and 5 were considered as calving with difficulty.

Stillbirth was defined as calf death shortly before calving, while calving and/or 24-48h post-calving. Stillbirth was scored as either 0 (no stillbirth) or 1 (stillbirth). The entire calf and heifer production systems and conditions were the same for all three experimental genetic groups. To monitor metabolic parameters (glucose, BHBA, NEFA, calcium and magnesium), blood samples were collected from tail vein at 21 d prepartum, parturition, and 21 d postpartum. Blood was sampled from 15 cows from each group. Blood was let to coagulate to harvest serum after centrifuging at 2500rpm for 10min. Serum was stored at -20 degrees celsius until metabolites measurements in Mabna Laboratory (Karaj, Iran). Concurrent with blood sampling, body condition was scored using a same trained individual based on a 1 to 5 scoring system, with 1 being an emaciated cow and 5 representing an obese cow. Milk yield recording for individual cows started at 5 d postpartum and continued monthly until drying-off. Milk samples from individual cows were taken monthly and analyzed for milk composition including fat, protein, lactose, and Somatic Cell Count (SCC). Cow type scores were given by a trained individual using a 100-point scoring system. Cow type traits included udder traits (connection, length, and teat properties), body traits (dairy characteristics and strength), and legs and hooves properties. Since milk SCC did not have normal distributions, the Box-Cox algorhythm was utilized (SAS, Version 9.1) to convert SCC to Somatic Cell Scores (SCS).

By using the Box-Cox algorhythm, 𝛌 value was determined in a way to normalize data distribution. The 𝛌 value for SCC conversion to SCS was calculated to be -0.25. Data for milk production, reproduction, blood metabolites, and BCS as well as SCS were analyzed by using the Mixed Model of SAS program SAS [6] with fixed and random effects. Fixed effects incuded breed (i.e., genetic group), calving season, bleeding month, parity, time, and interactions, plus calving age as covariate. Randon effects included cow within breed (i.e., group) and residuals. For the analysis of health data and the first service success, LOGISTIC procedures were utilized. The effects included calving season, calving age, the first month of service, calf gender, calf age, pregnancy length, service season, calving ease and parity.

Heat tolerance at the hottest time of day in summer was determined by measuring rectal temperature. Fiftheen cows were randomly selected from each genetic group and rectal temperature was determined weekly during summer months at 1400h by using a digital thermometer. To measure and record rectal temperature, the thermometer was inserted and kept in rectum for 60 seconds. The ambient minimum, maximum, and average THI were calculated by using the following formula (6):

Uterus infections (metritis), mammary infections (mastitis), laminitis, lameness and other diseases were diagnosed and recorded by an experienced veterinarian. A case was diagnosed as metritis if a cow would have a rectal temperature of > 39.5 degrees celsius with watery, mucosal, and bad-smelling secretions from reproductive tracts for 14 days postpartum. Lamaness severity was given visually a score of 1 to 5, with the score of 5 being an overly lame cow. A case was diagnosed as retained placenta (RT) if fecal membranes were not expelled within 24h postpartum.

Results and Discussion

The THI data for Mahdasht dairy farm are presented in Table 1. The data clearly showed that maximam summer THI was considerably greater than the range (i.e, 68-72) when heat stress begins to occur. In other words, cows were suffering from severe heat stress during summer months. However, cows were not facing heat stress during winter (Table 1).

biomedres-openaccess-journal-bjstr

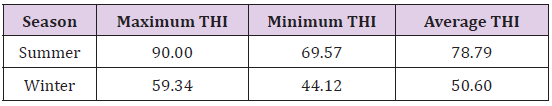
Table 1: Maximum, minimum, and mean temperature-humidity index (THI) of the dairy farm in summer and winter.

Reproductive Traits and Indices

Least square means for reproductive traits of the purebred Holstein and crossbreed cows are presented in Table 2. The effect of breed (genetic group) on days until first service, service numbers for each pregnancy, days open, the first service success, and the interval between the first and last services was not significant (P > 0.05). Similar to the current study, days until first service were not different between puredbred Holstein cows and crossbred Holstein×Ayrshire cows Vesley, et al. [7]. In another study Touchberry [8], the days open for crossbred Holstein×Guernsey cows were 3 days longer, when compared to purebred cows. However, significant effects of genotype on cow pregnancyrelated traits have been reported. For instance, pregnancy rate was greater for Holstein×Montbeliarde and Holstein×Simmental compared to purebred Holsteins Heins, et al. [8-10]. In addition, crossbred cows had shorter days open than did purebred Holsteins Hazel, et al. [10,11]. Possible reasons for such positive impacts of crossbreeding on cow pregnancy could be heterosis and interbreed complementary properties as well as lower dystocia and stillbirth, and the greater BCS of the crossbred cows.

Milk Production

The data for milk production including least square means and standard errors were shown in Table 3. Production of milk and milk fat and protein in the entire lactation (305 days) were not statistically different among the three genotypes (P > 0.05). These findings were in agreement with other reports Hazel, et al. [2,11]. One reason that may decrease dairy farmers’ interest towards crossbreeding is the likelihood of decresed milk production by crossbreeding. As such, milk production in the entire 305 days of lactation was numerically greater for the purebred Holstein cows than for the cross-bred cows. However, this difference was not statistically significant that is thought-provoking in light of the reasonably adequate sample size of the current experiment. In a study by Heins, et al. [2], yields of milk fat and protein were greater for purebred Holsteins than for crossbred cows. However, in another study Dechow, et al. [12]. Holstein×Brown Swiss crossbred cows produced more milk fat and milk protein over 5 lactations than did purebred Holsteins. This was the case in another crossbreeding study during the first lactation Swalve [13]. The reason for these findings was reported to be heterosis. In contrast, in a recent study by Shonka-Martin, et al. [14], crossbred cows had lower milk volume than did purebred Holstein cows while milk fat and protein production was not different. The lack of any differences in milk production between genetic groups in the present study revealed that crossbred cows did not outperform purebred Holstein cows.

biomedres-openaccess-journal-bjstr

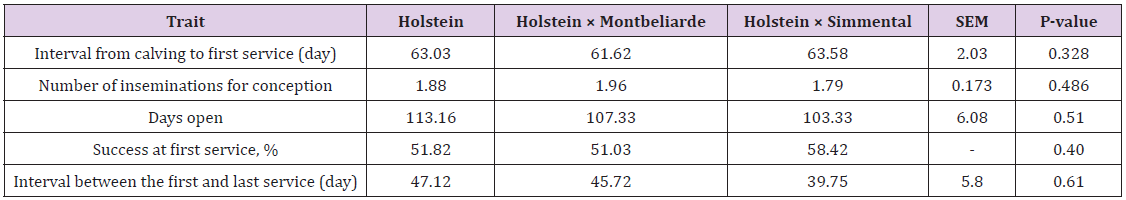
Table 2: Reproductive indices of the purebred Holstein vs. crossbred Holstein × Montbeliarde and Holstein× Simmental cows during their first lactation.

biomedres-openaccess-journal-bjstr

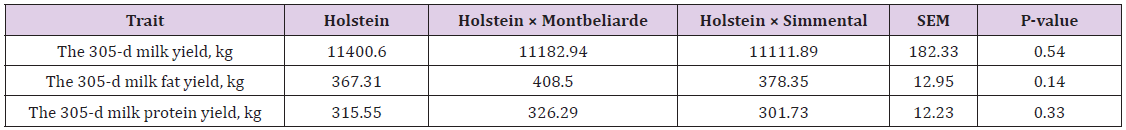
Table 3: Milk and milk fat and protein production of the purebred Holstein vs. crossbred Holstein × Montbeliarde and Holstein× Simmental cows during their first lactation.

Health Traits and Indices

Health related traits and indices are presented in Table 4. Genotype effect on stillbirth, retained placenta, sole heamorrhage, and mastitis were not significant (P > 0.05). Dystocia tended to occur more frequently in the Holstein×Montbeliarde cows than in the purebred Holstein cows (P < 0.10). Also, metritis frequency was greater in the crossbred cows than in the purebred Holstein cows (P < 0.05). In another study, however, the first-parity purebred Holstein cows had more stillbirth (14 vs. 6.2%) and dystocia (17 vs. 7.2%) than did crossbred Holstein×Montbeliarde cows Heins, et al. [15]. Others Vesely, et al. [7] also reported that stillbirth rate was greater in purebred Holsteins than in crossbred cows, possibly because of heterosis and improved cow health through crossbreeding. In an investigation by Mendonça, et al. [16], immune response was greater, and thus, post-calving disease incidence was lower (35 vs. 57%) for crossbred Holstein×Montbeliarde cows than for purebred Holstein cows. The inter-study differences in health responses to crossbreeding could at least partially be attributed to different environmental conditions. Notably, in the current study, cows were exposed to stressful (hot and humid) environments, which may have affected cow responses to crossbreeding. Overall, in the present study, crossbreeding did not offer any advantages over purebreeding from health perspectives. Even, crossbreeding compromised cow health in some aspects, as discussed above.

BCS and Blood Metabolites

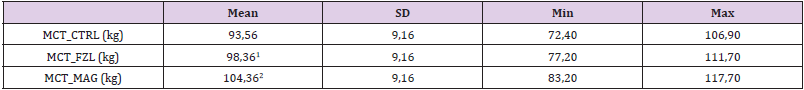
Least square means for selected blood metabolites, rectal temperature, and BCS for the purebred and crossbred cows are shown in Table 5. The BCS during the transition period was significantly greater (P < 0.05) for the crossbred cows than for the purebred cows. Probably, as a result, the crossbred Holstein×Montbeliarde cows experienced increased dystocia and metritis, when compared to the purebred Holstein cows (Table 4). Likewise, other studies have also reported greater BCS for crossbred cows than for purebred Holsteins Bjelland, et al. [8,11,17]. For instance, in a study by Hazel, et al. [11], the BCS was 3.36 for Holstein×Montbeliarde cows and 2.87 for purebred Holsteins. These BCS results suggest that energy partitioning is at least in part dependent upon genetics Veerkamp, et al. [18]. The lower BCS of the purebred Holstein cows was likely because of genetic selection for milk production and dairy charactertics. Blood concentrations of glucose, NEFA, BHBA, calcium and magnesium were not statistically different among genetic groups (P > 0.05; Table 5). These results were in agreement with other findings Heins, et al. [2], suggesting that energy status was probably not different between the crossbred cows and purebred Holstein cows. Rectal temperature measured during summer and at hottest time of the 24-h periods was similar among the genetic groups (P > 0.05). This similarity suggests that the purebred Holstein cows were not different than the crossbred cows in resistance to stressful ambient conditions.

biomedres-openaccess-journal-bjstr

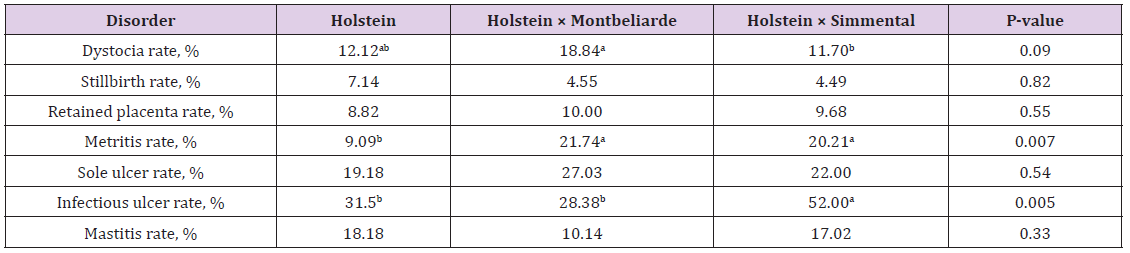
Table 4: Health issues in the crossbred groups and the purebred Holstein cows.

Note: abMeans with different superscripts within each row are statistically different (P < 0.05)

biomedres-openaccess-journal-bjstr

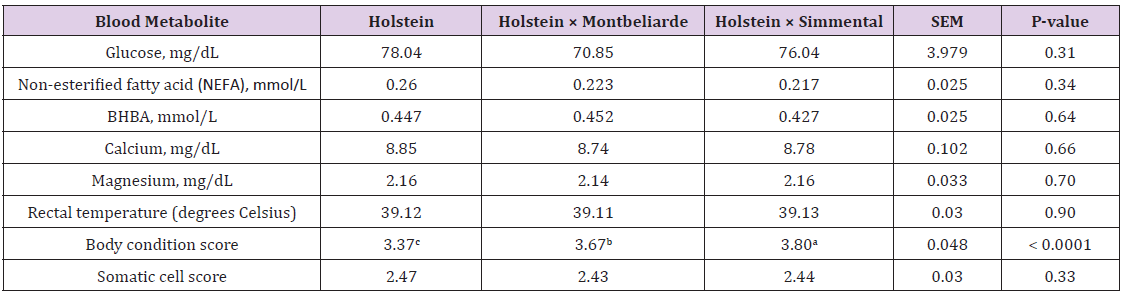
Table 5: Least square means of blood metabolites for the purebred Holstein, and the crossbred Holstein × Montbeliarde and Holstein× Simmental cows.

Note: abMeans with different superscripts within each row are statistically different (P < 0.05).

Body and Type Traits

Least square means and standard errors for type traits for the crossbred and purebred Holstein cows are presented in Table 6. The results showed that udder-related traits were more favorable (P < 0.05) for the purebred Holstein cows than for the crossbred cows. As such, dairy characteristics were more pronounced in the purebred Holstein cows than in the crossbred cows. Teat length was, however, similar (P > 0.05) among the genetic groups (Table 6), confirming some of other reports Hazel, et al. [11]. Similar to the current study, front and read teats positions were wider in Holstein cows than in crossbred cows. This was probably because of genetic selection for dairy teat properties in purebred Holstein cows Heins, et al. [19]. Previous studies have also shown that purebred Holstein cows were taller than crossbred cows Bjelland, et al. [17]. Genetic selection for dairy properties over the last few decades has led purebred Holstein cows to have high-merit performance Hansen [20]. Udder width and dairy charactertics have intermediate genetic correlation with milk production traits, such that high-producing heifers possess wider udders and more pronounced dairy properties, when compared to low-producing peers Hazel, et al. [11]. Leg angle was sharper (P < 0.05) in the cross-bred cows than in the purebred Holstein cows (Table 6), which was in agreement with the literature Hazel, et al. [11]. One of the advantages of crossbreeding is the improvement of body strength Häggman, et al. [21]. As such, body strength was improved by crossbreeding in the present study (P < 0.05, Table 6) [22-26].

biomedres-openaccess-journal-bjstr

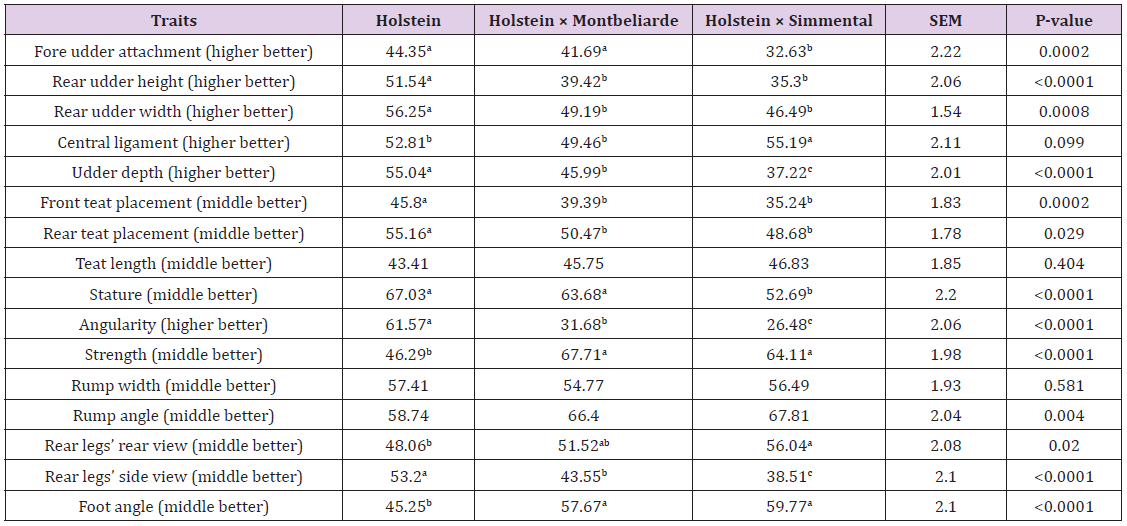
Table 6: Least square means for linear type traits of the purebred Holstein cows and crossbred cows.

Note: 1Traits listed in this table were scored on a 100-basis scoring system.
abMeans with different superscripts within each row are statistically different (P < 0.05).

Conclusion

The findings of this study confirmed that crossbreeding Holstein cows with Montbeliarde and Simmental bulls’ semen did not improve production, reproduction, health, and metabolism under stressful hot and humid conditions of northern Iran. The Holstein×Montbeliarde and Holstein×Simmental crosses experienced more dystocia and lameness, respectively, compared to the purebred Holstein cows. The crossbred cows suffered more from metritis, when compared to the purebred Holsteins. Therefore, the results suggested that crossbred cows would not be suitable replacements for purebred Holstein cows under stressful hot and humid conditions.


For more Articles on: https://biomedres01.blogspot.com/

Tuesday, July 30, 2024

Preclinical Evaluation of 124I-Radionuclide for PET/CT Imaging System


Preclinical Evaluation of 124I-Radionuclide for PET/CT Imaging System

Introduction

In recent years, PET/CT is considered as an essential multimodality imaging that commonly used in oncology due to its ability to providing both anatomical and functional information. PET/CT has an important value in the detection and staging of several types of cancer. It can improve cancer diagnosis and follow-up the assessment of tissues response to treatment. The PET/CT imaging can help in detection of small lesions. These developments are showing dramatically in the advance generations of PET/CT which include new software, hardware, and acquisition methods [1], for example it introduces some new image reconstruction methods such as time –of- flight (TOF), a continuous bed motion and combined PET with other modalities. These growths in PET/CT can influence on cancer imaging as the can produce better image quality and more accurate details of therapy monitoring and uptake [1]. Fluorine -18 (18F) is considered as a gold standard positron emitter in PET imaging, it has a widely uses in imaging applications when it is labelled with some pharmaceutical compounds such as 18F-fluorodeoxyglucose (FDG),18F-fluoromisonidazole,18F-fluoroazomycin-arabinoside, and 18F-fluoro-3'-deoxy-3'-L-fluorothymidine. Nowadays, PET imaging plays an important role in radioimmunotherapy (RIT) which known as Immuno-PET and it is used to estimate cancer treatment with monoclonal antibodies (mAbs) [2].

The best radionuclides for these applications should has a physical half-life matches the biological half-life of antibodies (mAbs) or pharmaceutical molecules in circulation, so that other positron emitters with half-life greater than 48h are being used such as 124I ,89Zr and Y90 [3]. Each of these isotopes has different physical characteristics for instance positron energies, positron ranges and fraction of single photons emitted [3]. The long physical half-life of I-124 which is about 4.2 days make it suited in vivo studies. Despite this optimal characteristic for matching with mAbs, two main features can be expected to limit the image resolution in in preclinical PET imaging, one is the high energy and therefore long range of the emitted positrons. Pre-clinical imaging on animals are critical tools to explore multi-scale variations i.e. from organ, tissue, cell, down to molecular levels, resulted due to physiological, pathological or pharmacological changes, Precedes to human study human clinical trials. Rapid development in PET systems can permit the translation of large scale PET imaging (which used in human and large animals) abilities to the scale of small animals by using small-animal PET [4]. The use of small animal imaging has become an effective key in translational research, it is considered as a bridge between developments in vitro studies and clinical applications in diagnosis and/or therapeutics [5].

Some of disadvantages include the high positron energy and large positron range in tissue (e.g., 68Ga and 124I) may effect on the spatial resolution of the image and produce low spatial resolution and recovery coefficient (RC). Similarly, the presence of single ɣ photons (e.g., 124I and 89Zr) can have undesirable effects on the image quality, it might increase image noise and spillover ratios (SORs). The purpose of this study was to compare some of performance parameters such as image quality and spatial resolution of 18F, 124I and 89Zr using small animal Nano-Scan PET/CT.

Materials and Methods

PET/CT Scanner

The NanoScan PET/CT system is used (Mediso Ltd) (Figure 1), which has a high sensitivity, high resolution and fully integrated small-animal PET/CT system. The axial field-of-view (FOV) of the PET ring is 10 cm. The PET system has 12 detector blocks of 81×39 Lutetium Yttrium Orthosilicate (LYSO) crystals (1.12 mm×1.12 mm×13.0 mm), tightly packed (pitch 1.17 mm, packing fraction 92%) coupled to two 256-channel position sensitive photomultiplier tubes. The detector blocks are mounted in rings of diameter 184 mm, and there are 2 rings in total. Each detector block is connected with 1, 3, or 5 blocks on the opposite direction of the ring for coincidence detection (coincidence mode 1:1, 1:3 and 1:5). The CT system is a cone-beam CT scanner. It has a flat panel CMOS detector of 15×12 cm2 Gd2O2S. The maximum current of X-ray tube is 0.18 mA, the tube voltage ranges from 30 to 80 kVp and the tube power is 50/80 W. PET data are sorted in list mode format and for image reconstruction several options can be used; filtered Back-projection (FBP), 3D projection, 2D and 3D ordered-subset expectation maximization (OSEM2D and OSEM3D, respectively). A fully 3-dimensional (3D) reconstruction using a Tera-Tomo algorithm (Tera-Tomo; Mediso Ltd.), all image quality factors are achieved for at least 30 min acquisition and image reconstruction with 52 iterations which is the default image reconstruction method of NanoScan PET/CT, also used. A multiple Graphical Processing Unit (GPUs) are used for CT reconstruction. Reconstruction is done using filtered back-projection method, with following available filters; RamLack, Hamming, Hann, Shepp-Logan, Butterworth, Cosine and BlackMan.

biomedres-openaccess-journal-bjstr

Figure 1: The Mediso NanoScan® PET/CT system with description.

Radionuclides

The radionuclides used in this study are 18124I and 89Zr. The main physical properties of these radionuclides are present in (Table 1). 18F is most commonly used in PET scan which is used for early detection of tumors and evaluation of response to cancer therapy. Moreover,18F is an essential isotope for standard measurements of PET acceptance tests suggested by NEMA NU. Today, the two others radionuclides, 124I and 89Zr, are increasingly used in PET. 124I is a radionuclide with positron abundance of approximately 23%, about 50% of all positrons are emitted simultaneously with a 603-keV gamma photon a high positron energy and a high abundance of singles. 124I has dual energy emission: beta radiation emissions of 1532 keV (11%) and 2135 keV (11%) and gamma emissions of 511 keV (46%), 603 keV (61%), and 1691 keV (11%). 89Zr is a neutron deficient isotope of Zirconium with 49 neutrons and 40 protons, and it decays with a half-life of 3.27 days to 89Y. The decay proceeds via electron capture (77%), and positron emission (23%). Both modes of decay lead primarily (99%) to a 9/2+ state in 89Y, which de-excites through M4 emission of a 909 keV gamma ray to the 1/2- ground state. Therefore, the important decay radiations are the 511 keV γ’s from positron annihilation, the 909 keV γ from the 89mY de-excitation, continuum positrons (23% endpoint = 902 keV), internal conversion electrons from the M4 transition (0.8%), and Auger electrons. The prompt photons fall outside the default energy window, apart from a portion of the down-scattered photons with lower energy.

biomedres-openaccess-journal-bjstr

Table 1: Physical properties of 18F, 89Zr and 124I [5].

Their high yield (0.99 ɣ-photons vs. 0.23 positrons) could contribute to the detector dead time [6]. Radionuclide production was carried out at King Faisal Specialist Hospital and Research Centre. 89Zr was produced through the 89Y (p, n) 89Zr reaction by proton bombardment of 89Y solid targets. Enriched Y2O3 targets in oxide form were prepared by hydraulically pressing (130–200 mg) 89Y oxide powder (130–200 mg) into circular cavity aluminum target plates at 5000 psi. The Y2O3 targets were irradiated with accelerated protons at 90° to the cyclotron beam using a CS30 cyclotron (CTI Cyclotron Systems, Berkeley, California, USA) [4]. Irradiation times were between 2 and 3 h, energy was 15 MeV, beam current was 10 μA, and the 89Zr yield obtained was around 8mCi. 89Zr was isolated with high radionuclide and radiochemical purity (>99%) as ZrClusing a solid-phase hydroxamate resin with more than 95% recovery of the radioactivity [4]. 24I was produced by the bombardment of enrich 125Te targets (150 mg ±10%) with 18 MeV protons from the IBA Cyclon 30 using 125Te(p,n)124I nuclear reaction. The targets were prepared and processed by a standard operating procedure developed in-house. In brief, irradiated targets were dissolved in a mixture of sodium hydroxide (NaOH, 1.0 mL, 5.0 N), hydrogen peroxide (H2O2, 3.0 mL, 30 %) and de-ionized water (6.0 mL).

The dissolved 125Te was transferred in 250 mL quartz reaction flask containing aluminum powder (160 mg) which was boiled until reaction is completed. Air was then bubbled through the solution for five minutes followed by bubbling of CO2 for additional five minutes. The bubbled solution was then carefully filtered through a fine fritted glass and on-line AG50W-X8 column into pre-weighed serum vial. If necessary, the pH was adjusted in the range of 5-7 with NaOH (0.01 N). Finally, 0.6 mL of the Na123I bulk solution was subjected to quality control measures for radionuclidic purity, specific concentration, pH, tellurium and aluminum spot tests. Extracted 124I was used immediately for radiopharmaceutical production [7].

Spatial Resolution

The NEMA NU-2004 is specified to evaluate the spatial resolution for 22Na only. For this reason, the transaxial spatial resolutions of the three radionuclides were measured using a new suggested method by us. For measuring the spatial resolution of 18F and 89Zr a point source was used. It was obtained by drilling a plastic plate to make a sphere with a radius less than 1 mm, and then it was filled with different isotopes. The activity was 3.37 MBq, 8.3 MBq and 0.32 MBq for 18F, 124I and 89Zr, respectively, this difference in doses of isotopes is due to an availability issue. The activity was positioned in the center of the FOV, aligned with the axis of the scanner, and then put at 10 mm and 20 mm and scanned until at least 3.5 million counts were acquired using the default energy window of 250–750 keV and timing window of 3.432 ns. Images were obtained using FBP and the 3D Tera-Tomo algorithm, which are developed for the NanoScan small-animal PET/CT scanner with the default settings (ramp filter with a cutoff at Nyquist frequency) and 512 ×512 ×159 matrices with voxel sizes of 0.1 × 0.1×0.58 mm. This matrix size was selected to obtain a profile with a sufficient number of data points to allow for the accurate determination of spatial resolution all image quality factors is achieved for at least 30 min acquisition and image reconstruction with 52 iteration . No correction was applied, whether attenuation or scatter corrections. The reconstructed images were processed to measure full width at half and at tenth maximum (FWHM and FWTM, respectively) for the point source. According to the NEMA NU-4 standards, these widths were measured in parabolic fit through the peak pixel and its two nearest neighboring pixels. FWHM and FWTM were not corrected for source geometry [2].

Image Quality

biomedres-openaccess-journal-bjstr

Figure 2: Cross-sectional diagram of NEMA NU-4 image quality phantom.

The image quality tests were done using NEMA image quality phantom (Figures 2 & 3), it is divided into three parts: the first region is a homogeneous block filled with radioactivity (30-mm diameter and 30-mm length) to determine the signal-to-noise ratio of the system. The second one consists of two chambers filled with cold water and air (length, 15 mm; outer diameter, 10 mm; wall thickness, 1 mm) to evaluate the scatter fraction in the image. The third part is a 5-rod region, these rods are used to calculate the recovery coefficient (RC) which is defined as the ratio between the measured activity concentration in the rods and the activity concentration measured in the uniform area [8]. The RC is theoretically limited between 1 and 0 (0 < RC < 1). A 2-cylinder-chamber region, one is filled with air, the other was filled with nonradioactive water, are used to measure the spillover ratio (SOR) in water and air [2], which defined as the mean value in each cold cylinder divided by the mean in the uniform area and its theoretically value is range between 0 and 1 [2]. The percentage SD% which is considered as a measure of noise was determined by using the uniform region at the central of phantom. The phantom was filled with a specific isotope and the injected activity was 3.7 MBq. The scanning time was 20 minutes, a 5-ns time window and a 400-to-600 keV energy window. The measurement was performed in the normal-count mode of the scanner in 1:3 and 1:5 coincidence modes. In addition to the 2D-OSEM reconstruction image, the acquired data were reconstructed with default reconstruction algorithm of the system, Tera-Tomo reconstruction method. The image quality tests include; uniformity, recover coefficients and accuracy of correction.

biomedres-openaccess-journal-bjstr

Figure 3: Spatial resolutions for 3 radionuclides measured with 3D-reconstruction and 2D- reconstruction.

Results

In the following sections, the results for spatial resolution and image quality parameters are presented. The obtained values of three radionuclides are summarized in (Table 2).

Spatial Resolution

The spatial resolution measurements using a point source of each radionuclide reconstructed with a Tera-Tomo 3D PET algorithm and with FBP-reconstruction image are presented in (Table 2). The spatial resolutions of tangential and radial direction at the center were averaged to calculate FWHM and FWTM. The FWHM were 0.9 mm, 1.0 mm and 1.7 mm for 18F, 89Zr and 124I, respectively, when using 3D-reconstruction method. While the spatial resolution values were lower when used FBP-reconstruction method, the FWHM values were 2.0 mm, 2.0 mm and 2.6 mm for 18F, 89Zr and 124I, respectively. According with Gaussian profile, the FWHM to FWTM ratio equal to  
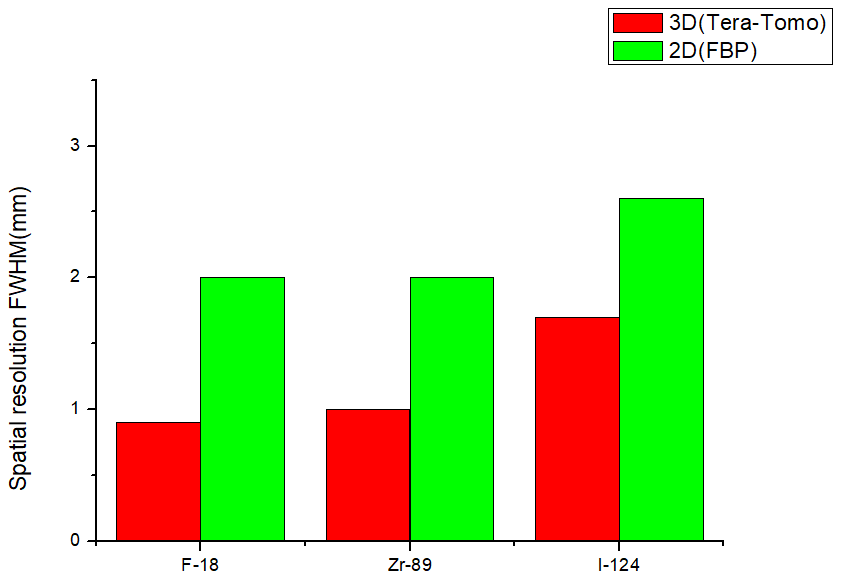
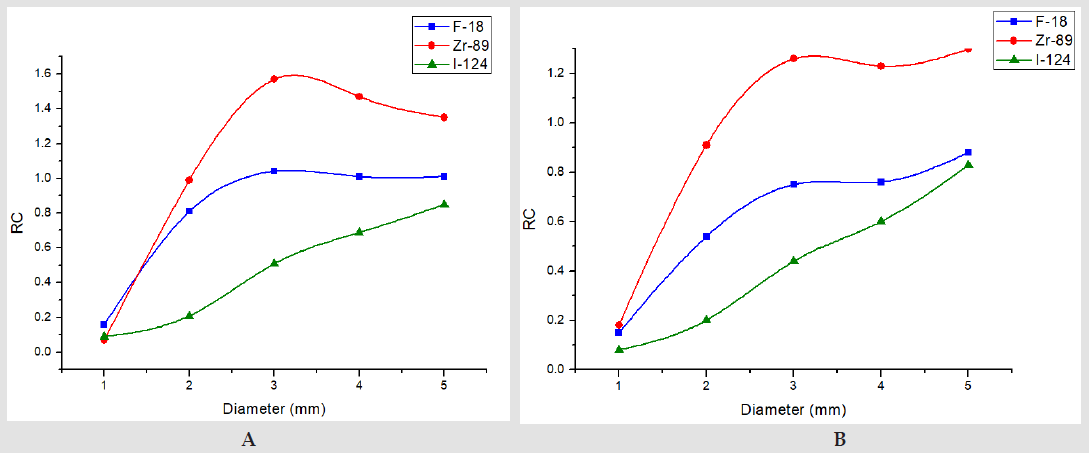
= 0.55, nongaussian profiles with extended tails are characterized by smaller FWHM-to-FWTM ratios [2]. Palmer, et al [9] and Disselhorst, et al [2] have measured spatial resolution and determined the corresponding FWHM to FWTM ratios, and they have showed that 18F have produced the best value of spatial resolutions and theoretic ratios (0.54 and 0.51 respectively). The data in Table 2 show that the

values of spatial resolution improve when using Tera-Tomo algorithm more than those in FBP algorithm for all isotopes, these values were 0.9, 1.0,and 1.7 mm for 18F, 89Zr and 124I, respectively. In addition, these data indicate that 18F provided the best values as compared to other isotopes (0.45) where the measured ratio of 89Zr (0.43, 0.5 and 0.5%, respectively) and for 124I (0.4, 0.39 and 0.41% respectively) are lower and we observed the same effect when we use 2D reconstruction (see Tables 2 & 3).

biomedres-openaccess-journal-bjstr

Table 2: Spatial resolutions for each radionuclide measured with Tera-Tomo and FPB reconstruction algorithm.

biomedres-openaccess-journal-bjstr

Table 3: The SOR values of 3 different isotopes.

Image Quality Results

Uniformity

The %SD of the NEMA Nu-4 image-quality phantom is shown in (Figure 3). The largest differences are not obtained between 18F and 89Zr but it seems clear with124I. Comparable values were obtained with F-18 and Zr-89, however I-124 showed a 47% higher value. For 124I, the % SD is greater than the values that were found for 18F and 89Zr. Moreover, among the different reconstruction algorithms for 124I there was a significant increase, where Tera-Tom yielded %SD value smaller than those obtained by FBP, it has shown 47% increase than those obtained by FBP.

Accuracy of Corrections

The spill-over ratio (SOR) in cold regions is calculated to find the accuracy of activity correction. The spill-over ratio and STD % in the water- and air-filled cylinders are given in (Table 3). These results are obtained for 2D OSEM and 3D Tera-Tom. The difference in SOR in water was large between18F and124I, it was about 0.88. 18F has higher SOR value when used Tera-Tomo algorithm or FPB algorithm, it was 1.0 and 0.95, respectively, while 89Zr and 124I have lower SORs values than 18F. For 89Zr, we found a reduction in SOR value when use Tera-Tom algorithm, it was 0.16 where it was about 0.2 when using FPB algorithm. These values were 0.12 and 0.16 respectively, for 124I. The difference in SORs in air field chamber are shown in (Figure 4a). (Figure 4b) illustrated the effect of the image reconstruction algorithms on the SORs values for each radionuclide. There were no significant variations in SORs values between 18F ,89Zr and 124I when used Tera-Tomo reconstruction method, the SORs values were 0.15,0.17 and 0.16 for 18F ,89Zr and 124I, respectively. In the case of using FBP reconstruction algorithm, the SORs values were increased for 18F and89Zr, they were 0.23 for both 18F and89Zr where the SOR value of 124I decreased by 52% as compared with 18F and 89Zr, it was 0.11 for 124I (Table 4). The attenuation and scatter correction were not used because it did not install on the system.

biomedres-openaccess-journal-bjstr

Figure 4: %SD in uniform phantom region of 18F, 89Zr and 124I with different reconstruction algorithm performed with no correction.

biomedres-openaccess-journal-bjstr

Table 4: The recovery coefficient(RC) values of 3 different isotopes.

RCs

The RC values and (STD%) using 3D and 2D reconstruction are summarized , (Figure 5) represents the data. A significant difference was introduced for different radionuclides. The smallest values of RC were found for 124I as compared to 18F and 89Zr, but this variation not obtained for different reconstruction algorithms. A high reduction in RC value was observed for 18F when used FBP reconstruction. 89Zr has the highest value of RC in both cases of different reconstruction algorithms (Figure 6). The maximum difference was shown for 3 mm rod. In all results that discussed above, no attenuation or scatter corrections were used.

biomedres-openaccess-journal-bjstr

Figure 5: SORs in
A. Water and
B. Air
compartments for various radionuclides, reconstructed with 2 different algorithms.

biomedres-openaccess-journal-bjstr

Figure 6: RCs of different rods for various radionuclides, reconstructed with
A. Tera-Tomo and
B. FBP.

Discussion

Several studies have studied the effective parameters on the image quality of some long-half-life positrons, such as 89Zr, 124I, and 68Ga. This study looks at the imaging properties of 124I and compares them to those of 18F when it is used with a small animal NanoScan® PET/CT scanner. As mentioned in the Lubberink study [10], positron energy is one of the most important factors affecting image resolution. He showed that 124I emits positrons with energies ranging from 686 to 973 Kev, while 18F emits positrons with a mean energy of 250 Kev and 89Zr with 389 Kev. This increase in positron energy of 124I results in a reduction in spatial resolution. On the other hand, The greater positron ranges of 124I, on the other hand, have an effect on spatial resolution, which is more severe in small animal PET than in human whole-body PET. The theoretical spatial resolution for small animal PET is 1.3 mm and 2.9 mm for 18F and I-124, respectively [10]. As expected, the results of the point source are consistent with previous studies. The positron range limits the spatial resolution in pre-clinical systems [3]. 124I, with a mean positron range of about 3.48 mm, has significantly low resolution (high value of FWHM) as compared with 89Zr and 18F. There was a 47.6% reduction. This is consistent with other studies, such as Liu and Laforest's [11] study, which evaluated the resolution of 76Br using designed phantoms in a high-resolution small animal PET scanner and found that 76Br can achieve 2 mm of spatial resolution while 18F can only achieve 1.7 mm.

De Jong, et al. [11] have analyzed the imaging characteristics of 68Ga (Emax = 1.9 MeV, + range = 3.1 mm), 124I (Emax = 2.1 MeV, + range = 3.0 mm), and 89Zr (Emax = 0.9 MeV, + range = 1.23 mm), and they found that 18F has the best resolution of all isotopes investigated, followed by 89Zr, because of their relatively shorter positron range as compared to 68Ga and 124I [12]. Additionally, a study by Lee, et al. [13] showed that the spatial resolution of 124I was degraded by 19.9% compared to that of 18F on the ECAT HR+ scanner (Siemens Healthcare GmbH). Alanazi, et al. [4] have shown that there was a 2.2% decrease in spatial resolution measured at 1 cm off-axis for 89Zr in comparison with the obtained value of 18F Radial and tangential spatial resolution values measured at 10 cm off-axis have 2 and 4.1% reductions for 89Zr in comparison with 18F, respectively. This shows that 18F has a significantly higher resolution than 89Zr. The SOR values were the highest values in the water-filled compartment for 18F, while they were close to each other for 124I and 89Zr. On the other hand, in the case of an air-filled compartment, the results have shown no significant difference when Tera-Tomo 3D reconstruction was used. This may be because we did not use any correction, scatter, or attenuation. This can have caused the positrons emitted in the body part of the phantom to annihilate in the water-filled scatter compartment. The scatter and single photon have the main contribution to the SORs [4].

In a perfect system, the optimal limit of the recovery coefficients (RC) is supposed to equal 1. For both isotopes, the RCs discovered in this test had lower RC values when reconstructed using the 2D reconstruction algorithm than when reconstructed with the 3D reconstruction algorithm. For F-18 utilizing 2D, the RC values were approaching 1 for rods with a long diameter of 3 mm, 4 mm, and 5 mm, and about 1 for Zr-89. While for rods with diameters of 3 mm, 4 mm, and 5 mm, the RCs values determined using the 3D reconstruction algorithm exceeded 1 for both F-18 and Zr-89. When employing the 2D and 3D reconstruction algorithms, there was no significant difference in the RC values of I-124. This effect is known as the Gibbs effect [14]. These RC values match those published by Nagy [15] for NanoScan PET/MRI system rods with diameters of 1 mm and 2 mm. According to Goertzen [16], the RC values are highly dependent on the reconstruction algorithm. In addition, the prompt ɣ-photons for 124I and 89Zr have contributed to image noise and caused an increase in STD%. This appeared clearly in 124I. The results of RC values have shown the effect of positron range. A significant reduction was observed for 124I. These results are compatible with those obtained by Liu, et al. [17] where they found the RCs values of radionuclides which have a longer positron range, such as 61Cu and 68Ga, than 18F, were lower than the RCs values of 18F. The corrected RCs in medium and smallest spheres ranged from 75% to 90% for 61Cu and 68Ga, where s for 18F are close to 100%. Lubberink, et al. [10] investigated the effect of image resolution degradation for 124I on recovery, and they showed that recovery for 124I was considerably worse than for 124I, even for spheres as large as 37 mm in diameter.

Conclusion

In this study, the image quality parameters and spatial resolution were evaluated for nonconventional radionuclides such as 124I and 89Zr using the small animal NanoScan® PET/CT scanner. The presence of prompt ɣ -photons and the higher positron range are two major issues that can limit image quality performance. The high differences in the SOR and significant reduction in RCs were observed for 124I as compared to 89Zr and 18F. The best results were found for 18F. The presence of ɣ -photons effects on the image quality parameters for the high positron range, particularly SD%. Due to the no-scatter correction being used, the single photon can contribute and cause some artifacts in the image. These artifacts can cause distortions in SOR and RC values.


For more Articles on: https://biomedres01.blogspot.com/

Semaglutide in Obesity and Non-Alcoholic Fatty Liver Disease

  Semaglutide in Obesity and Non-Alcoholic Fatty Liver Disease Introduction Semaglutide injection was introduced in the US as an antidiabeti...