Developing Nomogram and Evaluating Prognostic Factors of Limb Osteosarcoma Patients: A Retrospective Study
Introduction
Osteosarcoma is a primary bone malignant tumor which is most common in children and adolescents, followed by the elderly [1]. Osteosarcoma is the most common types of primary malignant bone tumors, although malignant bone tumors have a lower incidence compared with other types of tumors [2]. The most common primary site of osteosarcoma is the metaphysis of long bones, especially the proximal tibia and distal femur, followed by the proximal humerus. It rarely appears in other parts of the body. Most patients with osteosarcoma initially show a single lesion that is highly occult, therefore it is easy to be confused with trauma or growth-pain [3]. Until the 1940s when the first resection for osteosarcoma was performed and chemotherapy was used, amputation was the main treatment intervention, which had a positive impact on the patient’s prognosis [4]. With the development of radiotherapy and chemotherapy, the survival time of osteosarcoma patients has been prolonged. Afterwards, limb salvage surgery for osteosarcoma combined with radiotherapy and chemotherapy significantly made patients have a good prognosis. However, although many patients have received surgery combined with radiotherapy and chemotherapy, they still have recurrence and metastasis. Therefore, it is very important to understand the influencing factors of the development, prognosis, and occurrence of osteosarcoma.
Although the survival rate of patients with osteosarcoma has improved in recent years, it is still very important to accurately predict the survival of patients and determine independent risk factors. Nomogram is a useful tool to solve the above problems. A nomogram is an effective prognostic tool. Hopefully, a nomogram can visually and effectively display the results of statistical analysis through images. The predictive ability and accuracy of nomogram have been widely proven in different types of cancer research. Many studies have proved that the survival time of patients with osteosarcoma of extremities is completely different from that of patients with osteosarcoma of axial bone [5,6]. To our knowledge, No researchers have found an accurate nomogram to predict the survival time of patients with limb osteosarcoma The Surveillance, Epidemiology, and End Results (SEER) database was established in 1973 and collected data from 18 cancer registries. This database covers 28% of the US population. By using this database, We collected a nationwide population-based cohort to answer the following questions:
(1) Which clinical characteristics can independently affect the survival of patients with limb osteosarcoma?
(2) Can we construct the corresponding nomogram to accurately predict the 3-year, 5-year and 10-year OS and CSS of individual limb osteosarcoma patients?
Previous studies have shown that recurrence, tumor size, metastasis and response to chemotherapy are the main prognostic factors of osteosarcoma, but these factors are only used as a single indicator for evaluating prognosis, thereby limiting their ability to accurately predict individualized survival in patients with osteosarcoma [7-9]. Considering the limitations of a single factor, we tried to develop a new prognostic model. In this study, we established a nomogram, which is an effective prognostic tool that can integrate all the prognostic factors of patients and more accurately estimate the prognosis of each patient. A nomogram is a visual expression of Cox multivariate analysis, which can be used to estimate the survival probability of a patient [10]. Because osteosarcoma has the highest incidence of all malignant bone tumors, and the most common site of incidence is the limbs. Therefore, the purpose of this study was to identify the independent prognostic factors that affect the survival of patients with osteosarcoma of the extremities and to predict the prognosis with the predictive ability of nomograms. The SEER database was widely used in clinical research of various cancers including osteosarcoma. We used the SEER database to collect sufficient clinical data for the research. The SEER database contains data on various cancers. More importantly, the database has relatively complete and updated follow-up information. We collected the clinical characteristics of patients with osteosarcoma of the limbs from the SEER database from 2004 to 2015 and analyzed the data to construct an accurate nomogram to predict the prognosis of osteosarcoma.
Methods
Data Selection
The SEER database was created by the National Cancer Institute, USA and includes 18 cancer registries, covering approximately 28% of the US population. After the approval of our registered account, we could use the patient data in the SEER database for research. This study complied with all guidelines of the “Declaration of Helsinki” on ethical considerations in human trials. The data published in the SEER database does not require any patient informed consent. We collected patient age, gender, race, diagnosis year, Tumor, Node, Metastasis (TNM) stage, grade, tumor size, treatment intervention (surgery, radiotherapy, chemotherapy), the extent of disease(EOD), survival time, cause of death, and other clinical characteristics. The inclusion criteria of this study were:
(1) The primary site is limited to limbs,
(2) Diagnosed between 2004 to 2015,
(3) The primary malignant tumor is osteosarcoma,
(4) Complete follow-up,
(5) Known survival months and death reasons after diagnosis.
The exclusion criteria were:
(1) Unknown race,
(2) Use of unknown surgery, radiotherapy, and chemotherapy,
(3) Unknown AJCC/TNM staging, Tx(Primary tumor cannot be assessed), Nx(Regional lymph nodes cannot be assessed), Mx(Distal metastasis cannot be assessed),
(4) Unknown tumor grade, size, and EOD.
Age was divided into 3 groups: 1-39, 40-59, >59 years. The races were categorized as black, white, or other (Alaska Native / American Indian, Asian/Pacific Islander). The diagnosis durations of the screened patients were divided into two groups: 2004-2009 and 2010-2015. Tumors were graded into two types; low grade (gradeⅠ, gradeⅡ) and high grade (gradeⅢ, gradeⅣ). Responses on surgery, radiotherapy, and chemotherapy were divided into yes or no. Otherwise, tumor sizes were categorized into 3 groups: 1-50 mm, 51-99 mm, and >99 mm. AJCC osteosarcoma staging system has divided the extent of disease (EOD) into three types [9]: Localized (tumor confined to the periosteum), regional (tumor extended beyond the periosteum without distant metastasis), and distant (having the metastatic disease at presentation).In this study, 59 patients had distant metastasis. The number of these patients was small. So these patients were included in the regional group. Finally, the extent of tumor disease was divided into two groups: localized and regional/distant.
Statistical Analysis
According to the above inclusion and exclusion criteria, we collected 1383 samples of limb osteosarcoma and randomly divided them into two cohort in the ratio of 7:3 to construct and verify the nomogram (Figure 1). Training cohort had 968 samples and validation cohort had 415 samples. The chi-square test was employed to compare the clinicopathological characteristics of patients between the training group and the verification group. A univariate Cox analysis was employed in the training cohort to determine different prognostic factors (e.g., age, race, sex, tumor size, year of diagnosis, grade, AJCC/TNM stage, surgery, radiotherapy, chemotherapy, EOD) included in the current study. Then the possible prognostic factors in univariate analysis were included in the multivariate Cox analysis (p<0.05) to determine independent prognostic factors (p<0.05). We also examined the hazard ratio of each variable and used the independent prognostic factors selected in the multivariate Cox analysis to construct a nomogram showing 3-, 5-, and 10-year OS and CSS. OS indicates the time from the date of diagnosis to death due to any cause. CSS is defined as the time from the diagnosis of the tumor to the death of the tumor. We evaluated the predictive ability of the nomogram through the calibration curve and the consistency index (C-index). The C-index ranges from 0.5 to 1.0 (0.5 means complete disagreement; 1.0 means complete agreement, c-index >0.7 means that the model has good accuracy).
We established a calibration curve to determine the consistency of the predicted survival period with the actual survival period. The above statistical analyses were performed by using statistical software SPSS, version 25.0 (IBM Inc, USA) and R software (version 4.0.2) (Figure 1).
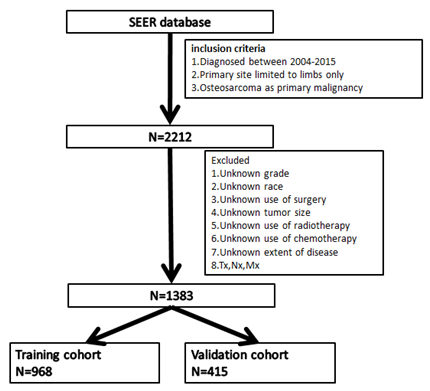
Figure 1: Flow chart.
Results
Clinical Data of the Studied Cases
The clinicopathological characteristics of included patients are shown in (Table 1). Among the 1383 patients with limb osteosarcoma, 1126 (81.4%) were younger than 40 years old, 159 (11.5%) were 40-59 years old, and 98 (7.1%) patients were older than 59 years. Tumors tend to occur more in young people. In terms of sex, 772 (55.8%) were male and 611 (44.2%) were female. In terms of race, Whites showed a higher proportion of patients (74.8%). Osteosarcoma usually had a higher tumor grade. There are 152 cases (11.0%) of low-grade (grade Ⅰ, grade Ⅱ) osteosarcoma, and 1231 cases (89.0%) of high-grade (grade Ⅲ, grade Ⅳ) osteosarcoma, and they tended to occur in the lower limbs (1162, 84.0%). Since the number of cases of distant lesions was small (59), we clubbed distant lesions and regional lesions into one group, including localized lesions (466) cases (33.7%), regional lesions/distant lesions (917) cases (66.3%). Most of the patients received surgery (n=1316, 95.2%) and chemotherapy (n=1193, 86.3%), and fewer patients received radiotherapy (n=53, 3.7%). At the last follow-up, 448 (32.4%) patients died, out of them 389 cases (28.1%) died of osteosarcoma. There were no significant statistic difference observed between the training group and the validation group in terms of patient’s race, sex, age, primary site, tumor size, year of diagnosis, EOD, surgery, grade, AJCC/TNM stage, radiotherapy and chemotherapy.
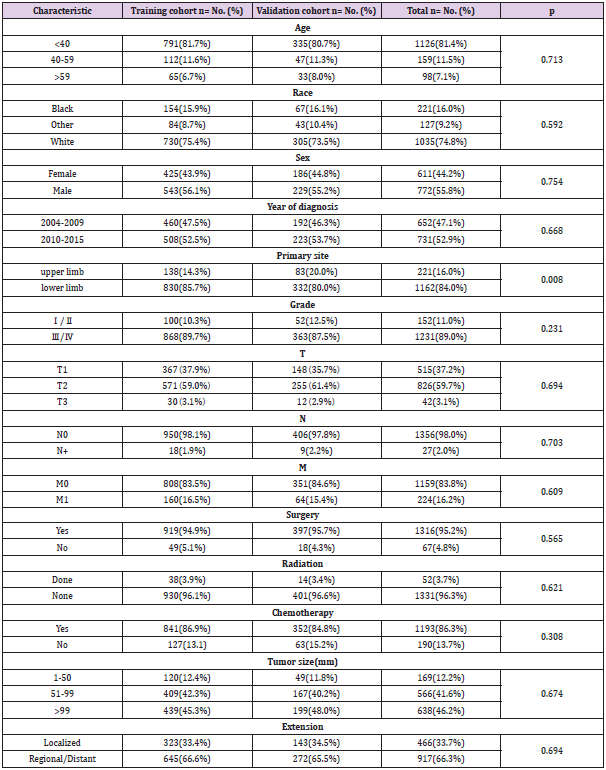
Table 1: Clinical and pathological features of the study population.
Prognostic Factors Affecting OS and CSS
The prognostic factors affecting the OS and CSS in the patient data were screened through univariate Cox analysis and multivariate Cox analysis. We observed that nine factors including age, grade, surgery, T stage, N stage, M stage, radiotherapy, tumor size, and EOD were significantly related to OS and CSS (p<0.05). There was no statistically significant correlation observed between gender, race, chemotherapy, primary site, and year of diagnosis. Furthermore, these nine factors were selected for multivariate Cox analysis to control different confounders. The results of multivariate Cox analysis showed that six factors including age, grade, surgery, tumor size, M stage and EOD were independent prognostic factors for OS (Table 2) and CSS (p<0.05)(Table 3). We also used these factors to create a survival curve between OS (Figure 2) and CSS (Figure 3).
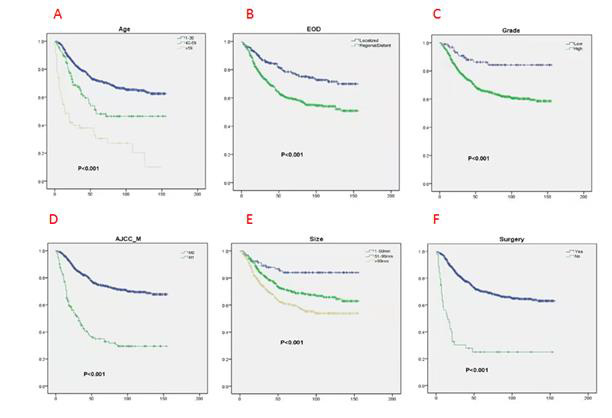
Figure 2: Kaplan-Meier (K-M) analysis for OS of patients with limb osteosarcoma about A. Age, B. EOD, C. Grade, D. AJCC_M, E. Size, F. Surgery.
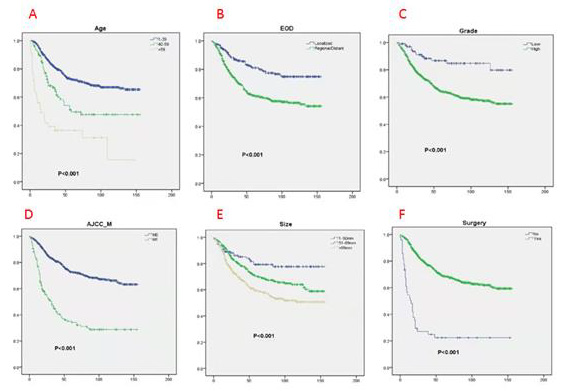
Figure 3: Kaplan-Meier (K-M) analysis for CSS of patients with limb osteosarcoma about A. Age, B. EOD, C. Grade, D. AJCC_M, E. Size, F. Surgery
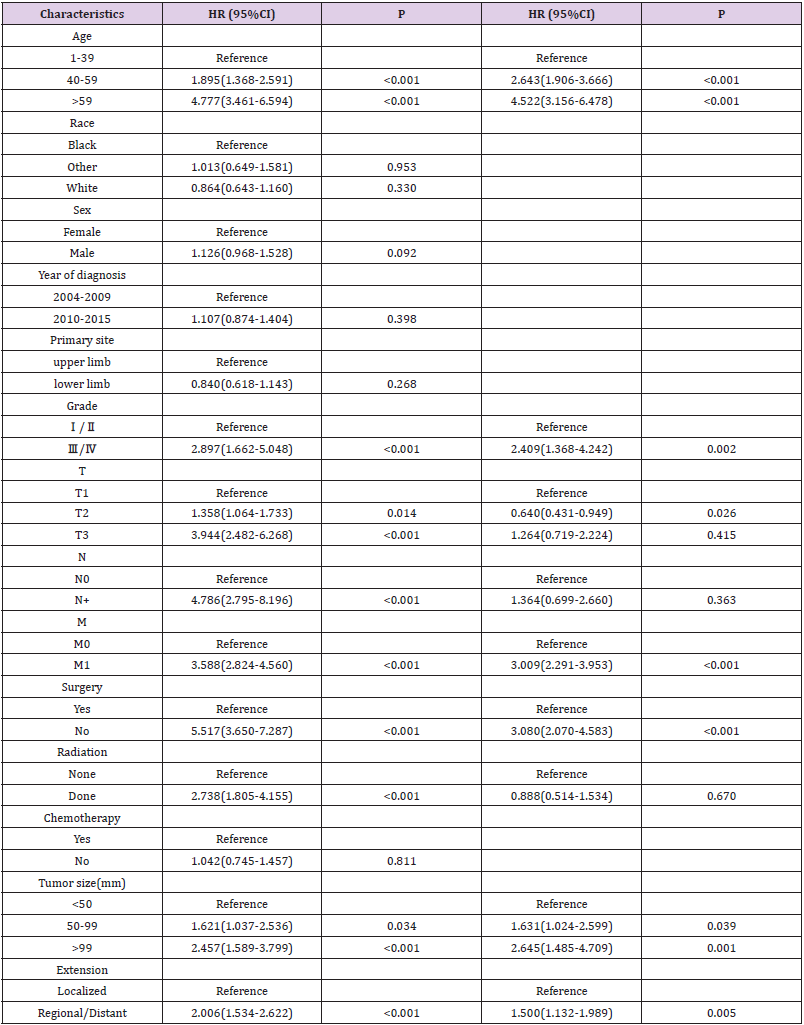
Table 2: Univariate and Multivariate Analyses of overall survival in the Training cohort.
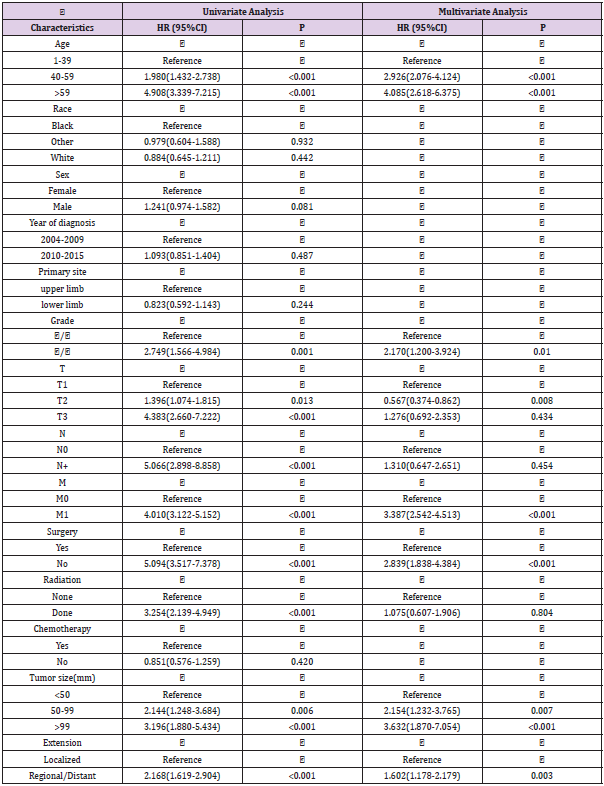
Table 3: Univariate and multivariate analyses of cancer-specific survival in the training cohort.
Construction and Validation Of OS And CSS Nomogram
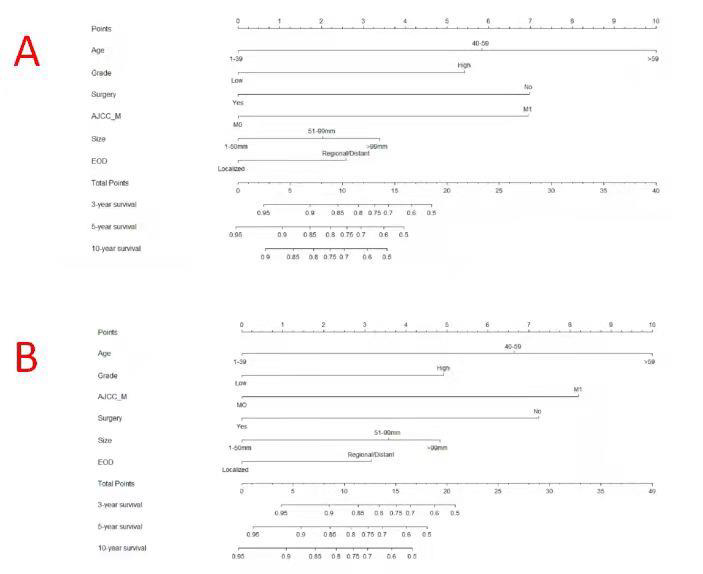
Based on the results of the Cox analysis, we included six important independent factors: age, grade, surgery, M stage, tumor size, and EOD into the prognostic nomogram in order to estimate 3-, 5-, and 10-year OS and CSS in patients with limb osteosarcoma (Figure 4). The nomogram gives score of every prognostic variable on the point scale (Table 4). The following steps are involved in development of the nomogram: 1. Based on individual limb osteosarcoma patient’s prognostic factors, scores related to each prognostic factor can be obtained, 2. Add all the points to get the “total point”, 3. Draw a vertical line from the “total point” column to the survival probability column to get the corresponding survival rate. (Figure 4). As an example, a patient diagnosed with primary limb osteosarcoma was aged 38 at the time of diagnosis with a high grade, tumor size of 80 mm M stage was M0. This patient was presented with regional disease and underwent surgery. According to our nomogram, the patient’s OS and CSS scores were 9.3 and 9.2 points, respectively.
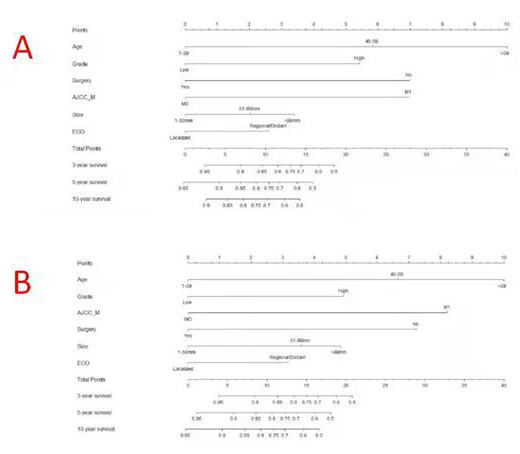
Figure 4: Nomograms to predict 3-,5- and 10-year overall survival (A) and cancer-specific survival (B) for osteosarcoma patients.
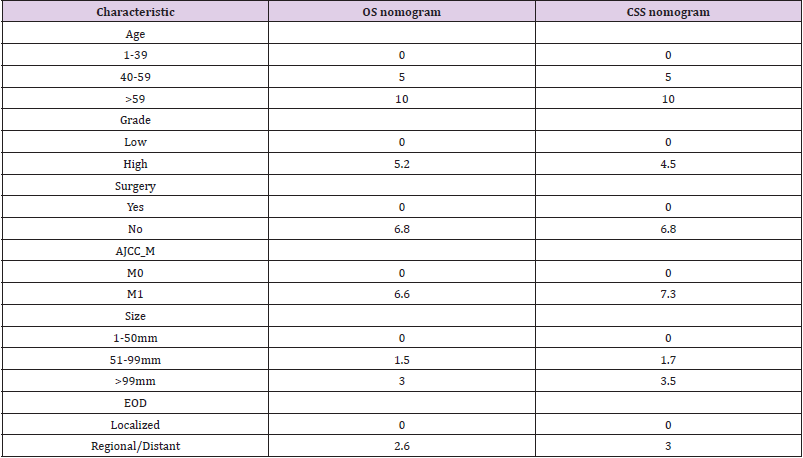
Table 4: Detailed points of each predictor in the nomograms.
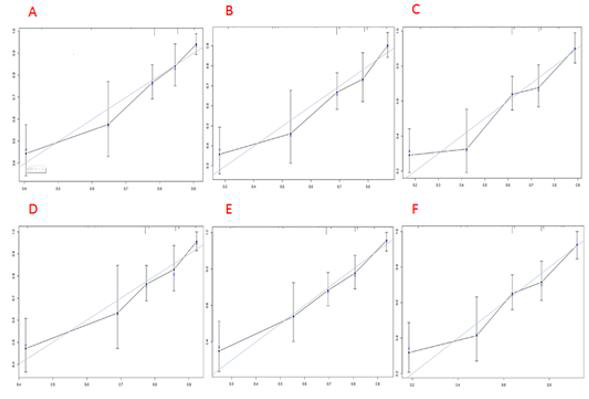
The 3-year OS and CSS scores of the patient were 0.86 and 0.89, respectively. The 5-year OS and CSS rates were 0.79 and 0.84, respectively. The 10-year OS and CSS rates were 0.74 and 0.81, respectively. The nomogram was verified both internally and externally. For OS, the C-indexes of the training group is 0.744(95%CI: 0.714-0.774) and the C-indexes of the validation group is 0.736(95%CI: 0.694-0.778). For CSS, the C-index of the training group and the validation group were 0.746(95%CI: 0.715-0.777) and 0.737(95%CI: 0.692-0.782), respectively. The internal and external calibration curves of 3-, 5-, and 10-year OS and CSS showed strong consistency of the predicted results of the nomogram with the actual results (Figures 5 & 6).
Note: The cohort was divided into five subgroups with the equal sample size. The dashed line represents an excellent match between actual survival outcome (Y-axis) and nomogram prediction (X-axis). Closer distances between dashed line and points indicated higher prediction accuracy
Figure 5: Internal calibration plots of 3-year
A. 5-year
B. and 10-year
C. overall survival nomogram calibration curves; 3-year
D. 5-year
E. and 10-year
F. cancer-specific survival nomogram calibration curves.
Note: The cohort was divided into five subgroups with the equal sample size. The dashed line represents an excellent match between actual survival outcome (Y-axis) and nomogram prediction (X-axis). Closer distances between dashed line and points indicated higher prediction accuracy.
Figure 6: External calibration plots of 3-year
A. 5-year
B. and 10-year
C. overall survival nomogram calibration curves; 3-year
D. 5-year
E. and 10-year
F. cancer-specific survival nomogram calibration curves.
Discussion
The survival of limb osteosarcoma patient is determined by many factors. Several researchers have conducted studies on the prognostic factors of osteosarcoma, including primary tumor size, chemotherapeutic efficacy, recurrence, and metastasis [6,7,11]. However, it is inappropriate to evaluate the prognosis of osteosarcoma patients using a single variable. A nomogram can intuitively and effectively evaluate prognosis based on a multivariate regression model [12]. It can provide a graphical calculation scale method for estimating the probability of overall patient survival [10]. Nomogram has been widely used in the survival prediction of individual patients in recent years [13-21], and can comprehensively incorporate independent prognostic factors and predict the survival rate of 3-, 5-, and 10- years. Osteosarcoma is the most common type of primary malignant bone tumor [19,20]. Osteosarcoma usually occurs in the limb extremities [21]. However, to our knowledge, so far researchers have not constructed any nomogram for the prognosis of extremity osteosarcomas. Several studies have established that the survival prognosis of patients with limb osteosarcoma is completely different from that of patients with primary osteosarcoma of the axial bone [5,6]. By using ample data in the SEER database, we constructed a comprehensive nomogram to predict the 3-, 5-, 10-year OS and CSS of patients with limb osteosarcoma.
We determined the independent prognostic factors of the OS and CSS of extremity osteosarcoma patients based on the screening data in the current study, through univariate and multivariate Cox analysis. These factors include M stage, grade, surgery, age, tumor size, and EOD. Previous studies have shown that age has great effect on the prognosis of osteosarcoma patients. [21-23]. One study has reported a bad prognosis in patients with osteosarcoma over the age of 40 years [24]. Our study also highlighted that that age is the most significant factor affecting the survival of patients with limb osteosarcoma. High-grade (poorly differentiated or undifferentiated) tumors are more likely to recur and metastasize than low-grade (well-differentiated or moderately differentiated) tumors [25]. Also, a larger tumor indicates a poor prognosis for osteosarcoma patients [26-28]. One study has reported that patients with larger tumor size are more likely to have metastases [29]. Surgery can also remarkably affect the prognosis of patients. One study showed a positive impact of surgery on prognosis and survival of patients with osteosarcoma [30]. These findings were validated in our study also showed that patients with low-grade tumors or smaller primary tumors or surgical treatment have a better prognosis. In the AJCC/TNM stage, M stands for distant metastasis. Our study showed a bad prognosis in limb osteosarcoma patients with distant metastasis. In terms of EOD, the metastatic disease has long been considered as an independent risk factor for higher mortality [7,31,32]. Our research indicates that the prognosis of patients with tumors in regional stage and distant metastasis stage is worse than that of patients with tumors in the local stage.
Limitations
There are some limitations to this study. First, patients diagnosed only after 2004 had information on AJCC/TNM stage in the database, so we excluded cases diagnosed before 2004 from the study. Second, there may be some important independent prognostic factors such as chemotherapy regimens, the status of tumor margins, and whether there is nerve/vascular invasion that might not have been identified by researchers or recorded in the SEER database [33-35]. These factors may be related with the prognosis of limb osteosarcoma patients, but were not included in this study. We only considered 3-, 5-, and 10-year survival as the study endpoint. However, maybe recurrence at a certain time point can be assessed as an outcome [36]
Conclusion
Taken together, based on the large database, we analyzed the factors affecting limb osteosarcoma. Also, we determined that tumor size, age, M stage, grade, surgery and EOD are the independent prognostic factors of OS and CSS in patients with limb osteosarcoma. We also developed and validated the nomogram to evaluate the OS and CSS of limb osteosarcoma patients at 3-, 5- and 10- years. Nomogram has high accuracy and applicability. Hopefully, our nomogram could be used as a convenient and effective tool. It can help doctors conduct personalized survival assessments and screen outpatients with high mortality rates, to provide a reference for subsequent treatment options and follow-up strategies.
For more Articles on: https://biomedres01.blogspot.com/