Tuesday, February 25, 2025

Multiple Sites Fat Removal Leads to Mild Lipid Metabolism Disorders and Insulin Resistance in C57BL/6J Mice


Multiple Sites Fat Removal Leads to Mild Lipid Metabolism Disorders and Insulin Resistance in C57BL/6J Mice

Introduction

Obesity has been affecting the global population. Between 1975 and 2018, the number of obese adults in 200 countries has increased from 105 million to 650 million [1]. Approximately 50% adults will suffer from obesity in the United States by 2030 [2]. Adipose tissue is the major energy storage site and a very important endocrine organ. Therefore, it plays a crucial role in regulating systemic metabolic homeostasis [3,4]. Increase of adipose tissue can lead to obesity, while decrease of adipose tissue can lead to lipodystrophy. Adipose dysfunction caused by obesity or lipodystrophy can lead to dyslipidemia, fatty liver, insulin resistance, cardiovascular diseases, etc. [5,6]. Lipodystrophy is mainly caused by congenital genetic defects or acquired diseases [7], while obesity is mostly related to over-nutrition, hormonal imbalance, and aging [8]. The incidence of lipodystrophy is relatively very low. However, the number of overweight and obese people has increased rapidly. For obesity, clinical treatment is mainly achieved by lifestyle changes, drugs or surgery [9-12]. Numerous studies supported that fat removal in obese subjects could improve obesity-related metabolic disorders [13-19]. Liposuction and body sculpting technology in obese people can achieve the dual goals of losing weight, preventing disease and reshaping the human body, however, many young people who are not obese are trying to achieve the goal of losing weight and body sculpting through partial liposuction or partial fat dissolving at present [20,21]. Fat removal from obese ones can improve metabolism disorders, while, whether removing adipose from healthy young adults can affect glucose and lipid metabolism or not has not yet been studied. In this study, different sits adipose tissue of C57BL/6J mice were surgically removed to investigate the effects of adipose tissue in healthy young mice fed on normal chow diet.

Materials and Methods

Animals

Thirty male C57BL/6J mice were purchased from Vital River Laboratories (Beijing, China) and housed in a 12h light/12h dark cycle at 24 ℃, with free access to water and standard laboratory chow diet. All the animal experiments followed the principles of laboratory animal care (NIH Publication No. 85Y23, revised in 1996), the experimental protocol was approved by the Animal Protection Committee of Hebei University of Traditional Chinese Medicine. When mice were 12 weeks old, they were randomly divided into five groups: sham-operated group (Sham), subcutaneous fat removal group (Sub-FR), epididymis fat removal group (Epi-FR), subcutaneous and epididymis fats removal group (WAT-FR), subcutaneous, epididymis fats and brown fat removal group (WAT+BAT-FR group), with 6 mice in each group. Fat removal surgery, according to the sits of fat removed, was performed as what we had reported [22,23]. Animals were fed on chow diet for 10 weeks after fat removal surgery and anesthetized with 1% pentobarbital sodium. Livers and resident fats were harvested for further analysis. Tissues used for subsequent Western Blot or realtime fluorescence quantitative PCR (qPCR) analysis were frozen in liquid nitrogen and stored at -80 ℃ until analyzed.

Blood Sample Analysis

Blood samples were gained by retro-orbital bleeding and centrifuged to obtain plasma. Enzymatic methods were performed to estimate the levels of plasma total cholesterol (TC), triglyceride (TG) and glucose (GLU) (Bio Sino, Beijing, China). After fasted for 4 hours, animals were challenged with p. glucose (2 g/kg body weight; Abbott) or insulin ((0.75 mIU/g body weight; Humulin) for glucose and insulin tolerance tests. Blood sample were collected before (time 0) and at 15, 30, 60 and 120 (for GTT) or 90 (for ITT) minutes after the intraperitoneal injection. The levels of plasma glucose were determined by using enzymatic methods.

RNA Isolation and Quantitative Real-Time PCR

biomedres-openaccess-journal-bjstr

Table 1: A list of primers for qPCR.

Trizol reagent (Invitrogen, USA) was used to extract the total RNA from the adipose tissues or livers. First-strand cDNA was generated by a RT kit (Invitrogen, USA) and then was performed quantitative real-time PCR by using primers listed in Table 1. Applied Biosystems and Quant Studio™ Design & Analysis Software were applied for amplifications in 35 cycles, with SYBR green fluorescence (TransGene Biotech, Beijing, China). Samples were quantitated by the comparative CT method, normalized to GAPDH.

Western Blot Analysis

Tissues were homogenized in RIPA. Protein content were measured by using a bicinchoninic acid protein assay kit (Pierce, Rockford, IL). Proteins were separated by SDS-polyacrylamide gel electrophoresis and transferred on nitrocellulose membranes (Applygen Technologies, Beijing, China), and then were identified with the required primary antibodies. Thereafter, secondary antibodies recognized the protein-antibody complex and the enhanced chemi-luminescence detection reagents (ThermoFisher Scientific, Shanghai, China) was applied for the development of the blots. Primary antibodies used in the study includes Akt, phospho- Akt (Ser473) (Cell signaling technology, Danvers, MA).

Liver Lipid Analysis

The livers were fixed, embedded and cryosectioned at 7 μm, as previously described [24]. Lipid disposition was visualized by Oil Red O staining and HE staining. For quantitation analysis of hepatic lipid disposition, approximately 100 mg of liver sample was weighed and homogenized in 1 mL PBS. Lipids were extracted by chloroform and dissolved in 0.5 mL 3% Triton X-100. The content of triglyceride and cholesterol were determined by enzymatic methods and normalized to liver weights.

Statistical Analysis

All of the data were shown as means ± SEM. And statistics was performed using the student’s t test or One-way ANOWA with GraphPad Prism 5.0. P value < 0.05 was considered statistically significant.

Results

Mild Insulin Resistance of Multi-Site Fat-Removed Group Mice

biomedres-openaccess-journal-bjstr

Figure 1: Blood glucose levels of five fat removal group mice.

A. Blood glucose levels of five groups mice fasting for 4 hours before fat removal;

B. Blood glucose levels of five groups mice fasting for 4 hours after fat removal for 1week;

C. GTT for 4 weeks of five groups mice after fat removal.

D. AUC data of Figure C;

E. Insulin tolerance test (ITT) for 8 weeks of five groups mice after fat removal;

F. AUC data of Figure E. Mean±SEM. n = 6. # P<0.05.

Adipose tissue often plays a crucial role in insulin sensitivity. Therefore, plasma glucose level was determined. No significant decrease in plasma glucose level was found after 4 h fasting between the fat-removed groups and the sham-operated group mice before and after fat removed (Figures 1A & 1B). At 4 weeks after fat surgery, glucose clearance was significantly delayed in the WAT+BAT-FR group compared with the sham-operated group (Figures 2C & 2D). Insulin tolerance, at 8 weeks after surgery, further showed that multi-site fat removal aggravated insulin resistance (Figures 2E & 2F). While no significant differences in glucose clearance and insulin tolerance were observed in the three other fat-removed groups and sham-operated group (Figures 2C- 2F). Our data suggested that multiple sites fat removal in healthy young mice could aggravate insulin resistance.

biomedres-openaccess-journal-bjstr

Figure 2: Blood lipid levels of five fat removal group mice.

• A, B: Plasma TG and TC levels of mice fasting for 4 hours before fat removal;

• C, D: Plasma TG and TC levels of mice fasting for 4 hours after fat removal.

• E, F: Plasma TG and TC levels of mice fasting for 14 hours after fat removal.

• G, H: Plasma TG and TC levels of the mice refed for 6 hours after fasting for 14 hours after fat removal. Mean±SEM. n = 6. # P<0.05.

Hypotriglyceridemia of Multi-Site Fat-Removed Group Mice After Overnight Fasting

Next, we determined plasma lipids level of the experimental mice. Though there was no significant difference in plasma TG level between the fat-removed groups and sham-operated group before and after fat removal, plasma TG level in WAT+BAT-FR group decreased significantly after overnight fasting (Figures 3A &3C) and increased after refeeding for 6h (Figure 3G), whereas no significant difference was found between the other three fatremoved groups and sham-operated group (Figures 3A,3C,3E,3G). However, there was no significant difference in plasma TC levels between the four fat-removed groups and sham-operated group (Figures 3B,3D,3F,3H). Our data indicated that multiple sites fat removal in healthy young mice could lead to hypotriglyceridemia after overnight fasting and increased after refeeding.

biomedres-openaccess-journal-bjstr

Figure 3: Characterization of residual fats of fat removal mice.

A. The weight of fat removed by surgery.

B. Body weight of five fat removal group mice.

C. Residual mesenteric fat weight in the five group mice.

D. Residual retroperitoneal fat weight in the five group mice.

E. mRNA levels of residual retroperitoneal fat related genes in the WAT+BAT-FR group and sham-operated group mice.

F. mRNA levels of residual mesenteric fat related genes in the WAT+BAT-FR group and sham-operated group mice.

Mean±SEM. n = 6. # P<0.05.

Compensatory Increased in Residual Retroperitoneal Fat of Multi-Site Fat-Removed Group Mice

The body weight of the four fat-removed group mice were not significantly different from the sham-operated group mice though the removed fat weight was difference (Figures 3A & 3B). The weight of retroperitoneal fat but not mesenteric fat was significantly increased in WAT+BAT-FR group after fat removed for 10 weeks (Figure 3D). No significant difference was found in retroperitoneal fat or mesenteric fat in the other fat-removed groups compared with sham-operated group (Figure 3B). Therefore, mRNA expression levels of genes related to lipolysis (Atgl, Hsl), lipid synthesis (Fasn, Acc, Scd1, Dgat2), adipogenesis (Pparg, Pgc1a), fatty acid oxidation (Cpt1a, Acox1) and lipid transport (Cd36, Mttp) of the adipose tissues in sham-operated group and WAT+BAT-FR group were detected by qPCR. We found that lipid synthesis, transport and related gene expression were up-regulated in adipose-deprived mice (Figures 3E & 3F). The expression of Pcg1a in retroperitoneal fat in the WAT+BAT-FR group was increased, suggesting that cell proliferation might be increased (Figure 3E). These results suggest that the residual retroperitoneal fat was compensatory increased in multi-site fat-removed group mice.

Mild Liver Lipid Deposition of Multi-Site Fat-Removed Group Mice

biomedres-openaccess-journal-bjstr

Figure 4: Lipid deposition in livers of fat removal mice.

A. Liver weight of the five groups mice;

B. Liver triglyceride content of the five groups mice;

C. Liver cholesterol content of the five groups mice;

D. HE staining and Oil red O staining of liver tissue of Sham group and WAT+BAT-FR mice, Bar= 200μm;

E. Expression of genes related to triglyceride (TG) synthesis and metabolism in the liver of Sham group and WAT+BAT-FR mice;

F. Expression of genes related to cholesterol (TC) synthesis and metabolism in liver of Sham group and WAT+BAT-FR mice;

G. p-Akt and AKT expression in liver tissues of Sham group and WAT+BAT-FR mice detected by Western-blot.

H. Gray value quantification of Figure 4G; Mean±SEM. n = 6. # P<0.05.

Adipose tissue is a storage site for triglycerides and cholesterol. Loss of adipose tissue, often accompanied by ectopic deposition of lipids in the live. In our fat removal model, liver weight was significantly increased in the WAT+BAT-FR group compared with sham-operated group (Figure 4A) Consistently, liver cholesterol and triglyceride content were significantly increased compared with the control group (Figures 4B & 4C). However, no ignificant differences were observed between the other fat-removed group and shamoperated group in liver weight or liver cholesterol and triglyceride content compared with sham-operated group. Therefore, the effect of adipose tissue loss on liver lipid deposition was further analyzed by pathological staining or mRNA expression detection in WAT+BAT-FR group and sham-operated group. Both HE and oil red O staining of the liver showed that the WAT+BAT-FR group did not exhibit severe liver lipid deposition compared with sham-operated group (Figure 4D). In order to clarify the cause of the increase of liver cholesterol and triglyceride contents in the WAT+BAT-FR group, we detected the mRNA expression levels of triglyceride and cholesterol-metabolisation-related genes in liver, and found that the expression of genes related to triglyceride synthesis (Acc) and lipid transport (Cd36) in the WAT+BAT-FR group was significantly up-regulated compared with sham-operated group (Figure 4E). The expression of HMG-CoA, a key enzyme in cholesterol synthesis, was also significantly up-regulated in the WAT+BAT-FR group compared with sham-operated group (Figure 4F). Liver is an insulin-sensitive target organ, and Akt is a key downstream target protein of insulin signal passway. Therefore, we examined Akt phosphorylation levels to determine the effect of mild lipid deposition on insulin sensitivity in liver tissues. Western-blot results showed that the level of p-Akt in the liver of the WAT+BAT-FR group was not significantly different from that of the sham-operated group (Figures 4G & 4H).

Discussion

In this study, subcutaneous fat in the groin, epididymis fat in the viscera and brown fat in shoulder blade of C57BL/6J mice were selectively removed to observe the role of adipose tissue in healthy young mice. Our results suggest that only subcutaneous fat removal, or epididymis fat removal or subcutaneous fat and epididymis fat removal did not show significant impacts on insulin sensitivity, plasma lipid levels, weight of residual fat or liver lipids content. Whereas, multi-site fat removal in subcutaneous fat, epididymis fat and brown fat resulted in mild insulin resistance, hypotriglyceridemia after overnight fasting, expansion of residual retroperitoneal fat and increased liver lipids content without obvious lipid deposition. Our study proved that multiple sites fat removal in healthy mice can lead to increased liver weight and lipids content, and qPCR further proved that multiple sites loss of adipose tissue can promote fatty acid uptake and cholesterol synthesis in livers (Figure 4).

The main function of adipose tissue is to store triglycerides. In our fat-removed model, mice with both white and brown fat removal exhibited hypotriglyceridemia after overnight fasting, a similar phenotype of lipodystrophy [20]. However, moderate amount of fat removal did not affect metabolic homeostasis significantly. White fat plays an important role in regulating metabolism. Therefore, there are many studies on the roles of adipose tissue in insulin sensitivity. In obese mice induced by high fat diet, removal of visceral fat can increase insulin sensitivity and reduce fatty liver [11] while removing subcutaneous fat can reduce insulin sensitivity and aggravate fatty liver [21]. The increase of pathological subcutaneous fat can also result in similar pro-inflammatory effects with visceral adipose tissue. Some obese patients achieve the purpose of losing weight and alleviateing metabolic disorders by fat removal surgery [25], but now many subjects with standard weight try to reduce weight using fat removal method, so as to achieve the goal of slimming and shaping.

However, the role of adipose tissue loss in healthy subjects is unclear. In this study, mice with multiple sites fat removal showed mild insulin resistance, decreased plasma triglyceride levels and increased liver lipid levels, suggesting that the large loss of adipose tissue in healthy mice can lead to mild metabolic disorders. One or two sites fat removal did not show significant impact on metabolic homeostasis. However, whether it affects other functions are not defined in this study and need further exploration. In summary, surgical removal of subcutaneous, epididymis and brown fat in C57BL/6J mice showed mild insulin resistance, hypotriglyceridemia after overnight fasting and liver lipids content. Besides, ubcutaneous fat, or epididymis fat or subcutaneous fat and epididymis fat removal did not play a significant impact on metabolic homeostasis.


For more Articles on: https://biomedres01.blogspot.com/

Monday, February 24, 2025

Ergonomic Problems Among Physiotherapists - Scientific Review of the Literature


Ergonomic Problems Among Physiotherapists - Scientific Review of the Literature

Introduction

Ergonomics is a scientific discipline that deals with improving working conditions and products, reducing the risk of injuries, reducing the risk of work-related diseases and promoting healthy attitudes towards the environment and the work environment. Musculoskeletal disorders related to work are responsible for morbidity in many working populations and are known to be an important work problem that leads to increased health costs, reduced productivity, and lower quality of life [1]. There are more and more lost working days due to back pain, which also affects health care itself [2]. Nonspecific lower back pain is an uncomfortable medical condition that can make work impossible and is a common reason for absenteeism. According to the World Health Organization (WHO), human health hazard assessment is “a procedure that assesses the nature and likelihood of adverse effects on human health due to exposure to one or more factors of physical or mental stress” (WHO 1981). Health hazards are classified as biological, chemical, organizational, or psychosocial that include work-related violence. Health and social work activities have a higher rate of work-related disorders than other activities. These are mainly musculoskeletal disorders, stress, depression and anxiety. Nurses, nurses and other staff are among the 10 occupations with the highest risk of muscle and joint sprains. The assessment of health hazards related to physical activities is the subject of a number of guidelines [3]. It is very important to educate healthcare professionals about all the dangers of their job in time, as well as to enable work with devices that help prevent the occurrence of diseases. Unfortunately, nurses and physiotherapists today do most of the work manually. Every healthcare professional needs to be warned about the risks they are exposed to every day [4]. The main problems of traditional ergonomics were how to reduce muscle work and movements, and today the problems are related to static and repetitive work.

Objectives of the Work

The purpose of the article is to present a paper about to compared research which has dealt with musculoskeletal disorders in physiotherapists and other health professionals at work and to record ergonomic problems.

Materials and Methods of Work

In March and April 2019 were searched various biomedical databases such as PubMed, ResearchGate and Academia.edu using the keywords “Work Related Musculoskeletal Disorders”, “Musculoskeletal Injuries”, “Work Injuries”, “Physiotherapists”, “Occupational health”, on the basis of which the presentation of the data obtained in the found research was done. The research is limited to articles published in English. The research of ergonomic problems among physiotherapists is a non-experimental qualitative research, ie a scientific review of the literature.

Results and Discussion

We have selected four studies that we have included in this scientific review of the literature based on the purpose and objectives of the paper. The studies are from India, Greece and Iran. The studies are presented in Table 1.

biomedres-openaccess-journal-bjstr

Table 1.

Conclusion

1) The main ergonomic risks for physiotherapists are: bending the torso forward, flexion of the neck and prolonged standing;
2) Education, awareness-raising and training programs on prevention and strategies for dealing with musculoskeletal disorders related to work oblige health professionals, especially high-risk groups such as nurses, dentists and physiotherapists, to reduce the occurrence of these disorders;
Work-related musculoskeletal disorders can be prevented with three affordable things, i.e. designing an ergonomic work environment, postural education, and regular exercise.


For more Articles on: https://biomedres01.blogspot.com/

Friday, February 21, 2025

Idiopathic Intracranial Hypertension in Children Less than 5 Years Old - A Case Series


Idiopathic Intracranial Hypertension in Children Less than 5 Years Old - A Case Series

Introduction

Idiopathic Intracranial Hypertension (IIH), previously termed pseudotumor cerebri or benign intracranial hypertension, is characterized by an increase in intracranial pressure of no identified cause. It occurs predominantly in adults, particularly young overweight women of childbearing age. The overall annual incidence is 2.4 per 100,000 [1]. IIH is essentially a diagnosis of exclusion, suspected by clinical signs and normal findings on imaging studies, in accordance with the revised modified Dandy criteria, with additional tests to rule out secondary causes of raised intracranial pressure (brain parenchymal lesion, vascular malformations, hydrocephalus, central nervous system infections etc). IIH is rare in children and adolescents, with an estimated reported incidence of 0.5 per 100,000 [2]. Studies in this age group have found that the most common presenting symptom of IIH is headache, documented in up to 91% of cases [3]. Nausea and vomiting may occur as well, and less often, blurred, or double vision, transient visual obscurations, tinnitus, and neck stiffness [4]. In younger patients, IIH may present only with irritability [5]. The diagnostic process follows that in adults. In children, a cerebrospinal fluid (CSF) opening pressure of ≥25 cmH2O is diagnostic of IIH; in obese or sedated children, the cutoff is ≥28 cmH2O [6].

The specific incidence and clinical picture of IIH in very young children has rarely been reported. In Schneider Children’s Medical Center of Israel, children admitted with papilledema undergo an ophthalmic examination by a neuro-ophthalmologist and imaging, usually Magnetic Resonance Imaging (MRI) or, if unfeasible, Computed Tomography (CT). If findings on physical examination and imaging are normal and IIH is suspected, the children are referred for Lumbar Puncture (LP) under sedation. To exclude secondary causes of increased intracranial pressure the following blood parameters are tested: complete blood count, chemistry and electrolyte levels, C-reactive protein level, blood gases, thyroid stimulating hormone level, International Normalized Ratio (INR), Antinuclear Antibody Test (ANA), and vitamin A and D levels. The aim of this report was to describe the clinical course and outcome of 5 children from 10 month to 3 years and 9 month who were diagnosed with IIH.

Methods

This study was approved by the Institutional Review Board of Schneider Children’s Medical Center of Israel. The hospital’s healthcare database was reviewed for all children aged 3 years or less who were diagnosed with IIH from 2013 to 2020, and their clinical and laboratory data were extracted.

Results

Five young children diagnosed with IIH were identified. Their clinical characteristics are summarized in Table 1 and their clinical course is described below.

biomedres-openaccess-journal-bjstr

Table 1: Characteristics of 5 young children diagnosed with idiopathic intracranial hypertension.

Case 1

A boy aged 2 years and 3 months presented to the emergency department with his parents who explained that they had recently caught the child grabbing his head during activities or while running and they suspected he might be having headaches. His body temperature was normal, and he was not waking up or vomiting during the night. They denied any use of medications including vitamins. The child’s medical history was remarkable for the diagnosis of autistic spectrum disorder. Physical examination including neurological examination was normal, albeit finding bilateral papilledema on ophthalmic examination prompted evaluation with MRI+Magnetic Resonance Venography (MRV) which demonstrated tortuosity of the optic nerve. Based on a working premise of IIH, LP was performed. Opening pressure was 39 cmH2O with no cells. A regimen of Acetazolamide 21 mg/kg/day was started. When the child’s symptoms failed to resolve and the parents complained of new onset of arousals in the early morning hours, the dose was increased to 31 mg/kg/day. Treatment was continued for one year under ophthalmologic and neurologic follow-up until resolution of symptoms. The child is currently 4 years and 3 months old and has no complaints of headache or visual problems.

Case 2

A boy aged 1 year and one month presented to the emergency department with minor head trauma near the orbit. Physical and neurologic examinations were unremarkable, but ophthalmic examination revealed asymptomatic bilateral papilledema which prompted a referral to complete head CT, with normal findings. LP was performed, with an opening pressure of 38 cmH2O. A diagnosis of IIH was made, and treatment with Acetazolamide 25 mg/kg/day was started. To complete the evaluation, MRI+MRV was performed along with blood tests to rule out secondary causes of increased intracranial pressure, in accordance with the hospital protocol. The only remarkable finding was normocytic anemia, with hemoglobin 9.5 g/dl, normal ferritin level, and low iron levels, which was treated with oral iron supplementation. The papilledema failed to improve, and two more LPs were performed. Acetazolamide treatment was continued for 2 years. Other than a language delay, development was normal. The child is currently 4 years old and is undergoing genetic evaluation for suspected skeletal dysplasia. On continued biannual ophthalmologic follow-up, the optic disc is normal, and the patient denies any headaches or visual deficits.

Case 3

A 10-month-old otherwise healthy boy with normal development was admitted to the pediatric ward for evaluation of an increase in head circumference to 95% from 50% at birth. The child was born at 34 weeks’ gestation after a normal pregnancy and delivery. Immediately after delivery, he was admitted to the neonatal intensive care unit because of hypocalcemia and hypomagnesemia which were corrected orally. Developmental milestones were achieved with no delay. There were no prior hospitalizations. His parents denied any medications except for iron and vitamin D according to the recommendations of the Israeli Pediatric Health Association. Findings on physical and neurologic examinations where within normal limits, except for head circumference at the 95th percentile with frontal bossing. There were no hemodynamic signs of increased intracranial pressure. Fundoscopic examination revealed bilateral papilledema. MRI of the whole neuroaxis showed no abnormalities except for an incidental finding of a small pineal cyst. LP was performed, with opening pressure 24 cmH2O. Despite the borderline pressure, because of the finding of papilledema, treatment with Acetazolamide 15 mg/kg/day was started. Blood tests performed according to our protocol to identify secondary causes of increased intracranial pressure were negative. When the papilledema failed to improve, two more LPs were performed, with opening pressures of 27 and 31 cmH20, and the Acetazolamide regimen was increased to 20 mg/kg/day. Nevertheless, the papilledema still did not improve. At age 2.8 years, following multidisciplinary consultation, the patient was referred for insertion of a Ventriculo-Peritoneal (VP) shunt. The procedure was uneventful. Postoperative follow-up revealed normalization of the optic nerve width on ultrasound and normal visual acuity. The child is currently 6 years and 7 months old and has no headaches or visual complaints.

Case 4

A 10-month-old otherwise healthy boy with normal development presented to the emergency department for evaluation of a minor head trauma sustained when he fell backwards. His parents reported that he began vomiting but did not lose consciousness. Findings were normal or negative on neurologic examination, abdominal ultrasound to rule out intussusception, and fundoscopic examination. The patient was treated with fluids and antiemetics for 2 days and discharged home. The next day, the patient again presented to the emergency department because of 4-5 episodes of vomiting and new-onset strabismus. Neurologic examination revealed bilateral abducens palsy, and fundoscopic examination demonstrated bilateral papilledema. Head CT with contrast was normal, MRI+MRV+MRA (magnetic resonance angiography) showed mild changes characteristic of IIH (Table 1). On the working premise of IIH, LP was performed, with opening pressure 43 cmH2O. Detailed laboratory investigation for secondary causes of increased intracranial pressure according to our protocol was negative. Treatment with Acetazolamide was started. When the ophthalmic findings failed to improve, the dose was increased to 41 mg/kg/day concurrent with repeated LPs until opening pressure decreased to 23 cmH2O. Three months after discharge, the child returned to the emergency department after falling from a toy car while his brother fell on his head.

His parents reported that he vomited 8 times. On presentation, the neurologic examination revealed no abnormalities other than an increase in head circumference from the 50th percentile 2 months previously to the 97th percentile. Head CT without contrast demonstrated bilateral subdural collections which had not been found on the MRI scan performed 3 months previously. Ophthalmic examination demonstrated papilledema with no deterioration from the last follow-up but with new bilateral retinal bleeding. These findings prompted a skeletal survey to rule out non-accidental injury, a metabolic survey to rule out metabolic disturbances that may present with a similar picture (e.g., glutaric aciduria), and hematologic evaluation to rule out bleeding disorders. No abnormalities were found. After consultation with neurosurgeons, the child (now 1 year and 1 month old) was referred to bilateral subduro-peritoneal shunt insertion. This led to improvement in the ophthalmologic parameters and stepwise resolution of the subdural collections. At age 2 years, MRI showed complete resolution of the subdural collections, and the shunts where removed. The child is currently 3 years and 7 months old, healthy, with normal development.

Case 5

An otherwise healthy boy aged 3 years and 9 months presented to the emergency department complaining of headache. According to his parents, the headache had started 2 weeks before and was located frontally bilaterally, without nausea or vomiting, visual disturbance, or night arousal. The headaches had initially resolved without treatment, but lately, paracetamol was needed to reduce the pain. Neurologic examination was unremarkable, except for fundoscopic examination that revealed bilateral papilledema. MRI+MRV+MRA yielded findings characteristic of IIH (Table 1). Opening pressure on LP was 34 cmH2O. Detailed laboratory investigation for secondary causes of increased intracranial pressure according to our protocol was negative. Acetazolamide 20 mg/kg/day was started, leading to resolution of the headaches and improvement in the papilledema. Two month later, on ophthalmologic follow-up, Optical Coherence Tomography (OCT) demonstrated worsening of the papilledema. A second LP was performed, with opening pressure 42 cmH2O, and the Acetazolamide dose was gradually increased gradually to 38 mg/kg/day. When the papilledema failed to resolve, the multidisciplinary team recommended insertion of a continuous drainage tube for 5 days. Opening pressure was 32 cmH2O.

OCT initially showed improvement, but 5 days after the intervention, worsening of the papilledema was noted on OCT and ultrasound of the optic nerve, and the Acetazolamide regimen was gradually increased to 95 mg/kg/day, with no side effects, except for a lactic acidosis with PH- 7.27 and HCO3-18, that was treated with sodium bicarbonate. Ophthalmologic follow-up with OCT demonstrated injury to the optic nerve. A team of pediatric neurologists, neurosurgeons and an ophthalmologist decided to hold off on a VP shunt and referred the child for a second continuous drainage for a longer period. Opening pressure was 29 cmH2O, with an improvement in signs. However, after 6 days, the drain was removed due to the appearance of Staphylococcus haemolyticus meningitis which was treated with vancomycin. At the end of the child’s hospitalization, partial improvement was noted on OCT, and on follow-up 2 months later, at age 4 years and 1 month, fundoscopic examination showed marked improvement.

Discussion

The present report describes the clinical course of 5 young children (aged 10 months-3 years and 9 month) diagnosed with IIH. IIH is a rare neurologic disorder in children. Studies of affected adults and adolescents reported a background of obesity or intake of medications. However, the literature does not show any risk factors in children. The children in our series underwent comprehensive workup to rule out possible secondary causes of IIH, and all findings were normal or negative. The most common presenting symptom of IIH in children is headache [3], followed by nausea, vomiting, and visual disturbances [4]. In a summary of 26 cases of infantile IIH, Boles, et al. [7] found that the most prevalent symptoms were bulging fontanelle, irritability, vomiting, and cranial nerve palsies. In our series, the two older children (aged more than 2 to nearly 4 years) presented with headache; in the others, IIH was an incidental finding on evaluation of increasing head circumference in one child and minor head trauma in 2 children. It is noteworthy that only one of the children, with abducens palsy after minor head trauma, had abnormal neurologic signs at presentation. Brain imaging in cases of IIH should be normal, with an absence of signs of secondary causes of increased intracranial pressure. Owing to ongoing advances in neuroimaging techniques, however, subtle findings suggestive of IIH have emerged, such as empty sella, flattening of the posterior globes, optic nerve head protrusion, distension of the optic nerve sheaths, tortuosity of the optic nerve, cerebellar tonsillar herniation, meningoceles, CSF leaks, and transverse venous sinus stenosis [8].

In our study, 3 of the 5 children had an MRI finding suggestive of IIH. IIH is a neurologic emergency, as it can result in irreversible deficits in visual acuity and cranial nerve palsies due to mechanical compression of the optic nerve [9]. Therefore, prompt treatment is needed. There are no current studies of treatment or treatment guidelines in the pediatric population. Adult data suggest that Acetazolamide is an acceptable first-line medication at dosages of 15- 20 mg/kg/day. A single-center study showed that less than 10% of children either fail to respond to pharmacological treatment or cannot tolerate it and therefore require surgical intervention, such as serial LP, optic nerve sheath fenestration, and insertion of a VP shunt [10]. In another study, Hacifazlioglu Eldes, et al. [11] found that among 12 cases of intracranial hypertension in children, 6 were idiopathic and 6 were attributable to secondary causes. Two children in the latter subgroup, with sinus vein thrombosis, required a VP shunt, and 4 were treated with medications and LPs [11]. At present, there is insufficient available evidence to recommend or reject any of the surgical treatment modalities for IIH [12]. In contrast to these previous reports [10,11], children in our study needed increasing doses of Acetazolamide (20- 95 mg/kg/day). Four children (80%) did not respond well to medical therapy and required invasive intervention with continuous drainage, LP (all children; more than one in 4), or VP shunt (2 children).

These findings suggest that the IIH may follow a complicated course in very young children. Data on the outcomes of VP shunts in patients with IIH are variable. Some authors reported stabilization or remission of visual problems in 95-100% of cases whereas others found that vision continued to worsen in approximately 10% of cases [10,13,14]. In our study, visual acuity was preserved in all children. Extraventricular Obstructive Hydrocephalus (EVOH), defined as an imbalance between excessive production and lesser absorption of CSF, is a fairly common neuroimaging finding in young children [15]. Therefore, it is possible that the severe clinical course of IIH in the toddler age group is a consequence of superimposed pressures on a baseline state of excessive pressure within the skull. Some of the patients in our small cohort were asymptomatic, and papilledema was found incidentally on eye examination. Lee, et al. [16] retrospectively reviewed the medical charts of 1110 adult patients with optic atrophy and found that in 6.5%, isolated unexplained optic atrophy was noted on neuroimaging. Untreated IIH may result in optic atrophy, and pediatric IIH that remains undiagnosed might lead to unexplained optic atrophy in adulthood. Therefore, this study provides a practical guideline to clinicians to perform a routine neurological examination in young children.

Conclusion

The present retrospective case series adds to the limited available data on IIH in children under 5 years of age. The course of the disease was not as benign as the former name of this disorder suggests. The clinical presentation in children can be variable and less obvious than in adults. The diagnosis of papilledema can be challenging. In the absence of randomized controlled studies, evidence-based recommendations for the management of IIH in children cannot be made. Further prospective studies are needed to clarify and consolidate management approaches in this patient population.


For more Articles on: https://biomedres01.blogspot.com/

Evaluation of Antidiabetic Activity of Aqueous Extract of Bark of Pterocarpus Marsupium Silver Nanoparticles Against Streptozotocin and Nicotinamide Induced Type 2 Diabetes in Rats


Evaluation of Antidiabetic Activity of Aqueous Extract of Bark of Pterocarpus Marsupium Silver Nanoparticles Against Streptozotocin and Nicotinamide Induced Type 2 Diabetes in Rats

Introduction

Nanomaterials can be well-defined as a material with sizes ranged between 1 and 1000 nm, which influences the frontiers of nanomedicine starting from biosensors, microfluidics, drug delivery, and microarray tests to tissue engineering. Nanomedicines have become well appreciated in recent times due to the fact that nanostructures could be utilized as delivery agents by encapsulating drugs or attaching therapeutic drugs and deliver them to target tissues more precisely with a controlled release. Being nanosized, these structures penetrate in the tissue system, facilitate easy uptake of the drug by cells, permit an efficient drug delivery, and ensure action at the targeted location. The uptake of nanostructures by cells is much higher than that of large particles with size ranging between 1 and 10 μm. Hence, they directly interact to treat the diseased cells with improved efficiency and reduced or negligible side effects. Among the wide range of metal nanoparticles, silver nanoparticles (Ag-NPs or nano silver) were the most popular, due to their unique physical, chemical, and biological properties when compared to their macro scaled counterparts. In order to fulfill the requirement of AgNPs, various methods have been adopted for synthesis.

Generally, conventional physical and chemical methods seem to be very expensive and hazardous. Interestingly, biologically prepared AgNPs show high yield, solubility, and high stability. Several studies reported the synthesis of AgNPs using green, cost effective and biocompatible methods without the use of toxic chemicals in biological methods. The biological synthesis of nanoparticles depends on three factors such as the solvent, the reducing agent, the non-toxic material. Diabetes mellitus refers to the group of diseases that lead to high blood glucose levels due to defects in either insulin secretion or insulin action. Diabetes develops due to a diminished production of insulin (type 1) or resistance to its effects (in type 2) both of which leads to hyperglycemia. When the renal threshold for glucose reabsorption exceeds, glucose spill over into urine(glucosuria) and causes an osmotic diuresis (polyuria), which in turn results in dehydration, thirst and increased drinking (polydipsia). All forms of diabetes are treatable since insulin became medically available in 1921, but there is no cure. The injections by a syringe, insulin pump or insulin pen which is the basic treatment of type 1 diabetes. Type 2 is managed with combination of dietary treatment, exercise, medications and insulin. About 463 million people worldwide have diabetes, it is predicted that by 2045 it may afflict up to 700 million people. In India, currently 77 million individuals have diabetes, and it was expected to double in 2045.

Pterocarpus marsupium is a medicinal plant widely distributed in India. Pterocarpus marsupium is also known as Indian kino, Bijasal, Vijaysar, belongs to the family Fabaceae. Pterocarpus marsupium has been traditionally used in the treatment of leukoderma, elephantiasis, diarrhea, cough, discoloration of hair and rectalgia. It is nontoxic and useful in jaundice, fever, wounds, diabetes. The various parts used are bark, heartwood, bark, stem, leaves etc. Bark and wood have been used to treat diabetics and Pterostilbene significantly lower the blood glucose levels useful in NIDDM. In this study we synthesized silver nanoparticles using bark and wood extract of Pterocarpus marsupium and its characterization is done along with its in vitro and in vivo anti-diabetic study.

Materials and Methods

Reagents & Instruments Used for In Vitro Studies

Chemical Reagents: Silver nitrate, sodium potassium tartrate, α amylase enzyme, starch, 3,5- Dinitro salicylic acid, Sodium hydroxide, Sodium chloride, Sodium phosphate monobasic.

Equipment’s Used: Magnetic Stirrer, UV Spectrophotometer, FT-IR Spectrometer, pH meter, Zeta Sizer, SEM, Dialysis membrane 50.

Reagents & Instruments Used for In Vivo Studies

Chemicals Used: Ethyl acetate, Glucose, streptozotocin, nicotinamide, glibenclamide, potassium carbonate, ethanol, bovine serum albumin, sodium carbonate, sodium bicarbonate, potassium dihydrogen phosphate, sodium hydroxide, thiobarbituric acid, trichloro acetic acid, potassium dichromate, NADPH, glutathione, tris-HCl buffer, sodium azide, ellman’s reagent, hydrogen peroxide and glacial acetic acid were procured from sigma Aldrich.

Instruments Used: Centrifuge (Remi instruments Ltd., Kolkata), digital balance (Sartorius Ltd., USA), Shimadzu-Jasco V-630 UV/Vis’s spectrophotometer, ELECO 1/27 pH meter.

Procedure

Sample Collection

Pterocarpus marsupium bark were collected from Thalasseri, Kerala.

Authentication

The plant specimen was identified and authenticated by Botanical survey of India, Southern regional center, Coimbatore.

Drying and Pulverizing

The bark and wood were collected, and shade dried. It was grounded into fine coarse powder with electronic blender and passed and kept in a well closed container in a dry place.

Preparation of Aqueous Extract of Pterocarpus Marsupium Roxb

Fifty grams of the bark powder was stirred with 500 mL of deionized water and kept at 65 °C for 30mins. Then the extracts were filtered by using Whatman No. 1 filter paper after cooling to room temperature. The extract was stored at 4 °C for future use (Chen Yu, et al. [1]).

Phytochemical Screening

Preparation of Test Solution: The filtered aqueous extract of bark of Pterocarpus marsupium Roxb was used as a test solution for preliminary screening of phytochemical constituent.

Preliminary Qualitative Phytochemical Analysis

Phytochemical screening Chemical tests were carried out using the extract of Pterocarpus marsupium for the presence of phytochemical constituents.

 Tests for tannins and phenolics

To the solution of the extract, a few drops of 0.1% ferric chloride was added and observed for brownish green or a blueblack coloration.

 Tests for saponins

About 10ml of the extract was mixed with 5ml of distilled water and shaken vigorously for a stable persistent froth. The frothing was mixed with 3 drops of olive oil and shaken vigorously and then observed for the formation of emulsion.

 Tests for terpenoids

About 5ml of the extract was treated with 2ml of chloroform and about 3ml concentrated H2SO4 was carefully added to form a layer. A reddish-brown coloration of the interface indicates the presence of terpenoids.

 Tests for alkaloids

• A small portion of the extract was stirred with few drops of dil. HCl and filtered.

• To the filtrate, dragendroff’s reagent (potassium bismuth iodide solution) was added and an orange, brown precipitate indicates the presence of alkaloids.

• To the filtrate, Mayer’s reagent was added, and a cream precipitate indicates the presence of alkaloids.

 Test for Starch

To the aqueous extract add weak aqueous Iodine solution.

 Test for Proteins

Warming Test: Heat the test solution in a boiling water bath.

 Test for Steroids

Salkowski Test: Treat the extract with few drops of concentrated sulphuric acid.

Preformulation Study

Solubility Test: About 1 mg of Pterocarpus marsupium Roxb. bark extract powder was taken in a test tube and solubility in ethanol, water, chloroform and diethyl ether, dimethyl sulphoxide were checked.

UV- VIS Spectral Analysis of Pterocarpus Marsupium Roxb Bark:

Preparation of Calibration Curve of Pterocarpus Marsupium Roxb Bark: Extract Twenty-five milligrams of crude extract were dissolved in phosphate buffer with a pH 7.4 and further diluted to 50mL of solvent, in volumetric flask to get a concentration of 500 μg /mL. This was treated as stock solution. Various aliquots of stock solution were diluted further to get different concentrations. The resultant solutions were scanned for λ max in the range of 200- 400nm using UV-spectrometer (Xi-Feng Zhang, et al. [2]).

FTIR Spectroscopy of Pterocarpus Marsupium Roxb Bark: 50 mg each of dried Pterocarpus marsupium Roxb bark and wood were mixed with 100 mg of spectral grade KBr and pressed into disc under hydraulic pressure. Then FTIR spectra were recorded in the 4000- 400cm-1 range (Holler, et al. [3]).

FTIR Spectroscopy of Silver Nitrate: 100mg of silver nitrate was mixed with 100 mg of spectral grade KBr and pressed into disc under hydraulic pressure. Then FTIR spectra were recorded in the 4000- 400cm-1 range (Holler, et al. [3]).

Green Synthesis of Silver Nanoparticles:

Preparation of Stock Solution: 1 mg of aqueous extract was weighed and diluted to 10 ml with distilled water.

Preparation of 1mm Silver Nitrate Aqueous Solution: 0.017g of silver nitrate was dissolved in 100 ml of distilled water to prepare 1mM solution of silver nitrate and stored in amber colored bottle until further use.

Synthesis of Silver Nanoparticles: An aliquot (1ml, 2ml,3ml, 4ml, 5ml) of aqueous plant extract sample was separately added to 10ml of 1mM aqueous AgNO3. To drive nanoparticle formation the reaction mixtures were kept in magnetic stirrer with constant stirring at 120 rpm. Color change of the reaction mixtures were monitored to determine silver nanoparticle formation which is indicated by a colloidal brown color (Shakeel Ahmed, et al. [4]).

Purification of AgNPs: The purification of AgNPs from the final reaction mixture. The reaction mixture (10ml AgNO3 + 5ml leaf extract sample) was split into two equal parts and transferred to pre-weighed sterile 15ml centrifuge tubes. The preparations were then centrifuged at 4000rpm for 20 mins. Supernatants were discarded and the pellets were collected & stored. The pellets were washed in 10ml of distilled water to remove any contaminating plant material before centrifugation for 1hr. This wash step was repeated twice to remove water soluble biomolecules such as proteins and cellular metabolites & then dried in an oven at 37 °C for 1 hr (Jerushka S Moodley, et al. [5]).

Characterization of Silver Nanoparticles: The present study includes time dependent formation of silver nanoparticles employing UV–Vis’s spectrophotometer, shape by employing FESEM and understanding of Pterocarpus marsupium silver nanoparticles interaction from Fourier transform infrared (FT-IR) spectroscopy, particle size measurement, stability from zeta potential and drug entrapment & Energy dispersive x-ray spectroscopy (EDS) for elemental analysis.

• UV- vis spectroscopy

UV-vis spectroscopy is a very useful and reliable technique for the primary characterization of synthesized nanoparticles which is also used to monitor the synthesis and stability of AgNPs. AgNPs have unique optical properties which make them strongly interact with specific wavelengths of light. In AgNPs, the conduction band and valence band lie very close to each other in which electrons move freely. These free electrons give rise to a surface plasmon resonance (SPR) absorption band, occurring due to the collective oscillation of electrons of silver nano particles in resonance with the light wave.

• Fourier transform infrared spectroscopy

FTIR is able to provide accuracy, reproducibility, and also a favorable signal-to-noise ratio. FTIR is a suitable, valuable, noninvasive, cost effective, and simple technique to identify the role of biological molecules in the reduction of silver nitrate to silver.

• Field emission scanning electron microscopy

Among various electron microscopy techniques, SEM is a surface imaging method, fully capable of resolving different particle sizes, size distributions, nanomaterial shapes, and the surface morphology of the synthesized particles at the micro and nanoscales. Using SEM, we can probe the morphology of particles and derive a histogram from the images by either by measuring and counting the particles manually, or by using specific software.

• Energy dispersive x-ray spectroscopy

The combination of SEM with energy-dispersive X-ray spectroscopy (EDX) can be used to examine silver powder morphology and also to conduct chemical composition analysis.

• Determination of Zeta potential

Zeta potential is a measure of surface charge. The surface charge (electrophoretic mobility) of nanoparticles can be determined by using Zeta sizer (Malvern Instrument) having zeta cells, polycarbonate cell with gold plated electrodes and using water as medium for sample Preparation. It is essential for the characterization of stability of the silver nanoparticles.

• Particle Size Determination

The average mean diameter and size distribution of silver nanoparticles is found by Dynamic Light Scattering method using Malvern zeta sizer at 25°C.The dried nanoparticles were dispersed in water to obtain proper light scattering intensity for silver nanoparticles.

• Determination of Entrapment Efficiency

The entrapment efficiency of nanoparticles was determined by adding 10 ml of phosphate buffer of pH 7.4 and sonicated in a bath sonicator and filtered. 1 ml of filtrate is made up to 10 ml with phosphate buffer and was assayed spectrophotometrically at 337 nm (UV visible spectrophotometer, JASCO V-530. The amount of entrapped drug was calculated from the equation. (www.scieconf. com) [6].

In-vitro Methods

α- Amylase Inhibitory Effect: Pancreatic α-amylase, an important enzyme of digestive system hydrolyzes starch into mixture of smaller oligosaccharides comprising of maltose, maltotriose and oligoglucans which are further degraded by glucosidase into glucose that enters the blood stream upon absorption. This leads to elevated post-prandial hyperglycemia (PPHG). Hence, it is important to control these two aspects in the treatment of type 2 diabetes.

Procedure: From 1mg/ml stock solution different concentrations of plant extracts were prepared in phosphate buffer. About 500μl of test/standard was added to 500 μl of α-amylase (0.5mg/ml) is incubated for 10min at room temperature. Then added 500μl of 1% starch solution and incubated for another 10minutes. After that 1ml of coloring reagent was added to reaction mixture it is prepared by mixing sodium potassium tartrate solution (12g dissolved in 8ml of 2M NaOH) and 96Mm 3,5- Dinitro salicylic acid and heated in boiling water bath for 15minutes after cooling, 10ml of distilled water is added. To measure the absorbance of colored extracts blank is prepared for each set of concentration of test sample by replacing the enzyme with buffer. Control incubations representing 100% enzyme activity was prepared by replacing test drug with buffer. Absorbance measured at 540 nm.

Inhibition activity% = Abs (control ) − Abs (extract ) ÷ Abs (control )×100

The positive control used for this assay is acarbose which works by slowing the action of certain chemicals that break down food to release glucose into your blood. Slowing food digestion helps keep blood glucose from rising very high to after meals (Vishnu Kiran M, et al. [7]).

In Vitro Drug Release Study: The antidiabetic drug Pterocarpus marsupium loaded silver nanoparticles (300 mg) were suspended in 10 mL of phosphate-buffered saline (PBS) in a dialysis bag. The dialysis bag was sealed and then slowly shaken in 90 mL of PBS at 37°C in a 250-mL beaker and kept in a magnetic stirrer at an rpm 170. Aliquots of the solution outside the dialysis membrane (2 mL) were replaced with 2 mL of PBS at various times intervals and tested at 427 nm by UV Spectrophotometer. The change of the concentrations of drug with respect to different time intervals were obtained from curves of the absorbance A versus concentration C of Pterocarpus marsupium silver nanoparticles in PBS based on Lambert-Beer law (Guo-Ping Yan, et al. [8]).

Experimental Animals: Female Wistar rats weighing 180- 200 g were used for acute toxicity and antidiabetic activity studies. The animals were kept in polypropylene cages under ambient temperature (22 ± 3 ᴼC) with 12 hrs light/dark cycle. Animals were provided with standard pellet feed and drinking water ad libitum. All animal procedures were performed in accordance with the recommendation for the proper care and use of laboratory animals.

Acute Toxicity Study: Acute oral toxicity testing was carried out in accordance with the OECD guidelines 420 Acute Oral Toxicity – Fixed Dose Procedure method (OECD, 2002).

Procedure: Healthy adult female (generally slightly more sensitive than male) Wistar rats weighing between 180-200 g body weight were procured from Kerala veterinary animal sciences university, Kerala and kept in cages under ambient temperature (22 ± 3 ᴼC) with 12 hrs light/dark cycle. The animals were randomly selected, marked and kept in their cages for 7 days prior to dosing for acclimatization to laboratory conditions. The animals were fasted overnight and were provided with water ad libitum. The test compounds were suspended in 0.5% CMC. Totally 9 animals were used for this study. Sighting study was conducted with 2000 mg/kg body weight. The animals survived without any toxic manifestations during the sighting study and the same dose was selected for the main study. The main study was conducted for a drug at dose of 2000 mg/kg body weight using 8 animals. After the administration of the drug, food was withheld for further 3-4 hours. Animals were observed individually at least once during the first 30 min after dosing, periodically during the first 24 hrs (with special attention during the first 4 hrs.) and daily thereafter for a period of 14 days. Once daily cage side observations included changes in skin and fur, eyes and mucous membrane (nasal), and also respiratory rate, circulatory (heart rate and blood pressure), autonomic (salivation, lacrimation, perspiration, piloerection, urinary incontinence and defecation) and central nervous system (drowsiness, gait, tremors and convulsions) changes.

Experimental induction of diabetes was induced by intraperitoneal injection of streptozotocin (60 mg/kg) dissolved in 0.1M cold sodium citrate buffer (pH 4.5) in overnight fasting rats. Nicotinamide 120 mg/kg was administered 15 minutes prior to the administration of streptozotocin to all animals except control group. The control rats received vehicle alone, and all animals in group 2 to group 5 were allowed to drink 5% glucose solution overnight to overcome the drug-induced hypoglycemia. After 1week time, the rats with moderate diabetes having glycosuria and hyperglycemia (blood glucose range of above 250 mg/dl) were considered as diabetic rats and used for the experiment (Anoop S, et al. [9]).

Experimental Design: The rats were divided into 5 groups, consisting of 8 animals in each group.

• Group 1: Control rats, received saline 10 ml/kg

• Group 2: Diabetic control rats, received Streptozotocin 60 mg/ kg + Nicotinamide 120mg/kg i.p

• Group 3: Diabetic rats received 2.5 mg/kg, Glibenclamide p. o.

• Group 4: Diabetic rats, received 200 mg/kg, Pterocarpus marsupium p. o.

• Group 5: Diabetic rats, received 200 mg/kg, Pterocarpus marsupium silver nanoparticles p. o.

Glibenclamide (2.5 mg/kg) used as standard drug. All the test drugs were administered orally and treatment was continued for 28 days.

Sample Collection: Blood samples were collected from tip of rat tail and blood glucose levels were estimated using glucocheck electronic glucometer weekly basis (0, 7 and 14 days) and body weight measured at weekly intervals before blood glucose estimation.

Estimation: On 15th day of experiment blood was collected from the retro-orbital plexus using ketamine/xylazine anesthesia using capillary tubes in fresh vials containing EDTA and serum was separated. Serum analyzed for total protein and the values were tabulated. Rats were sacrificed by cervical dislocation under ketamine/xylazine anesthesia on 15th day and liver tissue was removed and used for the preparation of homogenates for biochemical estimation.

Tissue Processing of Liver: The tissue was removed and washed with ice-cold saline to remove as much as blood possible. Liver was homogenated (5%w/v) in cold potassium phosphate buffer (50Mm, Ph 7.4) using a Remi homogenizer. The unbroken cell and cell debris were removed by centrifugation at 3000rpm for 10min. The obtained supernatant was used for the estimation of total protein, malondialdehyde, superoxide dismutase, catalase, glutathione reductase, glutathione peroxidase and reduced glutathione.

Statistical Analysis: Statistical analysis was performed using one way ANOVA followed by Dunnett’s test. Values are expressed as mean ±SEM and p<0.05 were considered statistically significant.

Results & Discussion

Preformulation Studies

Physical Characteristics: Pterocarpus marsupium was checked for its color, odor and texture. It is light yellow colored powder in appearance and has a pleasant odor.

Phytochemical Screening: Pterocarpus marsupium was an excellent bio-source of alkaloids, glycosides, carbohydrates and flavonoids, whereas tannins and phenols, saponins test were found to be negative. These are the results for the screening of phytoconstituents present in Pterocarpus marsupium. Pterostilbene is the flavonoid present in the bark of Pterocarpus marsupium which is responsible for the antidiabetic activity (Treas and Evans [10]).

Solubility Studies: From the solubility studies, it has cleared that the Pterocarpus marsupium bark extract is soluble in water, ethanol & phosphate buffer 7.4 and sparingly soluble in chloroform & dimethyl sulphoxide. Hence Pterocarpus marsupium aqueous extract of bark is more soluble in polar solvents than non-polar solvents.

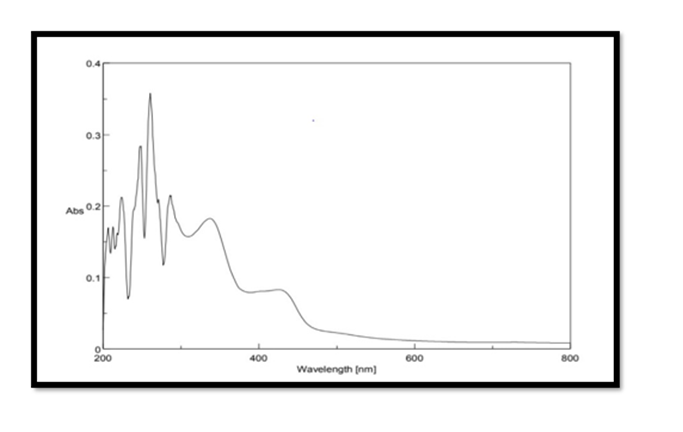
Selection of wavelength: The Pterocarpus marsupium stock solution of concentration 500μg/mL was scanned in the range of 200 – 800 nm for λmax using double beam UV Spectrophotometer. The maximum absorption of Pterocarpus marsupium was found to be at 337nm and hence it is selected as the wavelength for further studies.

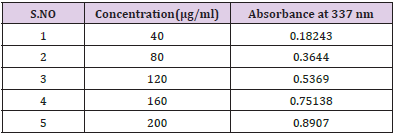
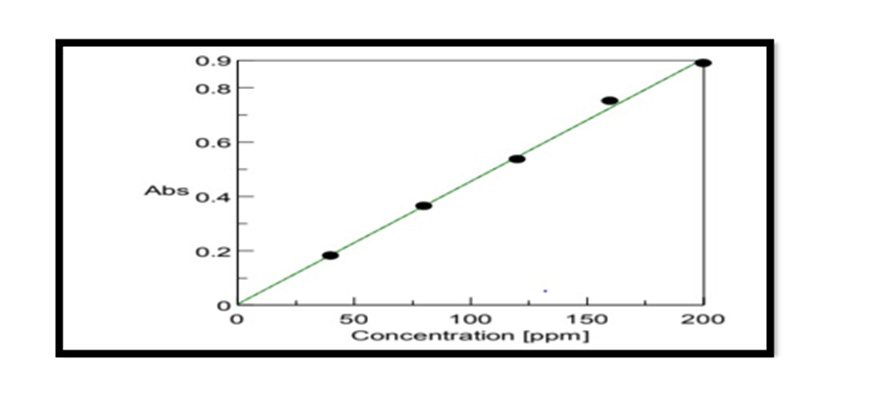
Construction Of Calibration Curve of Pterocarpus Marsupium Bark: To construct a calibration curve, 40 – 200 μg/ml of Pterocarpus marsupium was taken & checked the linearity at 337 nm. The calibration data is shown in the (Table 1). In the calibration curve, linearity was obtained between 40-200μg/ml concentration of Pterocarpus marsupium bark and the regression value was found to be r2 = 0.99837. Hence, we can conclude that Pterocarpus marsupium bark obeys Beer Lambert’s Law at the concentration between 40-200 μg/ml Figure 1.

biomedres-openaccess-journal-bjstr

Table 1: Calibration data of Pterocarpus marsupium bark.

biomedres-openaccess-journal-bjstr

Figure 1: UV visible spectra of Pterocarpus marsupium bark.

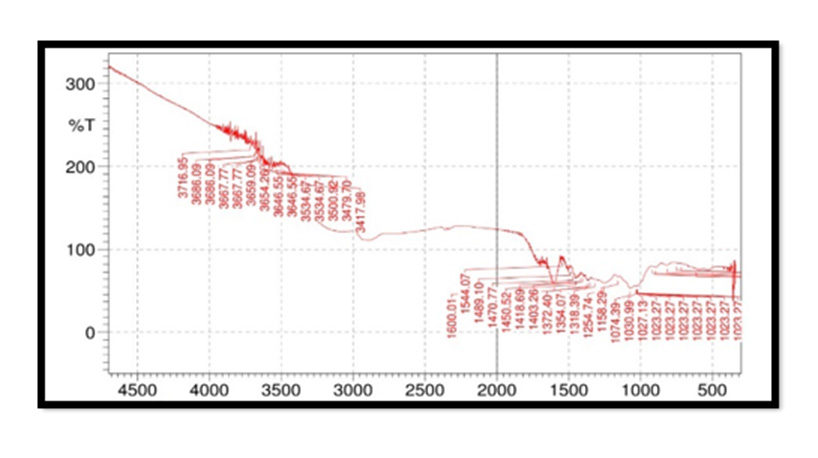
FTIR Spectroscopy of Pterocarpus Marsupium: Fourier Transform Infrared (FT-IR) spectra of the samples were obtained using a FTIR Jasco 4100 Spectrometer by KBr disc method. The spectrums were recorded for the pure drug and physical mixture of drug and excipient and are shown in Figure 2. In the Pterocarpus marsupium bark FTIR spectrum strong absorption peaks at 3500.92 and 3534.67 indicates OH stretching due to the presence of alcohol and phenol Figure 3.

biomedres-openaccess-journal-bjstr

Figure 2: Calibration curves of Pterocarpus marsupium bark.

biomedres-openaccess-journal-bjstr

Figure 3: FTIR spectra of Pterocarpus marsupium bark.

Characterization

biomedres-openaccess-journal-bjstr

Figure 4: FTIR spectra of Pterocarpus marsupium silver nanoparticles.

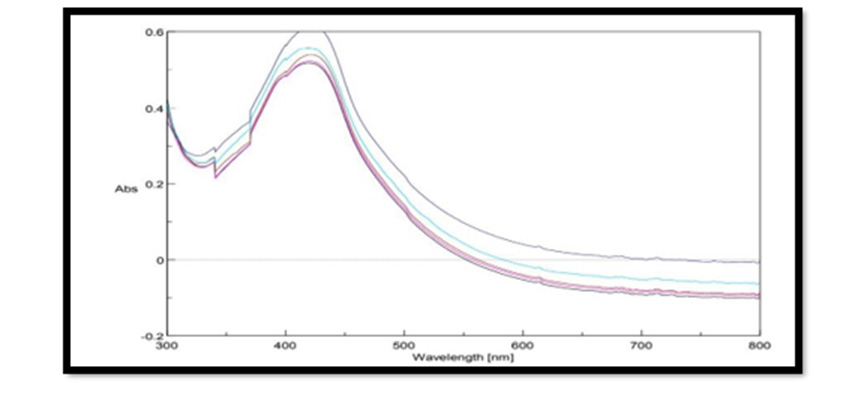
UV Vis Spectral Analysis of Pterocarpus Marsupium Silver Nanoparticles: Periodic sampling of 30 mins, 60 mins, 90 mins, 210 mins & 24 hrs were taken by using distilled water as blank from the wavelength of 300 – 800 m which is depicted in the Figure 4. In AgNPs, the conduction band and valence band lie very close to each other in which electrons move freely. These electrons give rise to a surface plasmon resonance absorption band in the visible region occurring due to the collective oscillation of electrons of silver nanoparticles in resonance with the light wave. The silver surface plasmon resonance was observed at 427nm which steadily increases in intensity as a function of time of reaction (ranging from 30 min to 5 h) without showing any shift of the wavelength maximum (Xi-Feng Zhang, et al. [2]) Figure 5.

biomedres-openaccess-journal-bjstr

Figure 5: Uv- visible absorption spectra of pterocarpus marsupium Roxb. silver nanoparticles at different time intervals.

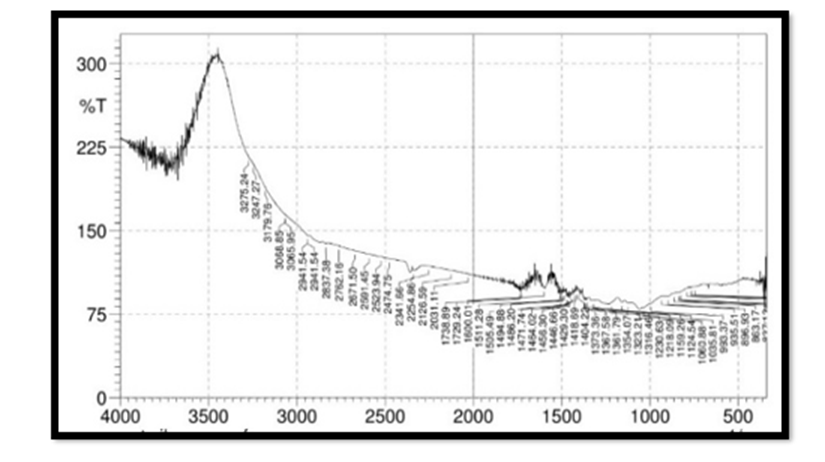
FTIR Spectroscopy of Pterocarpus Marsupium Silver Nanoparticles: In the FTIR spectra of silver nanoparticles band between 3275.24-3247.27 corresponds to OH stretching of free alcohol, 3179-2941 corresponds to CH stretching in aldehyde, 1060- 1464 C=O stretching in carboxylic acid, 1354-1404 corresponds to nitro compounds.

Drug Entrapment Efficiency: The drug entrapment can be calculated after centrifugation by UV spectrophotometry at 427 nm. The amount of drug present in the supernatant liquid was calculated by using the following formula.

% Drug entrapment = W − w / W * 100

W – total amount used in the preparation of silver nanoparticles

w- drug present in the supernatant obtained from calibration curve

(W-w) – amount of drug entrapped (Peng-Fei Yue [11]).

The % entrapment of drug or drug content of Pterocarpus marsupium Roxb. silver nanoparticles were found to be 81% for F1, 83% for F2, 85% for F3, 89% for F4 and 93% for F5. Hence the highest amount of drug was entrapped in the formulation F5 which is 93% also it was in colloidal brown color indicated the formation of Pterocarpus marsupium silver nanoparticles. From the drug entrapment results, the formulation F5 was chosen for further evaluation studies because it possessed high drug entrapment than the other formulations [12].

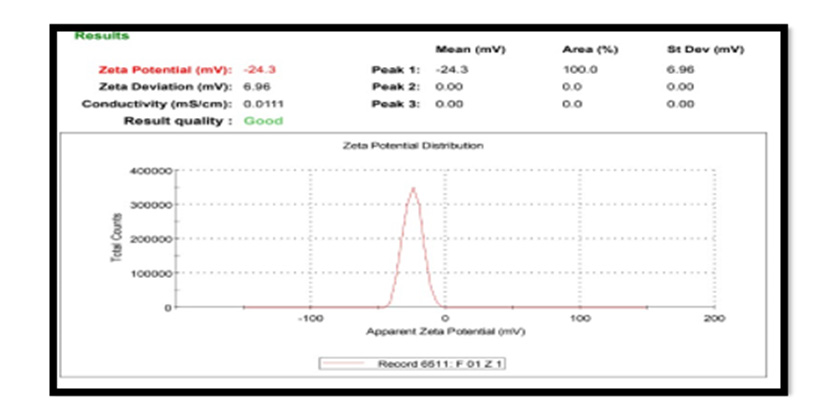
Zeta Potential: For Pterocarpus marsupium silver nanoparticles zeta potential was found to be -24.3 mV with peak area 100 intensity. These values indicate that the formulated Pterocarpus marsupium silver nanoparticles are stable. Zeta potential distribution of silver nanoparticles are depicted in the Figure 6. Nanoparticles with zeta potential value greater than +25 mV or less than - 25 mV typically have high degrees of stability. If all the particles in suspension have a large negative or positive zeta potential, then they will tend to repel each other and there will be no tendency for the particles to come together. However, if the particles have low zeta potential values, then there will be no force to prevent the particles coming together and flocculating [13-20].

biomedres-openaccess-journal-bjstr

Figure 6: Determination of zeta potential of Pterocarpus marsupium silver nanoparticles.

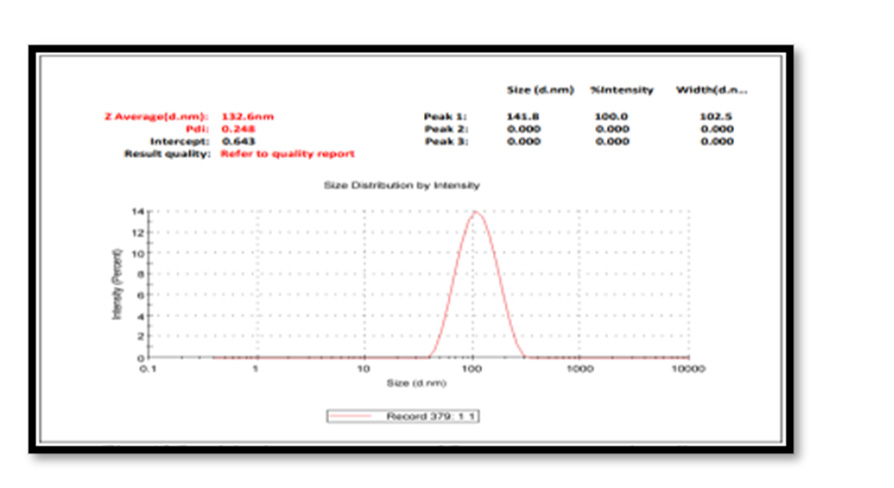
Particle Size Measurement: The average particle size (z-average) is found to be 132.6 nm. Particle size analysis showed the presence of nanoparticles with polydispersity indices PDI value 0.248 with intercept 0. 643. The colloidal solution having a Poly Dispersity Index less than 0.50 are considered as good quality. The results were in agreement with the statement reported before. Physical properties vary greatly with size change in the nanoscale, melting points drop dramatically with smaller nano size; optical absorption is also sensitive to size, where Ag exhibit plasmon absorptions in the 400–600 nm range wavelengths depending on size [21-25] Figure 7.

biomedres-openaccess-journal-bjstr

Figure 7: Particle size measurement of Pterocarpus marsupium silver nanoparticles.

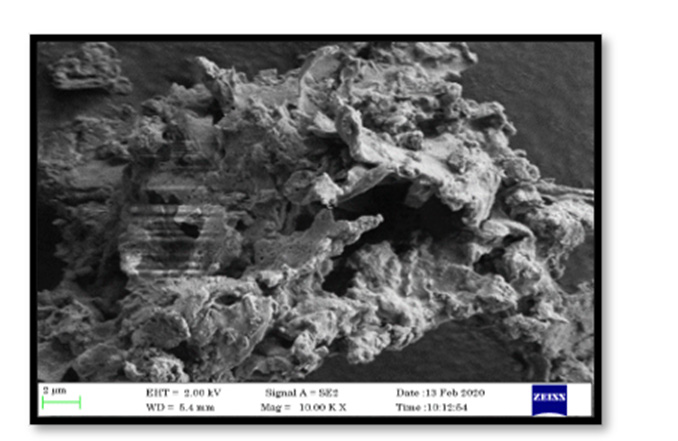
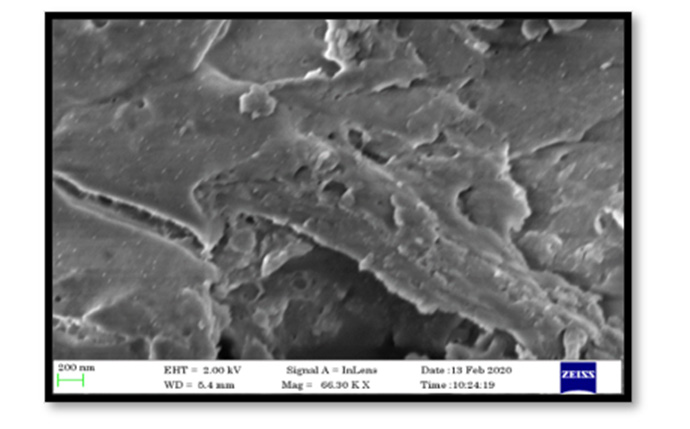
Field Emission Scanning Electron Microscopy: FE SEM analyses of the formulated Pterocarpus marsupium silver nanoparticles were performed to evaluate the surface morphology of nanoparticles. The FESEM image of Pterocarpus marsupium silver nanoparticles displayed below, reveals that the particles were Uniform in size, Spherical in shape and segregated. The FESEM image of silver nanoparticles synthesized by green synthesis process by using 5 % bark extract and 1mM AgNO3 concentration gave a clear image of highly dense silver nanoparticles Figures 8 & 9. The FESEM image showing silver nanoparticles synthesized using Pterocarpus marsupium aqueous extract of bark confirmed the growth of silver nanostructures [25-30].

biomedres-openaccess-journal-bjstr

Figure 8: FESEM analysis of Pterocarpus marsupium silver nanoparticles with 1000 Magnification.

biomedres-openaccess-journal-bjstr

Figure 9: FESEM analysis of Pterocarpus marsupium silver nanoparticles with 66,300X magnification.

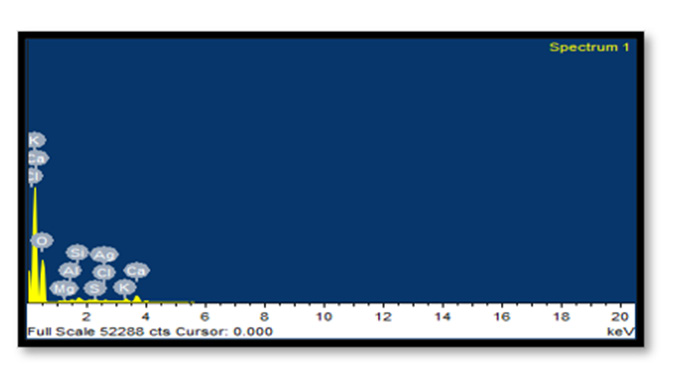
Energy Dispersive X-Ray Spectroscopy: EDX analysis of AgNPs demonstrated a well-defined silver signal at 3 keV along with carbon, oxygen and nitrogen peaks, with the latter weaker signals probably representing surface biomolecule capping structures originating from the bark extracts.

In Vitro Antidiabetic Study

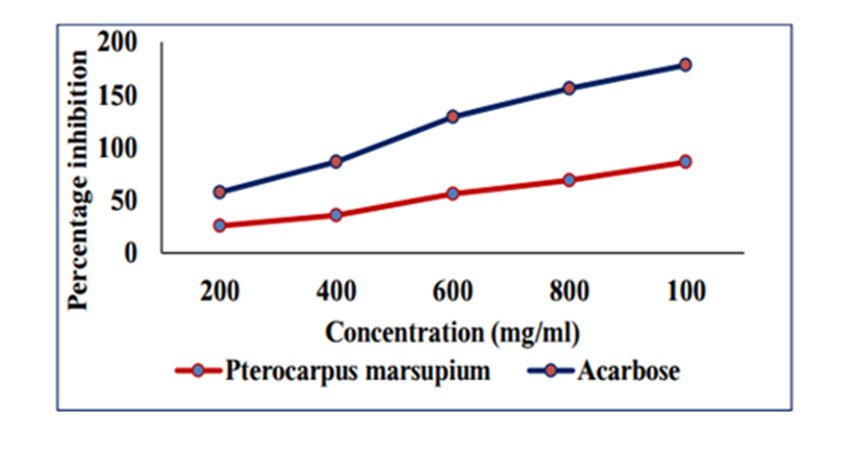
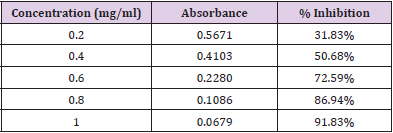
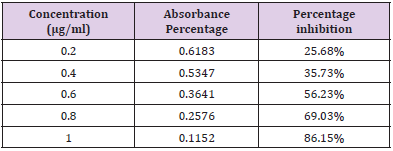
In Vitro Alpha Amylase Inhibition: α-amylase is a key enzyme in carbohydrate metabolism. Inhibition of α-amylase is one of the strategies of treating diabetes. Inhibiting α-amylase will lower post prandial blood sugar. The result suggest that Pterocarpus marsupium silver nanoparticles exhibit good α amylase activity under in vitro condition. Dose dependent % inhibitory activity against α-amylase was noted. Our study indicates that Pterocarpus marsupium could be useful in the treatment of post prandial hyperglycemia. The anti-diabetic activity may be attributed to the presence of flavonoids, tannins & anti α-amylase activity. Acarbose is used as a standard here which is a good antidiabetic drug and works by slowing the action of certain chemicals that breakdown food to release glucose into our blood. The absorbance of control without sample is taken and it is 0.832. Percentage inhibition of α amylase for the positive control Acarbose was found to be 31.83% at concentration 0.2mg/ml. Percentage inhibition of α amylase for the pterocarpus marsupium Roxb. silver nanoparticles were found to be 25.68% for the concentration 0.2mg/ml [31-40]. The percentage α amylase inhibition of positive control Acarbose at lower(0.2mg/ ml) and higher (1mg/ml) concentration were found to be 31.83% and 91.83% and for test pterocarpus marsupium Roxb. silver nanoparticles percentage α amylase inhibition at lowest (0.2mg/ ml) and highest (1mg/ml) concentration were found to be 25.68% and 86.15% respectively [41-45] Figures 10 & 11.

biomedres-openaccess-journal-bjstr

Figure 10: EDX spectrum of mineral crust.

biomedres-openaccess-journal-bjstr

Figure 11:  amylase inhibition of Pterocarpus marsupium silver nanoparticles & acarbose on alpha amylase enzyme.

In Vivo Results

Acute Toxicity Studies and Selection of Dose for In-Vivo Studies

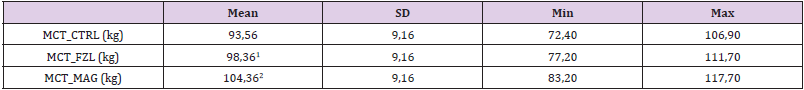
The aqueous extract of bark of Pterocarpus marsupium silver nanoparticles were selected and used for further in vivo evaluation. Acute toxicity was carried out as per OECD guidelines 420 employing fixed dose procedure for selecting the dose for biological activity. For acute toxicity studies female wistar rats weighing 180- 195gms were taken and they were fasted overnight before the experimental day. Overnight fasted rats were weighed, and body weight determined for dose calculation and test compound were administered orally. 2000 mg/kg dose of Pterocarpus marsupium silver nanoparticles and the rats were observed for signs of acute toxicity. No toxic effect was observed after sufficient interval of time (2-3days). Signs and symptoms of toxicity and death if any were observed individually for each rat at 0, 0.5, 1, 2, 3 and 4h for first 24h and thereafter daily for 14 days. Diet was given to the animals after 4th hour of dosing. The animals were observed twice daily for 14 days, and body weight changes, food and water consumption were noted. In acute toxicity studies, it was found that the animals were safe up to a maximum dose of 2000mg/kg of body weight (Tables 2 & 3). There were no changes in normal behavioral pattern and no signs and symptoms of toxicity and mortality in rats. As per the OECD 420 guidelines Pterocarpus marsupium silver nanoparticles can be included in the category 5 or unclassified category of globally harmonized classification system (GHS) [45-50]. Hence based on these results the Pterocarpus marsupium silver nanoparticles were considered non-toxic and 1/20th dose were used for the biological evaluation (antidiabetic activity) and the studies were conducted at dose levels of 2000 mg/kg body weight [51].

biomedres-openaccess-journal-bjstr

Table 2: Alpha amylase inhibitory effects of positive control Acarbose.

biomedres-openaccess-journal-bjstr

Table 3: α- Amylase inhibitory effects of Pterocarpus marsupium Roxb. silver nanoparticles. Comparison of percentage inhibition of both positive and test drug.

In Vivo Antidiabetic Activity of Pterocarpus Marsupium Silver Nanoparticles

The biological evaluation was carried out using 2000mg/ kg dose of aqueous bark extract of Pterocarpus marsupium silver nanoparticles. The body weight of control and experimental animals on 0, 7, 14, 21, 28 days of treatment. There was significant reduction of body weight in diabetic control animals compared to normal control & test drug treated animals. On 7th day significant reduction of body weight was observed in diabetic control animals (159.85±3.95) when compared to control rats (193.14±2.47). Reduction in body weight indicates the induction of diabetes. The normal control (209.28±2.28) and drug treated rats pterocarpus marsupium aqueous extract, Pterocarpus marsupium silver nanoparticles, glibenclamide gained significant weight (172.42±9.19, 175.57±3.32, and 173±8.3) (P<0.01) on 28 days of treatment. The effect of pterocarpus marsupium aqueous extract, Pterocarpus marsupium silver nanoparticles, glibenclamide on streptozotocin and nicotinamide induced diabetes in rats. Initially it was found that a significant (P<0.01) increase in blood glucose level was observed in STZ-nicotinamide induced diabetic rats (243±4.601) compared to normal control (80.5±3.12). After the daily treatment for 14 days showed significant (p<0.05), (P<0.01) reduction in blood glucose 2000 mg/kg p.o of aqueous extract of Pterocarpus marsupium (195±2.90), aqueous extract of Pterocarpus marsupium silver nanoparticles (179.25±1.493), 2.5 mg/kg, p.o of glibenclamide (165.25±3.78) as compared to diabetic control group. (243 ± 4.60) ##

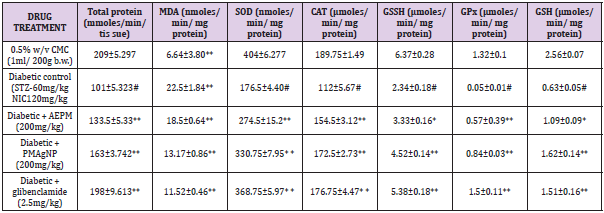
The level of protein after 28 days of treatment in liver is shows that decrease in protein level was found in diabetic control (101±5.323) rats compared with control rats (209±5.297). Administration of Pterocarpus marsupium aqueous extract, Pterocarpus marsupium silver nanoparticles (2000mg/kg), (133.5+5.33,163+3.742) and glibenclamide (2.5 mg/kg) treated rats (198.25±9.613) restored the protein level significantly near to normal levels. The results were found to be statistically significant (P<0.01). A significant (P<0.01) increase was observed in the activities of SOD in the treatment groups administered with, Pterocarpus marsupium aqueous extract, Pterocarpus marsupium silver nanoparticles (200 mg/ kg), glibenclamide (274.5±15.2, 330.75±7.95, 368.75 ± 5.97) CAT (154.5±3.12, 172.5±2.73, 176.75±4.47) GSSH(3.33±0.16, 4.52±0.14, 5.38±0.18) GPX (0.57±0.39, 0.84±0.003, 1.5±0.11) and GSH (1.09±0.09, 1.62±0.14, 1.51±0.16) in liver homogenates of diabetic rats compared to control rats. Administration of pterocarpus marsupium silver nanoparticles (2000mg/kg) (172.5±2.73) and standard glibenclamide (176.75±4.47) significantly (P<0.01) increased the activity of CAT enzymes compared to the negative control group (112±5.67). The level of GSSH (4.52±0.14, 3.33±0.16, 5.38±0.18) and GPX (0.57±0.39,0.84±0.03,1.5±0.11) level were also increased with the treatment of Pterocarpus marsupium aqueous extract Pterocarpus marsupium silver nanoparticles (2000 mg/kg), glibenclamide (2.5mg/kg) compared with the negative control in liver. (112±5.67) [52-57] (Table 4).

biomedres-openaccess-journal-bjstr

Table 4: Effect of Pterocarpus marsupium silver nanoparticles on the serum in in streptozotocin and nicotinamide-induced type 2 diabetes mellitus rats.

Note: Each value represents the mean ± SEM, n= 8 In negative group, # P< 0.01 Vs control Group IV & V ** P < 0.01 Vs Group II and Group III *P< 0.05 Vs group II.

Data were analyzed by one-way ANNOVA followed by Dunnet’s test.

The non-enzymatic antioxidant, GSH level also decreased in diabetic control group compared with the control group. Treatment with Pterocarpus marsupium aqueous extract 2000 mg/kg (1.09±0.09) pterocarpus marsupium silver nanoparticles 2000 mg/ kg (1.62±0.14) and glibenclamide (1.51±0.16) significantly (P<0.01) increases this enzymes level compared with the negative control group in liver. The effect of Pterocarpus marsupium bark extract & its silver nanoparticles on MDA shown in table. MDA level was found to be elevated in streptozotocin and nicotinamide-induced diabetic rat (22.5±1.84) compared to control rats (6.64±0.3.80) in liver. This level was significantly (P<0.01) reduced in the diabetic rats treated with the, Pterocarpus marsupium bark extract & its silver nanoparticles 2000 mg/kg (18.5±0.64, 13.17±0.86) and standard glibenclamide (11.52±0.46) treated groups. Streptozotocin (STZ) is 1-methyl-l-nitrosourea attached to the carbon-2 position of glucose that causes β-cell necrosis and induces experimental diabetes in many animal models. It causes DNA strand breaks that induce the activation of poly-ADP-ribose synthetase followed by lethal nicotinamide adenine dinucleotide (NAD) depletion. Nicotinamide adenine dinucleotide causes activation of the poly ADP ribose synthase to repair the damaged DNA and protecting the decrease in the level of NAD and proinsulin thereby partially reversing the inhibition of insulin secretion to prevent the aggravation of experimental diabetes. This condition shows a number of features which are similar with type 2 diabetic mellitus (T2DM). Hence, based on this point of view, the hypoglycemic activity of Pterocarpus marsupium silver nanoparticles carried out on STZ and nicotinamide induced type 2 diabetic rats.

In streptozotocin and nicotinamide-induced type 2 diabetic mellitus there was a significant reduction in body weight in diabetic rats is due to excessive break down of tissue protein. Treatment with Pterocarpus marsupium silver nanoparticles & glibenclamide improved body weight significantly inducing prevention of muscle wasting due to hyperglycemic condition. The difference in body weight is large in control group compared with negative control group. In treatment group also, there is an increase in the body weight compared with the diabetic control group. Generation of free radicals in diabetes mellitus reacts with lipids causing lipid peroxidation, resulting in the release of products such as malondialdehyde, hydroperoxide and hydroxyl radicals. The oxidative stress in diabetes decreases the antioxidant status. SOD, CAT, GSSH and GPx are enzymatic antioxidants and non-enzymatic antioxidant like GSH plays an important role in protecting cells from being exposed to oxidative damage by direct elimination of reactive oxygen species (ROS).

CAT and SOD are considered primary enzymes since they are involved in the direct elimination of ROS. SOD is an important defense enzyme which catalyzes the dismutation of superoxide radical and CAT is a hemoprotein which catalyzes the reduction of H2O and protects the tissue from hydroxyl radicals. GPX, a selenium containing enzyme present in significant concentration detoxifies H2O2 to H2O through the oxidation of reduced glutathione. The reduced activity of SOD, CAT, GPX, GSSH, GSH in the liver during diabetes is a result of deleterious effects which results in the accumulation of superoxide anion radicals and H2O2. The activity of enzymatic and non-enzymatic antioxidants is increased significantly in Pterocarpus marsupium silver nanoparticle treated animals (P<0.01). Marked increase in the concentration of MDA was observed in the liver of diabetes rats. Pterocarpus marsupium silver nanoparticle and glibenclamide tends to bring the increased concentration of lipid peroxidation products to near normal level.

Conclusion

In conclusion it maybe stated that, there occurs a significant (P<0.01) decrease in the hyperglycemic state after the administration of Pterocarpus marsupium silver nanoparticle which reduce the severity of oxidative and acuity of hyperglycemia, a process that closely linked to glucose oxidation and formation of free radicals. Our results suggested that Pterocarpus marsupium silver nanoparticle has more favorable reduction in lipid level in STZ and nicotinamide - induced diabetic rats, compared with glibenclamide as well as regeneration of ß- cells of pancreas. The present study suggests that Pterocarpus marsupium silver nanoparticles can be successfully utilized for the management of diabetes due to their anti-hyperglycemic action.


For more Articles on: https://biomedres01.blogspot.com/

The Use of Calcium Dobesilate in the Treatment of the Early Stage of Non-Proliferative Diabetic Retinopathy

  The Use of Calcium Dobesilate in the Treatment of the Early Stage of Non-Proliferative Diabetic Retinopathy Introduction Etiological Contr...