Clinical Relevance of Red Cell Distribution Width and Reticulocytes Hemoglobin Content in Children with Fever without Source
Introduction
The main reason to consult in a pediatric emergency service is fever [1]. Up to 20% of these fever episodes have no apparent source in children under 3 years old and represent a specific nosological entity called fever without source (FWS) [2]. FWS represents a frequent and challenging situation, because both the timely distinction between a viral and bacterial etiology, as well as the early identification of individual with benign and selflimiting disease prone to be treated in an ambulatory settings, still remain partially met clinical needs [2,3]. FWS stratification tools include several clinical prediction rules, biological parameters, such as leukocytosis, C-reactive protein (CRP), and procalcitonin (PCT). So far these risk stratifications have been mostly dedicated to distinguish between viral and severe bacterial infections (SBI) with suboptimal discriminant accuracy [4]. If PCT values below 0.3 ng/ml have shown some promise to effectively rule-out SBI [5,6], knowing whether this single biomarker would outperform clinical prediction rules, enhance their discriminate accuracy for SBI or display sufficient negative predictive value (NPV) is still uncertain [3,6]. Considering these limitations, the integration of multiple biomarkers into a biomarker-based score showed some promise. To this respect the Lab-Score combining CRP, PCT, and urine analysis results probably represent the most discriminatory algorithm available so far [2,7-9], especially when used in a step by step approach in combination with clinical presentation, age and absolute neutrophils count, with optimal NPV for SBI [10]. Nevertheless, because of the lack of specific markers for viral infection, approximately 50% of children with FWS of viral etiology are currently exposed to unnecessary antibiotic treatment and are hospitalized [11].
Therefore, the identification of a biomarker highly specific for viral infections or allowing the early distinction between FWS patients with self-limited disease from those requiring hospitalization could be of considerable interest to optimize patient triage at the emergency room. Among emerging biomarkers of possible interest in FWS, several new hematological parameters automatically provided by SysmexTM analyzers could represent appealing candidates [12-16]. Among them, the red blood cell distribution width (RDW-CV) measuring the degree of heterogeneity of erythrocyte volume, and the reticulocytes hemoglobin content (Ret-He) indicating the iron availability for erythropoiesis, may be promising. In adults suffering from Influenza infections or septic shock, RDW-CV elevation was found to be associated with a worse prognosis [12,13]. On the other hand, in community acquired pneumonia, Ret-He has been shown to be decreased transiently in response to the Interleukin6–dependent hepcidin production leading to iron sequestration in other compartments than those involved in red blood cells maturation [14,15]. Whether Ret-He changes could reflect the infection severity or be of clinical relevance especially in infectious settings is still elusive. Therefore, in this pilot study we investigated whether RDW-CV and Ret-He, already available at no additional costs, could provide meaningful diagnostic and prognostic information in FWS when compared to the Lab-score, and whether these parameters would improve the discriminant accuracy of the Lab-score, both in term of hospitalization duration prediction and ability to confirm the presence of a viral infection
Materials and Methods
The research ethics committee of Geneva University Hospitals approved the study protocol (CER 15-082), and Informed consent given by parent or legal representative before enrolment. The study was performed in accordance with the declaration of Helsinki.
Patient Population and Study Design
This ancillary study was derived from a soon published cohort [17]. Participants for this prospective, single-center, and epidemiological diagnostic study were enrolled in the emergency room (ER) division of the Geneva University Hospitals between November 2015 and December 2017. Briefly, 241 patients aged <3 years-old were admitted to the pediatric ER of Geneva University Hospitals (a tertiary care hospital) with a diagnosis of FWS. FWS was defined as a febrile episode of less than 7 days with no cause determined by the history or the physical exam. The exclusion criterias for this study were unavailable blood samples or unavailable SysmexTM datas, comorbidities predisposing to infections such as cancer, primary or secondary immunodeficiency, and iatrogenic immunosuppression. From the initial 241 patients, 170 had to be excluded because of missing RDW-CV and Ret-He data, leaving 71 patients available for this exploratory study (Figure 1). Besides usual blood investigations for the normal care of children presenting with FWS, blood and urine culture were obtained for all patients. Real-time PCR was used for Adenovirus (AdV, quantitative assay, Argene commercial kit) and Herpes Human Virus- 6 (HHV- 6, qualitative assay, in-house assay followed by quantitative assay, Genesig commercial kit) [18], whereas quantitative and semiquantitative, real-time, reverse- transcription (RT)-PCR were used for Hepatitis E virus (HEV) [19] and Human Parechovirus (HPeV) respectively [20]. Semi-quantitative results were reported as cycle threshold (CT) values; samples with CT values <40 were considered positive. Quantitative results were reported in copies/ml (17). Medical history and the Lab-score, were obtained at admission and relevant information was recorded on an individual case report form [17].
Study Endpoints
Two predetermined endpoints were considered for this explorative study. The primary endpoint consisted in hospitalization duration >24h (HD>24h). The secondary endpoint consisted in a final diagnosis of viral infection defined by the identification of aforementioned viral pathogens or in presence of a highly suggestive clinical presentation in absence of documented bacterial infection. Purely bacterial, mixed infections or undefined etiologies were considered as other etiologies. The endpoints adjudication was performed by one senior physician blinded to the participant’s biological data.
Biological Analyses
Venous blood samples were collected in heparinate lithium and Ethylene Di-amino Tetra Acetate (EDTA) vials on patient admission to the pediatric ER, prior to treatment initiation. Samples were immediately processed for routine requirement. PCT and CRP measurements were performed on Cobas 8000 instruments (Roche, module c801 and module c702, respectively).
Generic and Specialized Hematological Parameters
Blood samples were collected in pediatric tubes containing EDTA and then analyzed for CBC-DIFF and reticulocytes count on a Sysmex XN-10 instrument. Besides classical hematological parameters, such as the leucocytes count, hemoglobin concentration and the neutrophils count, the XN-10 provides new parameters delivering complementary information for the granulocytic lineage and the red lineage [16]. We studied 6 of these new parameters. Three for the granulocytic lineage: the Neutrophil Reactive Intensity (NEUT–RI), the Neutrophil Granularity Intensity (NEUTGI) and Neutrophils Width on y axis (NEUT-WY); and 3 for the red lineage: the hemoglobin content of reticulocytes (Ret-He), the difference in cellular hemoglobin content between reticulocytes and erythrocytes (Delta-He) and the Red Cell Distribution Width CV (RDW-CV). Further details regarding these specialized hematological parameters can be found in Figures 1-3.
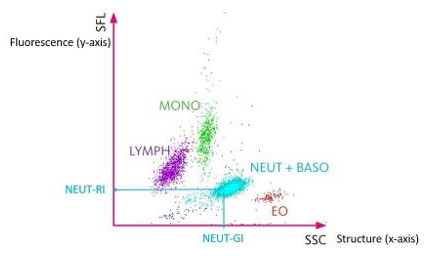
Figure 1: White blood cells scattergram in the WBC channel. The scattergram in the WBC channel represents on the x axis the structure of the cells (SSC) and on the y axis the fluorescence (SFL). The NEUT-RI represents the mean fluorescence of neutrophils and is related to the activation and the immaturity of the cells. The NEUT-GI represents the mean value of high angle diffraction and represents the complexity of the neutrophils (nucleus, granulations, …) [16]. The red cloud named EO represents eosinophils, the blue cloud named NEUT + BASO represents neutrophils and basophils, the green cloud named MONO represents monocytes, the purple cloud named LYMPH represents lymphocyts.
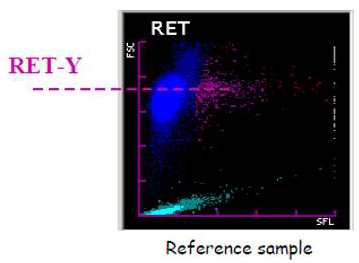
Figure 2: Red blood cells scattergram in the RET channel. The scattergram in the RET channel represents on the x axis the fluorescence and on the y axis the size of the red blood cells. The Ret– He is calculated from the Ret–Y (mean value of the red blood cell size on the y axis) and represents the mean hemoglobin content of red blood cell precursors (Reticulocytes). The Delta-He is the difference in cellular hemoglobin content between reticulocytes and erythrocytes.
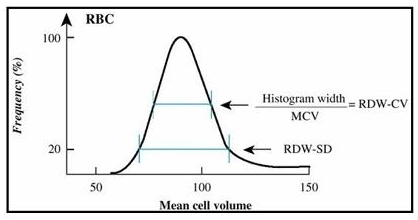
Figure 3: Red Cell Distribution Width Standard Deviation (RDW-SD) and Red Cell Distribution Width Coefficient of Variation (RDW-CV) derived from the red blood cells curve in impedance. The RDW-CV is calculated from the RDW-SD which is the width of the impedance curve of the red blood cells 20% above the base line.
Statistical Analyses
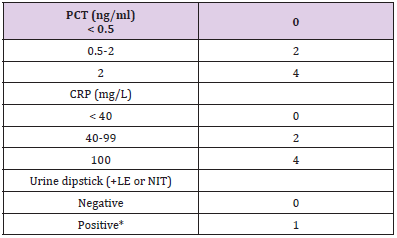
Table 1: Determinant of the Lab-score.
Note: *Positive urine dipstick: positive leukocytes esterase, or nitrite test result. LE: leucocytes; NI: Nitrites.
Analyses were performed using STATISTICA™ software (StatSoft, Tulsa, OK, USA). Fisher’s bilateral exact test and Mann– Whitney U-test were used where appropriate. Associations between biomarkers and study endpoints are presented as the odds ratio (OR) and corresponding 95% confidence interval (95% CI). Multivariable analyses with logistic regression were used to assess associations between continuous variables. In this model, endpoints were set as dependent variables, and the Lab-Score (Table 1) was set as the unique confounder because of the limited sample size. Adjusted analyses were performed only in case of significant univariate analyses. ROC analyses were performed using ANALYSE-IT™ software for Excel (Microsoft, Redmond, WA, USA) to identify the biomarker with the best area under the curve (AUC). AUC comparisons were performed according to the nonparametric approach proposed by DeLong, et al. [21]. The optimal cut-off was determined in a post-hoc based upon ROC curve results. Corresponding sensitivity (SE), specificity (SP), positive predictive value (PPV), negative predictive value (NPV) with the respective 95% CIs are given. A value of p<0.05 was considered statistically significant.
Results
Baseline Clinical Demographic and Biological Characteristics
The clinical features of our population are summarized in Table 2. A total of 71 patients were included in the cohort. Among them 19 were discharged <24 hours, and 38 had a final diagnosis of viral infection. Among the latter, 11 had an enteroviral meningitis (15.5%), 12 a viral upper respiratory tract infections (16.9 %), 12 a viral gastroenteritis (16.9%), 1 a hand-foot-and-mouth disease (1.41%), 1 a viral rash (1.41%), and 1 a viral meningitis (1.41%). The remaining patients included had either bacterial infections only, mixed infections (bacterial and viral) (n=7), or undefined etiologies (n=3). A total of 52 patients had a hospital stay superior or equal to 24 hours (73.24%).
RDW-CV as an Independent Predictor of the Hospitalization Duration >24h (HD >24)
Table 2 shows that patients with HD>24h had higher median levels of RDW-CV upon inclusion when compared to those with HD<24h (14.1% versus 13.1% p<0.0001). The results were further confirmed by the ROC curves analyses (Table 3) showing that the AUC of the RDW-CV for an HD>24h was 0.79 (95%CI:0.67-0.92, p<0.0001), which was the highest for all parameters tested. In comparison, the ROC curve of the Lab-score displayed an AUC of 0.66 (95%CI: 0.53-0.79, p=0.0068). The AUC difference between RDW-CV and the Lab-score was nevertheless not found to be significant according to the Delong method (delta: 0.13, p= 0.11; Table 3). Adding RDW-CV to the Lab-score significantly increased the latter AUC from 0.66 to 0.84 (95CI%: 0.72-0.95; delta: 0.18; p=0.001, Table 3). Furthermore, logistic regression analyses indicated that for each percent of RDW-CV
increase, there was a concomitant 3.28-fold increase in the risk of HD>24h (OR: 3.28, 95%CI:1.57-6.87, p=0.0015) which remained unchanged after the adjustment for the Lab- score (OR: 3.76, 95%CI: 1.11-12.67, p=0.03) (Table 4). Conversely, the risk association for the Lab-score was independent of RDW-CV (adjusted OR: 1.68,95% CI: 1.07 - 2.65; p=0.03). Taken together, these results indicate that both RDW-CV and the Lab-score are independently associated with HD>24h, with an apparent superior strength of association Privileging the PPV, the optimal cut-off of RDW-CV was found to be of 15.2 % with a PPV of 100 % (95%CI: 63-100), a NPV of 31% (95%CI: 20-44), a SN of 17% (95%CI:9-31), and a SP of 100% (95%CI:79-100; Table 5).
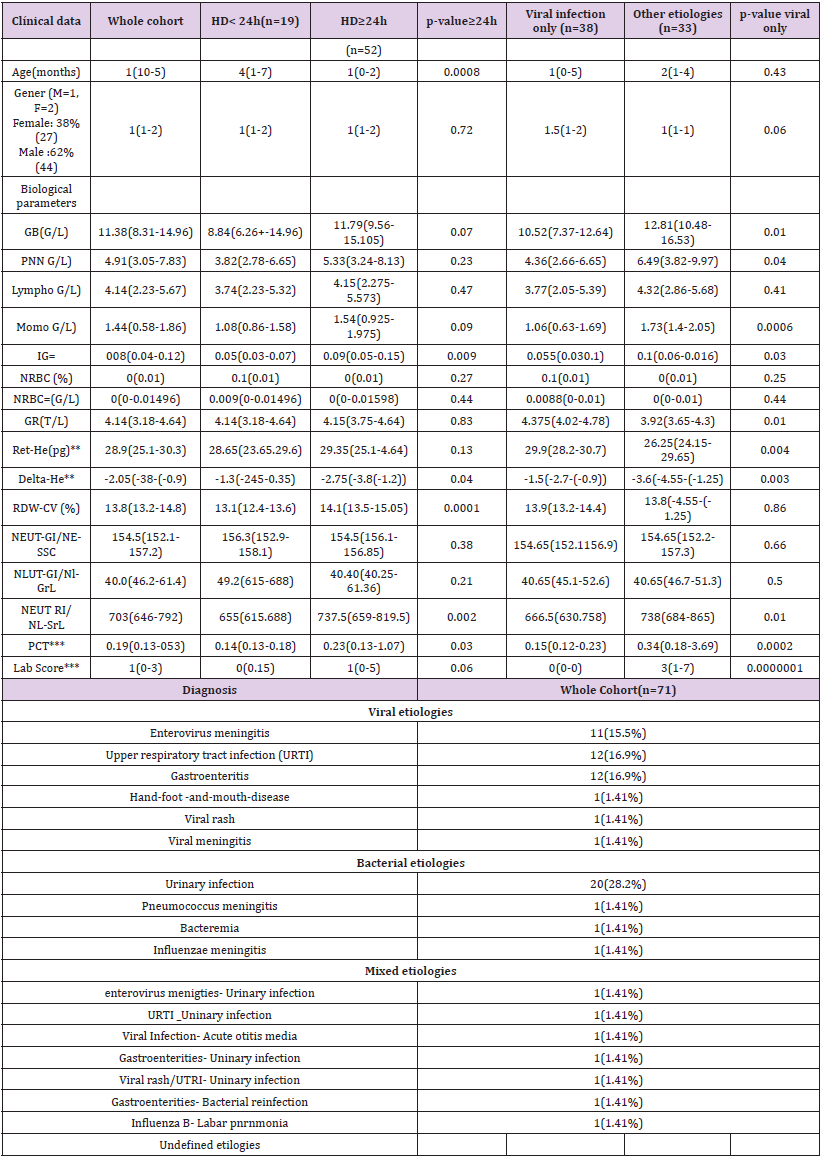
Table 2: Patient Baseline Characteristics.
Note: *Correspond to significant AUC differences.
GB: WBC: White Blood Cells; PNN: Neutrophils; IG#: Immature Granulocytes; NRBC: Nucleated Red Blood Cells; GR: RBC : Red blood cells
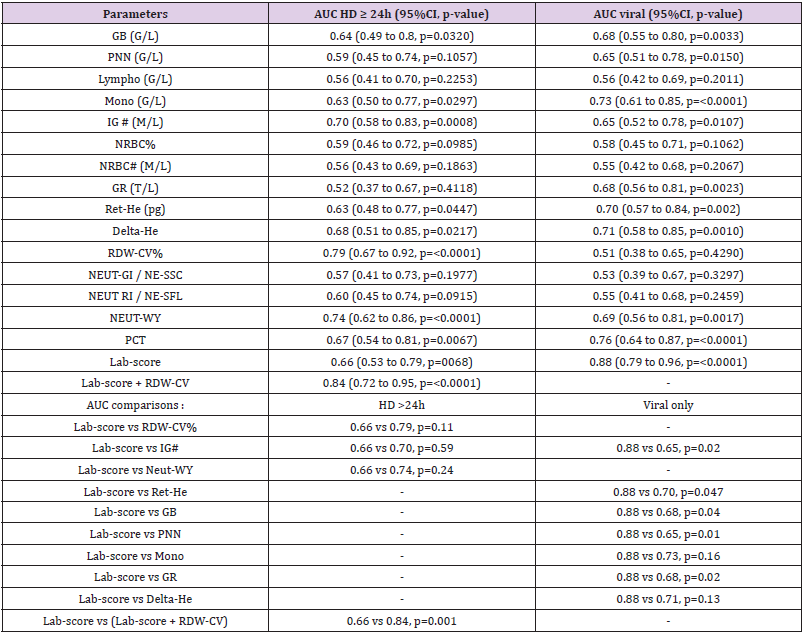
Table 3: Discriminant accuracies of hematological parameters for hospitalization duration ≥ 24h and infections of viral etiology.
Note: *Correspond to significant AUC differences.
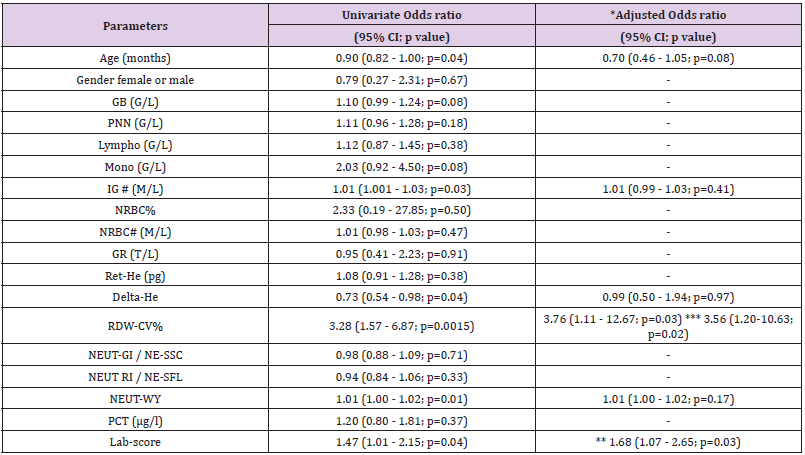
Table 4: Risk associations for hospitalization duration ≥24h.
Note: *Adjusted for the Lab-score, except when **. Adjusted analyses were performed only in case of significant univariate analyses. ** adjusted for RDW-CV. *** adjusted for Labscore and age

Table 5: Optimal cut-off values.
Note: *Based upon ROC curves analyses. **Set in order to maximize PPV.
Ret-He as a Non-Meaningful Marker of Infections of Viral Etiologies
Table 2 shows that patients with a final diagnosis of viral infection had higher median levels of Ret-He upon study inclusion when compared to those with infections of other etiologies (29.9 pg vs 26.25 pg, p=0.004). ROC curves analyses (Table 3) indicated that Ret-He had an AUC of 0.70 (95%CI: 0.57-0.84, p=0.002), whereas the Lab- score (cut-off: 3 points (22)) (displayed the highest diagnostic accuracy with an AUC of 0.88 (95%CI: 0.79- 0.96, p<0.0001) to detect an infection of viral etiology. The AUC comparison between Lab-score and Ret-He, indicated that the AUC difference was significant with a delta of 0.18 and a p-value of 0.047. Logistic regression analyses indicated that if Ret-He was significantly associated with a final diagnosis of viral infection in unadjusted analysis (OR:1.31;95%CI: 1.09-1.57, p=0.004), the association was lost after adjusting for the Lab-score. Furthermore, none of the parameters tested remained significant when adjusted for the Lab-score (Table 6). Privileging the PPV value, the optimal cut-off value found was 29.8 pg with a PPV of 76% (95% CI: 0.53- 0.89), a SP of 81% (95% CI:0.63-0.92), a SN of 53% (95% CI:0.35- 0.70), and NPV of 60% (95% CI: 0.46-0.76; Table 5).
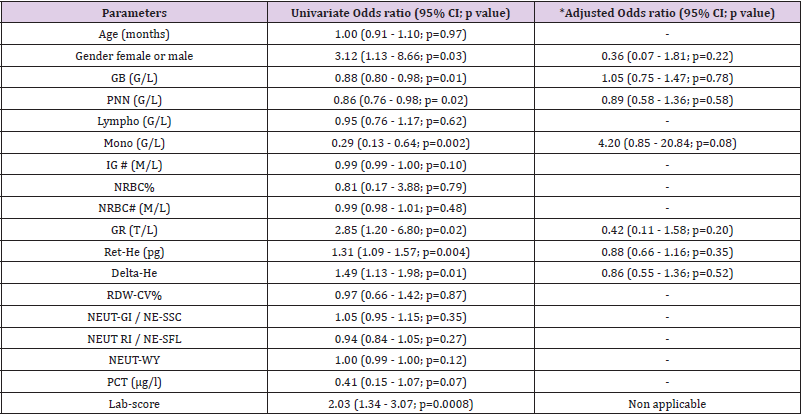
Table 6: Risk associations for infections of viral etiology.
Note: *Adjusted for the Lab-score. Adjusted analyses were performed only in case of significant univariate analyses.
Discussion
The key finding of this pilot study is that both RDW-CV and the Lab-score were independent predictors of a HD>24h in children with FWS, whereas the remaining hematological parameters tested were not, after the adjustment for the Lab-score. To the best of our knowledge, this is the first report of the Lab-score as predictor of hospital duration. Indeed, so far most of the studies performed analyzed the capacity to distinguish patients with SBI [2,7,10,22]. Nevertheless, despite being significant, the AUC was rather modest (0.66) and whether it would be enough to influence patient management remains to be tested in other larger studies. On the other hand, RDW-CV tended to have a better AUC (0.79) and displayed an optimal positive predictive value of 100% at the 15.2% cut-off. Although derived in a post-hoc manner in order to optimize positive predictive value, this cut-off is very close to previously reported RDW-CV cut- offs (between 14.5 % and 15.5%) predicting mortality in patients with SBI or septic shock [12,23- 25]. Furthermore, if the AUC difference between RDW-CV and the Lab- score (0.79 vs 0.66; p=0.13) was not found to be significant according to the Delong method [21], adding RDW-CV to the Labscore nevertheless substantially increased the latter AUC from 0.66 to 0.84 (p=0.001) (Table 6). These results indicate that RDWCV values above 15.2% in FWS would allow the clinicians to early identify patients requiring prolonged hospitalization regardless of infection etiology, and accordingly to improve patients triage in the emergency room.
Furthermore, being automated and available 24h/24h with a turn-around time around 1 minute, RDW-CV results would meet most of the requirements needed for an emergency test. Nevertheless, these appealing preliminary results need to be replicated and validated at a larger scale before any clinical recommendation can be made. Also, knowing whether RDW-CV should be introduced into the Lab-score or considered separately to optimally identify patients requiring hospitalization awaits clarifications. The other principal findings concerning the Ret-He is that this parameter was not significant when adjusted with the Labscore to predict the viral etiology in FWS, as the other parameters tested. However, it is interesting to mention that the median value of Ret-He for viral infections (29.9 pg vs 26.25 pg) was higher than the one retrieved in other etiologies (including bacterial, mixed infections and undefined etiologies), which can be explained by the fact that iron sequestration is more severe in case of septic conditions (26,27). The Ret-He AUC to predict a uniquely viral infection was not found to be optimal (AUC: 0.70), especially as it was not found to be independently associated with this diagnosis, when adjusted for the Lab-score. Furthermore, privileging the PPV, the optimal post-hoc retrieved cut-off (29.8 pg) only displayed a PPV of 76%, which is too low to be considered for rule-in purposes, especially given the lower end of the 95%CI (53%). There are several limitations in this study. Firstly, due to the limited sample size of this pilot study, we could not provide a proper interpretation of non-significant findings reported. Nevertheless, given the strength and independent nature of the association between RDWCV and HD>24h, those preliminary results clearly indicate that RDW-CV could represent an appealing biomarker to early identify FWS patients requiring hospitalization.
A second important limitation resided in the fact that the optimal cut-off for RDW-CV (and Ret-He) was determined in a post-hoc manner. Therefore, the current proposed cut-off would require further independent validation in other larger prospective studies. Finally, the fact that our population exclusively included children where reference intervals for RDW-CV and Ret-He are still undetermined, we could not further extrapolate on the relevance of the proposed cut-offs from adult populations. However, this pilot study opens some new perspectives in the research of new but readily automatically available biomarkers to optimize patient management flux presenting to the ER with FWS.
Conclusion
In conclusion, it appears that the RDW-CV is a good independent predictor of the hospitalization duration superior or equal to 24 hours with an optimal PPV of 100%. Moreover, when added to the Lab-score, the RDW-CV was found to increase the prognostic capacity of the Lab-score, one of the best available risk stratification tools in FWS. When above 15.2% RDW-CV has the potential to help the clinician to early identify FWS patients requiring hospitalization, and as such could facilitate patient management flux in the emergency room. On the other hand, none of the biomarker tested was found to outcompete the Lab-score in distinguishing between fevers of purely viral origin from fevers of other etiologies. Those preliminary findings need to be replicated and validated at a larger and multicenter scale before any clinical recommendation can be done.


