Comparison of Tumor Heterogeneity Assessed with Textural Parameters in 68Ga-PSMA PET/CT and 177Lu-PSMA SPECT/CT in Patients with Metastatic Prostate Cancer
Introduction
For different tumor entities it was shown that tumor heterogeneity is an important factor that can provide predictive and prognostic information for the individual patient [1]. Therefore, tumor heterogeneity may be an important step towards personalized oncologic therapy. As biopsy is not always possible tumor heterogeneity will be evaluated by imaging more often. Even in case a biopsy is performed, one tissue sample can be too less for a complete histopathologic workup, especially assessing heterogeneity [1,2]. Medical imaging methods can be helpful as non-invasive tools to specify tumor heterogeneity. Several texture analyses in computed tomography (CT) have shown good results by quantifying the homogeneity using the structure irregularity: Davnall et al. [3] have published several examples of how medical imaging can be used for tumor heterogeneity. Using CT imaging, Ganehan et al. found patient´s survival can be predicted by tumor heterogeneity in non-small-cell lung cancer [4]. Differentiating between tumor and non-tumor tissue is also possible as Lopes et al. have shown [5]. In their study fractal features in magnet resonance (MR) images of prostate cancer patients for assessing tissue heterogeneity have been used to distinguish malignant from benign tissue in the prostate [5].
Positron emission tomography (PET) as functional imaging modality seems to have some benefits for assessment of tumor heterogeneity, especially when applied as hybrid technology as PET/CT. Using PET/CT, not only information about morphology can be obtained but also about visualized functionality as metabolism or receptor density for example. By this it is even easier to get information about prognosis and therapy effects. Tixier et al. described that tumor heterogeneity defined by textural analysis can be a predictive parameter for radiation chemotherapy response [6]. They used intra tumoral tracer uptake in [18F] fluorodeoxyglucose (FDG) PET images of 41 patients with esophageal cancer for their study [6]. In another study tumor heterogeneity assessed in FDG-PET/CT was found to be a strong predictive and prognostic parameter for therapy response and overall survival in patients with colorectal carcinoma [7]. Recently, other radio pharmaceuticals than FDG were found to play an important role in tumor heterogeneity assessed in PET/CT. [18F]-fluoroethyl-L-tyrosine PET was found to differentiate between real progress and pseudo progression in glioblastoma after radio chemotherapy [8]. In a large multicenter evaluation intra tumoral somatostatine receptor heterogeneity was evaluated as prognostic factor for survival after radiopeptid receptor therapy in patients with neuroendocrine tumors [9].
However, to the best of our knowledge, up to now, there is no study investigating the use of single photon emission tomography (SPECT) for assessment of tumor heterogeneity. Especially in patients undergoing radio peptide receptor therapy (PRRT) as in the study by Werner et al. [9] mentioned before patients obtain posttreatment imaging using SPECT technology. As post therapeutic imaging is performed after each cycle of PRRT imaging data would be available faster and at more time points than PET studies in these patients and would therefore be preferable for treatment monitoring if it shows the same predictive and prognostic values. Prostate cancer will strike a large portion of the population as 11.6 % of men will get this diagnose at some point in their life. 9.6% of the newly detected cancers are prostate cancers. The 5-Year relative survival was lifted from 66.0% in 1975 up to 99.3% in 2009 [10]. This big change in survival times can be traced back to the improving screening as well as new treatments options established over the last years. But still there are 26,730 estimated deaths in the US population for 2017 [10]. A recently upcoming treatment in patients with advanced, hormone refractory prostate cancer is radiotherapy with ligands to prostate specific membrane antigen (PSMA) labelled with luthetium-177 [11]. Therefore, the aim of this study was to compare tumor heterogeneity assessed with textural parameters in PET and SPECT images of patients undergoing treatment and prior PET diagnosis with PSMA ligands.
Materials and Methоds
Phantom Study
To simulate a heterogene structure in the phantom, a method first published by Forgacs and colleagues [12] was adapted. Basis for the phantom measurements was a torso phantom according to NEMA NU- 2012 standard with size of 24.1 cm x 30.5 cm x 24.1 cm and a volume of 9.7 liters. Seven 2 ml syringes filled with three different activity concentrations were put together as shown in Figure 1. The syringes were then placed in the torso phantom including background activity (with ratios of 1 to 20, 1 to 15, and 1 to 10 compared to the activity concentration in the syringes). Two settings of these heterogeneity phantoms were used: First it was filled with Gallium-68 in watery solution to simulate the PET/ CT data and the other one was filled with Lutetium-177 in watery solution for the SPECT/CT data. Detailed activity concentrations put in the phantom can be found in Table 1.
Figure 1: Seven 2 ml syringes were put together as shown on the left-hand side to obtain a heterogenic structure as shown on the right-hand side schematically (three different activity concentrations were used to fill the syringes).

Table 1: Activity concentrations that were placed in the syringes and the background for the two different phantom settings. The different activity concentrations have been chosen according to the realistic concentrations to be expected in patient studies.

Patient Population and Treatment
Thirty-seven patients with metastasized prostate cancer were included in this analysis between February 2015 and April 2016. After the decision of the local tumor conference all patients underwent a [177Lu]-PSMA peptide receptor mediated radionuclide therapy (PRRT). According to consensus recommendation of the Deutsche Gesellschaft für Nuklearmedizin there was a PET/CT acquired before the first cycle. Every 8 weeks the patients underwent PRRT. Each time a 68Ga-PSMA PET/CT was done before and a 177LU-PSMA SPECT/CT directly after the cycle. Between PET/CT and SPECT/CT was about one week. The patient’s median age was 71 years (range 43-82 years), the median Gleason Score was 8 (range 6-10). The number of PRRT cycles differed from one to four (1: n37, 2: n24, 3: n6, 4: n1). This variety in cycles depended on the tolerance and the survival of the patients. During each cycle the median administered activity of 177Lu-PSMA was 6,2 GBq (range 4.1-7.1 GBq). The PSA minimum was 5, the maximum 1030 (median: 178). Due to the retrospective character the ethics statement is waived in our institution by the institutional ethics committee. The patient gave written and informed consents for the treatment and the scientific use of the data.
Gallium-68-DKFZ-PSMA-11 PET/CT Imaging
The PET/CT imaging was-done usinga Biograph 2 PET/CT system (Siemens Medical Solutions, Erlangen, Germany). About 40 to 80 minutes after intravenous injection of in -house produced 68GA-HBED-CC PSMA (105 to 200 MBq, mean 134 MBq) a lowdose CT (16mAs, 130 kV) from the base of skull to mid thighs was acquired. The PET scan was acquired over the same area with 3 or 4 minutes per bed position depending on the body weight of the patient. CT data was reconstructed in 512 to 512 matrices with 5 mm slice thickness. PET data was reconstructed in 128 to 128 matrices with 5mm slices thickness. An attenuation-weighted ordered subsets expectation maximization algorithm was utilized for attenuation and scatter corrections as implemented by the manufacturer using 4 iterations and 16 subsets with a 5 mm post reconstruction Gaussian filter. Same imaging and reconstruction parameters have been used for the acquisition of the phantom data as well.
Lu-177-Imaging
SPECT/CTimaging was performed using a Symbia T2 hybrid SPECT/CT tomograph (Siemens Medical Solutions, Erlangen, Germany). One table position needed 10 minutes using an energy window centered plus/minus 15 % around 208 keV. The window center was acquired as SPECT/CT after a planar whole-body image has been done. CT data was reconstructed in 512 to 512 matrices with 5mm slice thickness. SPECT data was reconstructed in 128 to 128 matrices, also with a slice thickness of 5 mm. For SPECT reconstruction the iterative algorithm implemented by the manufacturer was used including attenuation correction based on the CT data using 4 iterations and 16 subsets and as 5 mm post reconstruction Gaussian filter. Due to staff arrangement the PET/CT and the SPECT/CT have been done from different operators. Same imaging and reconstruction parameters have been used for the acquisition of the phantom data as well.
Data Analysis and Statistical Analysis
Both PET/CT and SPECT/CT images were processed with Interview TM Fusion software (Mediso Medical Imaging Systems Ltd., Hungary). In the phantom data as well as in the patient data lesions were delineated manually, if more than 3 lesions were present, the three biggest lesions were chosen. Delineation was performed on the emission image for both the PET/CT and the SPECT/CT. Consequently, in the delineated volume 36 textural features, including deviation, entropy and different emphases were calculated by the software. The conventional parameters as tumor mean, maximum standardized uptake value (SUV max), tumor volume and total lesion glycolysis (TLG) which is the product of tumor volume and mean uptake, were tested as well. Through this, a comparison between the two imaging methods was made. Chicklore et al. have described the textural parameters in detail [13].
For the phantom data the direct comparison of the values was performed presenting absolute and relative differences. In contrast to this, in patient data Bland-Altman Plots were applied which show the comparison between the same parameters in PET/CT and SPECT/CT. In these Bland- Altman Plots the 95% confidence intervals were calculated. Through this approach it could be determined whether there was a direct comparability between PET/CT and SPECT/CT. All statistical analysis was done using IBM SPSS Statistics 24.
Results
Phantom
Using the heterogeneity values for PET/CT and SPECT/CT in the different parameters the absolute and relative difference were calculated. Low differences can be shown for entropy (3.5%), contrast (1.4%) and zone percentage (0.8%). Correlation, size variation and gray level non -uniformity shows values over 18% (18.2%, 18.9% and 18.9%). The most significant results are presented in Table 2. The remaining 20 parameters not mentioned in the table showed differences >20%. A higher heterogeneity was found in PET compared to SPECT.
Patient Population
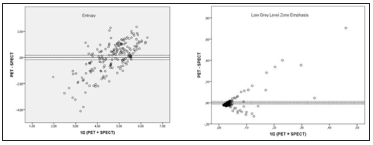
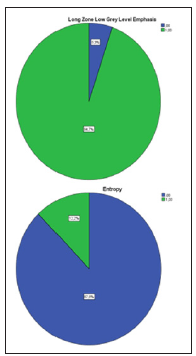
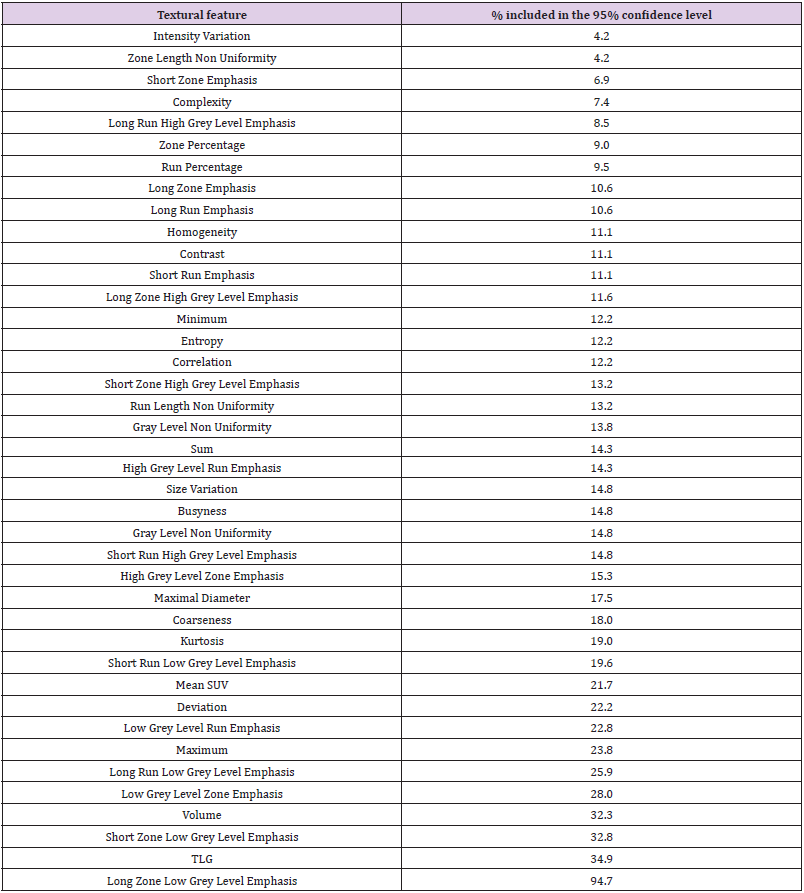
In PET/CT and SPECT/CT images around the first cycle 104 metastases from 37 patients were marked. The mean volume of these metastases was 27.7 ml (range 1.3 to 265.3 ml). In the following cycles the same metastases were identified and delineated if still verifiable. In the second cycle only 65 metastases could be identified, 17 in the third and just 3 in the last one because only one patient of the included patients underwent four treatment cycles. So overall 188 lesions could be detected in four cycles. Using the Bland-Altman Plots and the 95% confidence intervals, it was determined that some parameters had a high consensus (Figures 2 & 3). Long zone low grey level emphasis was the parameter with the highest accordance. 94.7% of the data were contained in the 95% confidence interval. Other parameters with good results were the TLG (34.9%), short zone low grey level emphasis (32.8%) and the volume (32.3%). The conventional parameters as mean and max had lower results. Mean with 21.7% and max with 23.8% in the 95% confidence level. The entropy frequently used in tumor heterogeneity only achieved a low level (12.2%). The lowest results in this study have the zone length non- uniformity and the intensity variation both with only 4.2%. The results of these measurements are presented in Figure 2 and Tables 2 & 3.
Figure 3: Bland-Altman Plots of patient data for Entropy (top) and Low Gray Level Zone Emphasis (bottom).

Discussiоn
In this study, we analyzed whether tumor heterogeneity in PET/CT and SPECT/CT imaging using PSMA-ligands is comparable. The data obtained by phantom studies showed a high correlation (p< 0.01) in some parameters like entropy and contrast. As these parameters have shown prognostic and predictive value in previous studies [3-8], this could be an advantage for individual treatment decisions in the course of therapy after each treatment cycle as SPECT images can be done using the therapeutic activity without additional absorbed dose and cost for the patient. Therefore, this could be used as a prognostic factor equivalent to heterogeneity assessed in PET images. Several other studies (1;4-9) proved that benefit. However, the results of our study with a cohort consisting of 37 patients were different. Big discrepancies between the individual parameters have been found. Even within one category of parameters a large discrepancy was detected in 95% confidence intervals. The long zone low grey level emphasis had 94.7% of the data in contained in the 95% confidence interval, while the short zone low grey level emphasis contained only 32.8%.
This study has some limitations which the reason for may be this discrepancies in the patient cohort. The metastases were delineated manually. It is not clear how big the influence of the interobserver variability to the heterogeneity is. But with this high ranges in 95% confidence levels we assume that little mistakes in marking the lesions would not have changed the results perceptible. Furthermore, the discrepancy between two parameters from the same imaging modality can also not be clarified by mistakes in manually marking the lesions because each parameter is the result of the same measurement. Delineating the lesions both on PET/CT and SPECT/CT images separately, small deviations in the parameters can be produced but these small deviations can not be responsible for non-correlation tumor heterogeneity in our patients. PET/CT images were acquired approximately one week before SPECT/CT images. In the week between the patients received their PRRT. Potential changes in the tumor due to the additional week time and the treatment itself may be the reason for these differences and should be investigated further. The operators for the PET/CT and the SPECT/CT were not the same. Both operators are well instructed with the equipment, so we think this point does not have a big influence on the quality of the pictures.
Our study was performed with a limited number of 37 patients. The significance of the results of such a small group of patients must be considered. Tixier et al. conducted a study [14] with only 16 patients and their results were that textural parameters are reproducible. That should be an incentive to perform other studies with higher patient number to verify how significant the results are. Before our analyses with real patient data we received data obtained by phantoms which had great results with small relative differences as 0.8 % for zone percentage, 1.4 % for contrast and 3.5 % for entropy. It is striking, that parameters such as entropy which have been shown in other studies as the most important textural parameters [6] have such low 95% confidence intervals in our study as entropy with just 12.2%. Variables like this are frequently used in tumor heterogeneity and now have low accordance values in PET/CT and SPECT/CT. Normally they are used in only one imaging method. For the PET/CT we used 68Ga-PSMA and for the SPECT/ CT 177Lu-PSMA. Both are ligands to prostate specific membrane antigen, but both have different pharmacological properties [15]. So, we can assume that one of the two methods is more accurate than the other in marking every tumor cell of the prostate cancer.
Also, it must be mentioned, that PET data is normally acquired between 40 to 80 minutes after injection of the tracer while SPECT data was acquired about 24 hours after the treatment was performed. Not only the PSMA differs in PET/CT and SPECT/CT but also the spatial resolution. The volume of the tumor metastases that were marked and analyzed in this study may vary because of these two differences in PET/CT and SPECT/CT.
Cоnclusiоn
Tumor heterogeneity in PET/CT and SPECT/CT in patients is not correlating in contrast to the data obtained by phantoms. While some parameters, such as the long zone low grey level emphasis have high correlations (94.7%) other parameters as intensity variation have very low results (4.2%). The gap between short zone low grey level emphasis with 32.8% and the long zone low grey level emphasis with 94.7% is remarkable.Therefore, results obtained for textural as prognostic and predictive markers in PET/CT can not be simply transferred to SPECT/CT data. The importance and necessity of studies correlating heterogeneity assessed in SPECT/ CT data with clinical findings is still given.
Diagnosis and Treatment of Acute Appendicitis in the Localization of Vermiform Process in the Cavity of the Female Pelvis-https://biomedres01.blogspot.com/2020/09/diagnosis-and-treatment-of-acute.html
More BJSTR Articles : https://biomedres01.blogspot.com


No comments:
Post a Comment
Note: Only a member of this blog may post a comment.