Early Nano Detection of Liver Toxicity and Injury
Introduction
The exposure to toxic pollutants and its accumulation in the tissues increases the potential risk of health-related issues such as liver toxicity. In addition, many drug metabolites in the liver make it a vulnerable organ for potential toxicity and hepatocyte injury. Though direct exposure of most toxic organs to nanomaterials via the bloodstream is rare unless in medical route, and the liver is one of the most important targets. How to establish an efficient method for early detection of liver toxicity and prevent irreversible damage is the major topic in recent years. The inherent relationship between human liver architecture and its drug-induced injury was emphasized in earlier published literature [1].
Various liver toxicity tests have been proposed based on the latest progress in human microfluidic tissue culture devices [2-5]. Chip-based human liver equivalents are envisaged to identify liver toxic agents regularly undiscovered by current test procedures at industrial throughput. Microfluidic microscale liver equivalents, appraising them against the level of architectural and, consequently, functional identity with their human counterpart in vivo has been well experimented in recent years. The structural and functional integrity of the epithelial layer which forms the protective barrier for skin is vital to prevent exposure and damage from external toxic factors. In recent era, conventional chop-stick electrodes are used to monitor the change of epithelial layer integrity. Once the barrier of the epithelial is compromised, the Trans-Epithelial Electrical Resistance (TER) decreases significantly. TER can change from 3,000 to 500 cm2 in 40 mins for Mature Kidney Epithelial Cells (MDCK) [6-8]. Microfluidic chips are the small platforms comprising channel systems connected to the liquid reservoirs on the chip. The general size of these channels is in the range of a few hundred micrometers to several millimeters. Specific channel design and integrated tools such as electrodes or a specific surface pattern, even of many operational steps, can be incorporated successively together on the same chip. Such miniaturization can expand the capability of existing bioassays. Many microfluidic systems have successfully incorporated various types of cells into chip designs [9-11].
An increased TER of the cells in culture is an indication of cell monolayer health and confluence. MDCK-E cells are most suitable medium for the TER measurement. In recent studies, the TER measurements were made using a Millicell ERS-2 device (Millipore) and chopstick-style electrodes [12-14]. Cytotoxicity assays rely on measuring one or more cytotoxic indicators, including loss of membrane integrity (LDH release) and Metabolic Activity (MTT assay). MTT assay is a common method to evaluate a liver injury caused by hepatic toxins by measuring the metabolic activity of the cells. Plasma membrane damage can be the consequence of various cytotoxic effects. Plasma membrane damage releases LDH into the cell culture media. Extracellular LDH in the media can be quantified by LDH assay. The level of LDH release is indicative of cytotoxicity. MTT assay and LDH release assay in C3A cells are relatively insensitive to human hepatotoxic drugs, which take 48~72 hours and 16~24 hours to detect cells toxicity, respectively [15].
Recent advances in nanotechnology have greatly increased the biological applications of nanomaterials, especially in the field of nanomedicine. Graphene consists of bi-dimensional sheets of carbon atoms arranged in hexagonal rings. Its highly oxidized form was the so-called Graphene Oxide (GO), which was characterized by the presence of oxygen-containing moieties, such as epoxy, hydroxyl, carbonyl and carboxyl groups, on the basal plane and edges of the sheets [16-20] Graphene-based nanomaterials have been used in a range of biological applications, including biosensors because of their preferential interactions with single strand DNA, bioimaging tools because of their intrinsic fluorescence and/ or facile functionalization with fluorophores, carrier of genes for cellular transfection, delivery of small molecules of drugs for cancer treatment, and scaffolds for mammalian cell proliferation and differentiation [21-23].
In this study, we aimed to present the concept of using TER and Light Addressable Potentiometric Sensor (LAPS) technical platform with acetaminophen or graphene as hepatocyte detecting chips to measure liver toxicity.
Materials and Method
Cell Cultures
MDCK-E (canine kidney cells) and C3A (Human Hepatoblastoma) cell lines obtained from Bioresource Collection and Research Center were cultured in Eagle’s Minimum Essential Medium (MEM) supplemented with 10% Fetal Bovine Serum (FBS), 100 units/ml penicillin, and 100 units/ml streptomycin, 0.1mM non-essential amino acids and 1.0 mM sodium pyruvate. Cells were maintained under standard conditions at 37°C in a humidified atmosphere of 5% CO2/95% air in a water jacket CO2 Incubator.
MTT Assay
Thecolorimetric3-(4,5-dimethylthiazol-2-yl)-2,5-diphenyltetrazolium bromide (MTT) test was performed to assess the metabolic activity of the cell. The assay was based on the ability of the Mitochondrial Dehydrogenase (MDH) to convert dissolved MTT to an insoluble purple formazan. This water insoluble formazan was solubilized using either isopropanol or other solvents and the dissolved material was measured absorbance by spectrophotometry. The metabolic activity of the cell can be derived from the color density formed. Briefly, C3A cells were seeded at 96-well plate at density of 10,000 cells /well and cultured for overnight. Subsequently, cells are exposed to increasing concentrations of the toxins for 24h or 48h. Control groups for this study were the cells in media (minus toxin) which were processed identically and incubated simultaneously as the treated groups. In final two hours of incubation, 10% culture volume MTT solution (5 mg/ml in MEM) was added to each well. At the end of the incubation period, the medium was removed, and the converted dye was then solubilized with 100ul solvent (DMSO: isopropanol / 1:1). Absorbance of converted dye was measured at a wavelength of 570 nm with background subtraction at 630–690 nm.
LDH Cytotoxicity Assay
Lactate dehydrogenase (LDH) was a cytosolic enzyme present in many different cell types and gets released into the circulation after plasma membrane damage. Extracellular LDH in the media was quantified by a coupled enzymatic reaction in which a red formazan product was measured at 490nm spectrum. The level of formazan formation was directly proportional to the amount of LDH released into the medium, which was indicative of cytotoxicity. Briefly, C3A cells were seeded at 96-well plate at density 50000 cells/well and cultured for overnight. Subsequently, cells were exposed to increasing concentrations of the toxins for 4~8h, 24h and 48h. Control groups comprised of cells in media (minus toxin) which were processed and incubated simultaneously as the treated groups. In the end of incubation, supernatants were collected for LDH release assay. The LDH released into the medium was transferred to a new plate and mixed with reaction mixture. After an incubation period of 30 minutes at room temperature, the reactions were stopped by adding a stop solution. Absorbance at 490nm and 680nm spectra was measured using a plate-reading spectrophotometer to determine LDH activity.
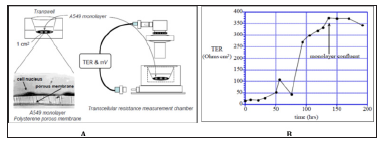
Figure 1: Airway epithelial cells in air-liquid interface and measuring device were shown in A for them physiological properties. TER (Ω.cm2) across a monolayer of human pulmonary A549 cells grown on polyester membrane support was shown in B.
TER
Measurement of cells connection (like tight junction) in cultivation of endothelial or epithelial cells on permeable membrane supports was used. Figure 1 Endothelial and epithelial cells had tightly connection, which formed a flat barrier. TER could measure the electrical resistance of barrier, which was positive-correlative with the barrier integrity and cells mortality. C3A cells (~5×10⁵) were seeded in clear polyester membrane inserts with a diameter of 12mm (Costar) and were grown to confluence. The inserts were monitored each day for confluence and TER measurements were performed using a Millicel-ERS ohm voltmeter (Millipore). In addition, the epithelium expressed both glucocorticoid receptors (GR1 and GR2) and a Mineralocorticoid Receptor (MR), and cortisol treatment significantly increased TER. Hydrocortisone was given for elevating TER.
LAPS
Laser to induce PV-V and detect the hydrogen ion (PH) changing on the surface of sensitive inductor was used, which could give a quick and real-time monitor for the multiple walls in the same time, and there was a sterile space without contamination, make process of early cell toxicity detection realizable. We used MDCK-E cell combined with hepatocyte for a TER assay. One of the cell lines used to study hepatotoxicity in vitro was C3A, which was a subclone of human hepatocellular carcinoma HepG2. Acetaminophen was the hepatotoxic drug used as test compound because it was a well-known hepatotoxic drug. The MTT cell viability test and LDH cytotoxicity assay was also taken in the experiment to make sure if our methods really take less time in detection of cell toxicity. By above tests, we could develop a platform to detect early toxicity of hepatocyte. The second toxin was graphene nanoplatelets, which have been used in a range of biological applications, including biosensors, bioimaging, drug delivery, and nanomedicine.
Results
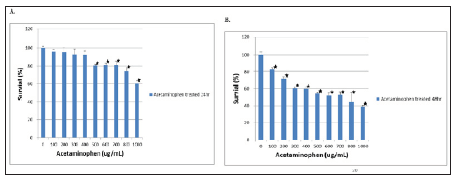
The viability of the C3A cell exposed to acetaminophen was evaluated using the MTT assay. The C3A cells treated for 24 hours and 48 hours with acetaminophen at high concentrations showed significantly lowered viability. Figure 2 we did not observe any significant differences in viability after 24 hours of exposure to acetaminophen at lower concentrations (< 400 ug/ml) as the Figure 2a. After 48 hours of exposure to acetaminophen, we observed that the cells appeared to be decreased viability in a dosedependent manner. Specifically, the cells treated with 500ug/ml acetaminophen loss about 45% of viability and the cells exposed to 1,000 ug/ml acetaminophen loss about 60% of viability Figure 2b.
Figure 2: MTT assay - The viability of C3A cells incubated with different concentrations of acetaminophen, from 100 ug/ml to 1,000 ug/ml were treated for 24 hours (A) and 48 hours (B), : p < 0.05 vs no addition of acetaminophen.
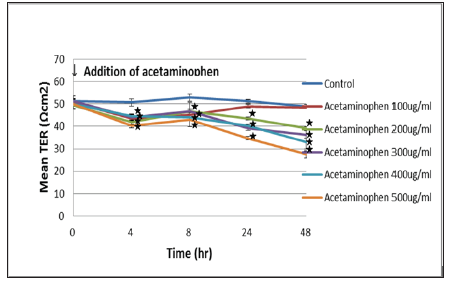
Quantification of the cellular cytotoxicity was done by measuring extracellular LDH activity. After 4 to 8 hours of exposure with the acetaminophen, no LDH leakage could be observed in C3A cells culture even at concentrations as high as 1,000 ug/ml. Figure 3 after a 24 hours of exposure, we observed that the higher concentrations of acetaminophen (> 600 ug/mL) significantly increased LDH release which is indicative of the cytotoxicity. The decrease in TER correlated with acetaminophen concentration after 4 hours of exposure proved the positive correlation between TER measurement and cells toxicity in a very short time (Figure 4). In principal TER has been shown to correlate with a multitude of cellular features, such as intercellular connectivity and cell morphology. In this study, we evaluated that TER could be used to draw the conclusions on mortality and cytotoxicity of hepatocytes.
Figure 3: Determination of LDH cytotoxicity of acetaminophen in C3A cells was shown in C3A cells were incubated with different concentrations of acetaminophen treatment for 4, 8 and 24 hours. LDH cytotoxicity was measured using the Pierce LDH Cytotoxicity Assay Kit. The LDH cytotoxicity significantly elevated when acetaminophen concentration increased to 600 ug/ml and treated for 24 hours : p < 0.05 vs no addition of acetaminophen.
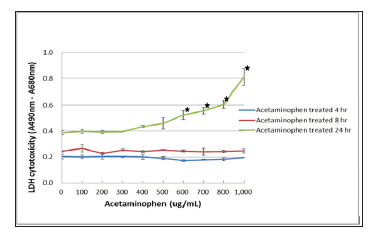
Figure 4: Effect of acetaminophen on the TER value of the C3A cells was shown. C3A cells were seeded in clear polyester membrane inserts and exposed to increasing concentrations of acetaminophen. TER measurements were performed using a Millicel-ERS ohm voltmeter (Millipore). The TER values significantly decreased after 4 hours of addition. : p < 0.05 vs initial addition of acetaminophen.
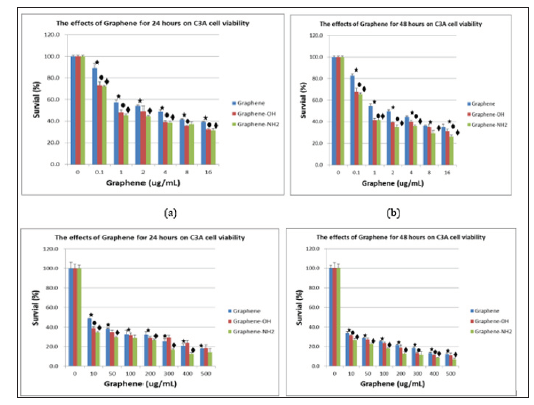
The cytotoxicity of two derivatives of graphene, graphene-OH and graphene- NH2 was compared in human hepatoma C3A cells (Figure 5). The MTT assay was used to measure the metabolic activity of the cells. Exposure of C3A cells to graphene, graphene- OH and graphene- NH2 for 24 hours resulted in a dose-dependent decrease in absorbance values that indicated a reduced metabolic activity of these cells. At a concentration of 0.1 ug/ml, the cells lost 11%, 27%, and 28% of viability over 24 hours of treatment, and 18%, 35%, and 37% of viability for next 48 hours of treatment (Figure 5a & 5b). At a higher concentration of 10 ug/ml, the sequential cell viability loss was 55%, 62%, and 66% for initial 24 hours of treatment, and 65%, 70% and 75% of viability loss for next 48 hours of treatment (Figure 5c & 5d). The MTT assay results indicated that the order of cytotoxicity was graphene < graphene -OH < graphene- NH2.
Figure 5: MTT assay - The viability of C3A cells incubated with different concentrations of graphene nanoplatelets. A (treated 24 hours) and B (treated 48 hours) were low concentration (0.1~16 < ug/ml), while C (treated 24 hours) and D (treated 48 hours) were high concentrations (10~500 ug/ml). : p < 0.05 vs no addition of graphene, and : p < 0.05 vs graphene of different concentration.
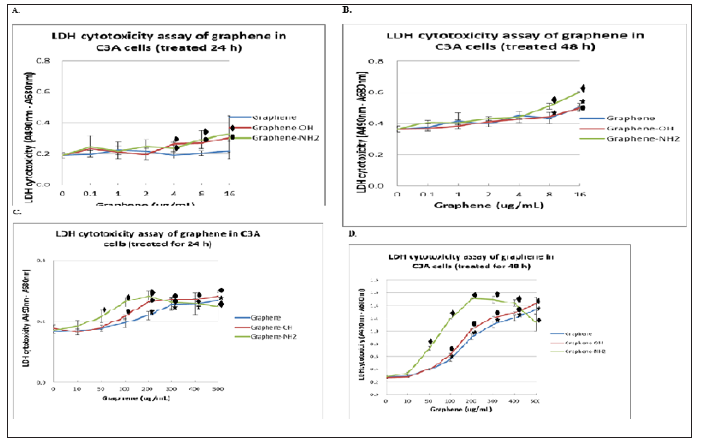
The LDH assay was used for evaluated cellular cytotoxicity by measuring cell membrane integrity. The LDH assay results indicated that the three graphene nanoplatelets caused dose- and time-dependent cytotoxicity in C3A cells with plasma membrane damage. Figure 6 after a 6 hours of exposure, we observed that the concentrations ≥ 50 ug/ml of graphene- NH2 and ≥ 100 ug/ ml of graphene and graphene-OH significantly increased LDH release. The order of cytotoxicity was graphene < graphene -OH < graphene- NH2 based on the LDH assay result. The three graphene nanoplatelets caused an increase in LDH leakage only at the higher exposure concentration (≥ 50 μg/ml) treated for 48 hours (Figure 6D). Therefore, the LDH assay might not be the most appropriate one to assess the cytotoxicity of graphene nanomaterials.
Figure 6: Determination of LDH cytotoxicity of grapheme nanoplatelets in C3A cells was shown. C3A cells were incubated with different concentrations of grapheme nanoplatelets. LDH cytotoxicity was measured using the Pierce LDH Cytotoxicity Assay Kit. A (treated 24 hours) and B (treated 48 hours) were low concentration (0.1~16 < ug/ml), while C (treated 6 hours) and D (treated 24 hours) were high concentrations (10~500 ug/ml). : p < 0.05 vs 2ug/ml of graphene in A and B, and 10 ug/ml in D. and : p < 0.05 vs graphene of different concentration.
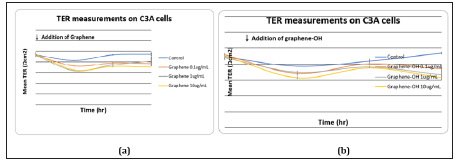
The effect of graphene nanoplatelets on the TER value of the C3A cell monolayer is shown in (Figure 7). Although the LDH release induced by graphene nanoplatelets at 10ug/ml was not distinctive, the TER value of the C3A cell monolayer was significantly decreased by incubating with this concentration of graphene nanoplatelets. After 6 hours of exposure, the TER reduction was apparent. Incubating with only 0.1ug/ml graphene nanoplatelets also caused the TER value to decrease.
Figure 7: Effect of graphene nanoplatelets on the TER value of the C3A cells was shown. C3A cells were seeded in clear polyester membrane inserts and exposed to different concentrations of graphene nanoplatelets.TER measurements were performed using a Millicel-ERS ohmvoltmeter (Millipore).(A) graphene (B) graphene-OH (C) graphene-NH2. , , and : p < 0.05 vs control
Discussion
The advancement of technologies in biomedical research for toxicology, and particularly in in-vitro experimental models, has increased the possibilities of applications of such advances in diagnosis more complex disease processes. New mechanistically based methods could be established from all these approaches, which, once validated, can be applied to clinical practice [23- 25]. TER is a widely accepted quantitative technique to measure the integrity of tight junction dynamics in cell culture models of endothelial and epithelial monolayers. Their values are strong indicators of the integrity of the cellular barriers before they are evaluated for transport of drugs or chemicals. TER measurements can be performed in real-time without cell damage and generally are based on measuring ohmic resistance or measuring impedance across a wide spectrum of frequencies [26].
Nanoparticles have been shown to translocate to the blood stream following inhalation and ingestion, and the liver is an important organ to accumulate [27,28] Graphene represents a valuable platform for the development of nanocomposites, allowing the combination of nanomaterials with different properties to give novel materials with improved or new functionalities. Specifically, GO is an important platform for the attachment of silver nanoparticles. The high surface area of GO sheets serves as a support for growth and stabilization of nanoparticles, which prevents them from aggregating. These silver-based nanocomposites have excellent antimicrobial properties, they represent an alternative to the inefficacies of long-used antibiotics.
Our previous results as in (Figure 1) showed that monolayer confluent MDCK-E cell culture achieved the highest TER up to 3,750 Ωcm2 on day 6, and TER was positive-correlated with culture time during day 1to day 6. It can be a reference for liver cell culture and TER measurement. In the C3A cells culture results, the TER showed nearly 30 Ωcm2, which was almost one-hundredth of MDCK-E cell, may be easily interfered by noise. And there were no related between TER and culture time. The results showed that C3A cell could not be a well measurement by TER, which could blame it on C3A cell did not grow well and form a loose membrane. Without tightly connecting between cells, TER decreased to a lower status. This phenomenon also had been observed by microscope. Then we tried to add acetaminophen for toxicity test. C3A cultured with different concentration acetaminophen was given on day 5, and result showed no significant change, unless giving higher dose of acetaminophen. In low dose of acetaminophen, TER decreased in a tiny and irregular way. As the result of addition of acetaminophen, TER could not perfect expressing the toxicity of C3A cells, which might due to the same problem that lose membrane could not be measured by TER correctly. How to culture liver cell and elevate TER should be the first priority to be resolved.
To increase TER in C3A cell culture, hydrocortisone was given. Compared with experiment group (hydrocortisone) and control group (non-hydrocortisone), C3A cell cultured with hydrocortisone presented a higher TER than before, nearly double time of control group. And in the toxicity experiment, acetaminophen added in C3A cell with hydrocortisone showed that higher TER decreasing rate correlated with culture time, which made TER measurement become more meaningful than toxicity experiment without hydrocortisone. Although TER measurement could detect C3A cells toxicity, the major part of toxicity measurement in the experiment was about shorter detecting time. Theoretically, TER measurement should have powerful ability to detect toxicity in a short time after toxin added. We managed an experiment to identify that. C3A cells were exposed to increasing concentrations of the toxins, and checked TER on 4 hours, 8 hours, and 24 hours after toxin adding. The result showed that TER decrease significantly with different dose of toxins on 4 hours and 24 hours. On 8 hours, the decreasing of TER seen to be more irregular, which might due to TER was too small to be detected, or the cell toxicity was overwhelming.
To assure TER measurement is faster than LDH cytotoxicity assay, which is the most quickly liver toxicity measurement in recent years. We tried to perform LDH cytotoxicity assay in C3A cells and checked LDH release on 4~8 hours and 24 hours after toxins adding. The result showed that on 4 hours there was no elevation of LDH release. On 24 hours, LDH release elevated significantly and proportional to concentration of toxins. It proved that LDH cytotoxicity assay can detect toxicity less than 24 hours but more than 4 hours, just like the previous papers presented. We have proven that TER measurement has faster detection of cell toxicity, yet we still couldn’t culture liver cell to form a high TER layer just like MDCK cell dose. Mixture of different cell types to make a compensation of primary culture hepatocyte and liver cell lines provided with tumor characteristic will be the future step.

No comments:
Post a Comment
Note: Only a member of this blog may post a comment.