Method for Selection of Laboratories in Need of Infrastructure Improvement to Meet HIV Viral Load and Early Infant Diagnosis Unmet Testing Needs in Kenya
Introduction
Capabilities of medical laboratories in sub-Saharan Africa vary depending on the country, development partners and location [1]. Common variables considered in ranking laboratory systems in this region are: laboratory infrastructure, laboratory equipment, supplies management system, access to utilities and implementation of quality management system [2,3]. Investment to support HIV, TB and malaria diagnosis have been geared towards improving quality management systems in service delivery rather than addressing infrastructural needs urgently required by these facilities, resulting in non-holistic response to priority diseases [4]. Kenya governance structures have devolved healthcare to the county governments which are yet to establish economic investment models for funding laboratory infrastructure [5]. The most missed variable in laboratory system investment is usually infrastructure. Allocating funds towards laboratory infrastructure upgrades are thus a challenge for laboratories to attain ISO 15189 accreditation in order to support key laboratory programs such as HIV and TB [6-9].
In order to overcome the challenges and delivery of efficient specialized diagnostic services in support of priority disease (HIV, TB and Malaria), Kenya has adopted the use of selected public health and research laboratories. Due to this, a significant success in terms of VL/EID coverage has been noted [10-12]. This can be attributed to laboratory implementing partners. Despite these improvements, VL/EID test access in remote locations in Kenya is still restricted due to high costs, complex specimen collection and transport requirements, need for well-established laboratory infrastructure and well-trained personnel [13,14]. In June 2013, World Health Organization (WHO) recommended routine viral load monitoring as the preferred strategy for the diagnosis and confirmation of antiretroviral therapy (ART) treatment failure (WHO 2013) [8,9,15-17]. This increased workload has resulted in long laboratory turnaround times with median values across the testing laboratories ranging from 12 days to 32 days [13]. Delayed detection of treatment failure and late HIV-1 infant diagnosis leads to accumulation of HIV drug resistance and costly switches to second-line ART [14].
To support the viral load and EID scale-up plan, laboratory renovation was proposed through a consultative approach involving all the key stakeholders. It stems from the Kenyan VL/EID laboratory strategic plan that provides a detailed description of the seven pillars namely:
a) Policy guidance, leadership and management of viral Load and EID services,
b) product selection,
c) Site selection and laboratory capacity building mechanism,
d) Forecasting and financing requirements for VL/EID scale up,
e) Optimal specimen referral networks through mapping, human resource requirements and resources for their retention,
f) Advocacy and education targeting health care providers and patients, and lastly
g) Monitoring and evaluation.
In order to achieve these plans, Kenya Ministry of Health, with support from the Global Fund designed to fight HIV/AIDS, TB and Malaria made an investment to improve laboratory systems in Kenya. The goal was to optimize access to specialized laboratory services, uptake and coverage in HIV, TB and Malaria diagnosis, care and treatment monitoring. No prior assessment had been done to evaluate the actual laboratory infrastructure needs required to support the national EID and VL scale-up plan. This exercise was thus aimed at assessing laboratory physical infrastructure, obtaining architectural designs and bill of quantities to inform proposed renovation and upgrades of county laboratory buildings to meet molecular testing requirements (HIV viral load and early infant diagnosis) for level-2 specialized laboratories. In this methodology study we evaluated a selection method for the best possible way to select and earmark laboratories for upgrades that would fit within the available budget while maximizing the gains on HIV viral load and EID unmet testing needs.
Methods
National Public Health Laboratories Services (NPHLS) - Ministry of Health (MOH) in collaboration with African Medical and Research Foundation (AMREF) Health Africa in Kenya developed a model to select 20 medical laboratories using DHIS database. The model was based on weighted averages, where (50%, 40% and 10% of the weight being awarded to workload, unmet needs and test turnaround time. The 20 facilities were picked from a sample pool of 7654 facilities that tested both EID, and VL. One facility in Trans-Nzoia county; Endebes Sub-County Hospital was deselected as it did not meet the requirement of being level 4 facility or above. Detailed assessment based on key indicators, architectural designs and bills of quantities for renovation of the 19 pre-selected facilities earmarked under this grant were then obtained through involvement of the county health management teams (CHMTs) and their respective ministry of works officials. The laboratory infrastructure indicator checklist captured the current state of infrastructure, HIV prevalence of the capture population, ISO 15189 accreditation status, accessibility of the facility by neighboring facilities, capacity in terms of personnel numbers and levels of training among others.
State of the laboratory infrastructure were captured with data elements such as laboratory section separations, building security, laboratory chemical, reagent and consumable safety, walls, windows, floors, lighting, sinks, laboratory furniture, biosafety cabinet, emergency eyewashes and showers, fire and electrical safety. These indicators selected are mainly predictors to quality testing, HIV and TB testing needs, equity and infrastructure gaps. Facilities assessed included the following county referral hospitals; Migori, Kisii, Homa-bay, Kisumu, Siaya, Kakamega, Bungoma, Kericho, NakuruLodwar, Moyale, Kapsabet (Nandi) county referral hospitals. Others were Meru level 5 Hospital, Mbagathi District hospital, Mbita sub-county hospital, Endebes sub-county referral, and Coast Provincial General Hospital. Once the questionnaires were filled out, they were securely stored in a safe cupboard until retrieval for analysis. The data was entered into an SPSS database.
Data Analysis
We adopted a mixed method approach where both quantitative data and qualitative data were analyzed with the initial nested in the latter. This allowed for full utilization of data and enabled the capture of the status of the facilities selected. In the qualitative data we adopted framework analysis for the key informant’s responses. One key advantage with this framework analysis is that although it uses a thematic approach, it allows themes to develop both from the assessment questionnaire and from the narratives of various key informants (laboratory in-charges).
Questionnaires were open ended to allow generation of rich data from the interviews. The interviewee responses were then matched to the scoring system of the laboratory needs on the grading section of the questionnaire. Major themes began to emerge during this process leading to the identification of a thematic framework. This was done manually by writing memos in the margin of the text in the form of short phrases, ideas or concepts arising from the texts.
At this stage descriptive statements were formed, and an analysis carried out on the data under the questioning route. The third stage, indexing, comprised sorting the data, highlighting and sorting out quotes and making comparisons both within and between cases. The fourth stage, charting, involved grouping the laboratories into various segments for each specific indicator so as to give a clear picture of the laboratory selected for infrastructure renovation. The scoring questionnaire had ranked laboratory renovation needs such as floor, roof, safety equipment, walls, and partitions, electrical and mechanical needs on a Likert scale of 1-5. This process allowed conversion of qualitative data into quantitative format. Once all the data was on quantitative format, we used PCA method to provide weights to the key indicators by applying factor analysis for each indicator and then clustering the laboratories based on summation weights attained by each. PCA is a multivariate statistical technique used to reduce the number of variables in a data set into a smaller number of dimensions. In mathematical terms, from an initial set of n correlated variables, PCA creates uncorrelated indices or components, where each component is a linear weighted combination of the initial variables. For example, from a set of variables X1 through to Xn for each of the indicators

Where;
Amn represents the weight for the mth principal component and the nth variable and pcm is the weighted combination of the variables general index. Ranking was applied to cluster the laboratories into five clusters.
Results
Characteristics of Health Facilities
Nineteen facilities were selected for assessment on their renovation needs to bridge the infrastructure gap necessary for them to start performing molecular testing. Most facilities had standard sections of Serology, phlebotomy, patient waiting bay, microbiology, hematology and CD4 sections. Only one facility, Coast General Hospital, was already performing molecular testing. Space allocations for most laboratory sections were considered inadequate. 12 facilities had insufficient space to perform the current laboratory work, five had standard space with two undergoing complete overhauls. None of the facility apart from CPGH had an excess room that could be taken to support molecular testing thus for most of the facilities. Expansion of the current structure was thus necessary to accommodate molecular testing.
Selected laboratories had adequate technical staff for the current work they are supporting. The level of education for the staff in these facilities can be summarized as follows, 6% MSc, 44% BSc, 47 ordinary diploma and 3% of non-skilled staff. None of the laboratories selected had cracked walls. The paint works, and the window space was adequate. Three of the facilities required window repair. None had the required chorion floor type recommended for laboratory space. Access control for the laboratory space was not electronic however they have physical control in terms of door. In terms of safety all the laboratories had emergency exits and safety plans. The doors are in good condition, while 8 facilities visited will need renovation on the floor, and an additional three will need repair on the roof.
Facilities visited had fully functional drainage systems in place. The only missing link to the drainage system was the dilution traps that only one facility, Kisumu district hospital. There were no leaking pipes or uncovered manholes. All facilities had stable supply of water apart from Bubisa. In terms of sewerage system, they had a proper system, apart from Kakamega PGH which requires renovation in its sewerage system. Nine out of nineteen facilities visited had sufficient number of laboratory sinks for usage. The remaining ten had a gap of one to three sink places that need to be renovated to ensure that all the designated places had sinks. Materials used for sink construction were mainly stainless steel. The sink had the adequate height to ensure there is no splash. None of the laboratory sinks had the recommended elbow tap. Five facilities had their water closet blocked.
Classification of Health Facilities in Clustered Quintiles
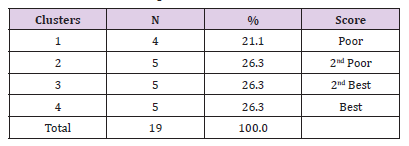
Table 1 A total of 19 health facilities were assessed using 29 indicators. Using the factor weights generated from PCA models the facilities were grouped into four groups (clusters) where the first cluster represented the poorest performing health facilities and cluster four were the best performing facilities. Four facilities (21.1%) were in cluster 1, the poorest performing while five facilities (26.3%) were in cluster 5 the best performing. Based on factor weights the poorest performing facilities were given priority in selection.
Ranking of Indicators Baseline Stage
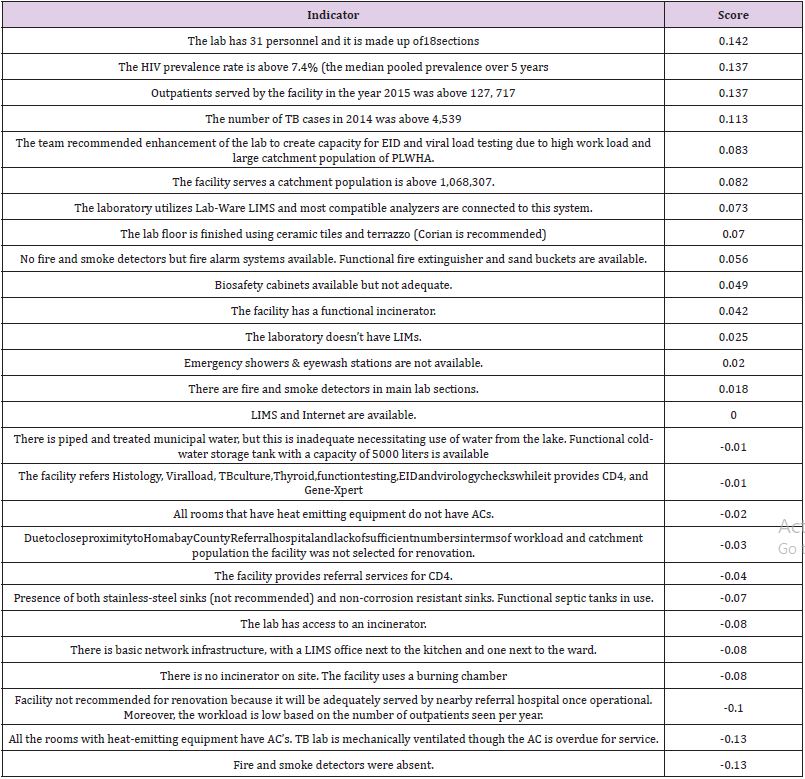
Table 2 A total of 27 indicators were evaluated and factor weights generated. Where the lab indicated having 31 personnel and it made up of 18 sections, it scored 0.142, having HIV prevalence above the median pooled prevalence of 7.4% scored 0.137, which is second weighted indicator. The third best weighted indicator those facilities with outpatients above the median pooled value (n=127,717). The fourth best ranked indicator was a facility has TB cases above the median value of 4,539 in 2014. These indicators increased the probability of a facility being ranking first or last for purposes of upgrading. The results further showed that if a facility was without a fire and smoke detectors, it had the least chance of being ranked best with a negative factor weight of -0.31, like if “all the rooms with heat-emitting equipment have AC’s. TB lab is mechanically ventilated though the AC is overdue for service” (-0.13). A facility already served a Kitale county and has a low work load scored a factor weight of -0.10. In total 13 indicators have negative factor weights and 14 had positive contribution of ranking the first top.
Ranking of Facilities Using Factor Weights and Clusters
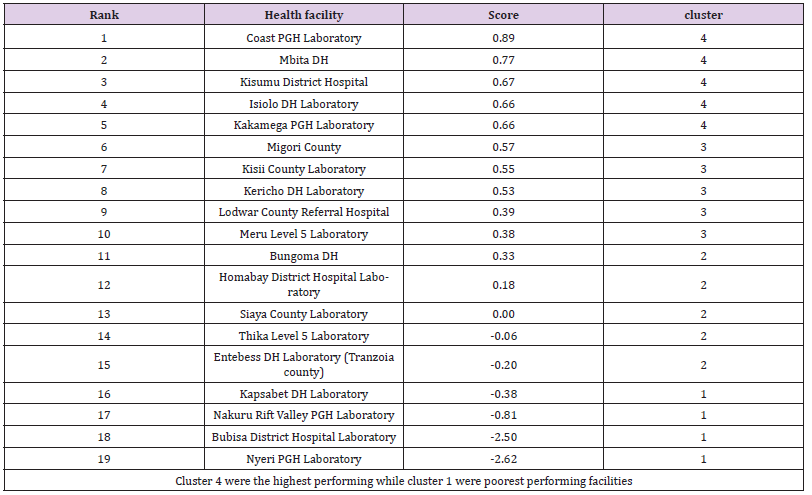
Table 3 All facilities in cluster one and three were selected with exception of Endebes which did not comply with inclusion criteria for renovation. Three facilities from each of the remaining clusters were selected for further analysis. From cluster two we selected two facilities (Table 3). The best performing facilities had positive factor scores and the poorest performing ones had negative scores. In order to determine the selection criteria for laboratories to benefit from this investment and aid decentralization processes to mitigate the unmet needs for HIV viral load testing, data from the viral load database was used.
Discussion
The selection model yielded four clusters. The first cluster had facilities with overall low infrastructural gaps, lowest HIV, TB and malaria testing needs and a less expansive geographical representation while cluster four had facilities with the highest infrastructural gaps, highest HIV, TB and Malaria testing needs and the most expansive geographical representation compared to the other regions. For selection purposes, equity was applied to ensure that the selected laboratories had the national representation and can support decentralization of EID and VL testing services to strengthen the current existing sample referral network. Principal Component Analysis and factor analysis (FA) are supported by many statistical packages [18,19]. Both methods use EVD (eigenvalue decomposition), with some differences in factoring. The model has no underlying model for interpreting the “factors” [19-21]. In addition, it does not account for errors during measurements or surveys, and thus if the correlation matrix is used, it places all the variables on one diagonal unlike FA, which places the communalities on the diagonal [20-22]. In this work we refer to the spectral decomposition of a matrix as eigenvalue decomposition (EVD). Most variables were square symmetric matrices thus there was no need to use singular value decomposition (SVD) as both the right and left vectors from the SVD were identical and singular values were equal to the square root of EVD generated eigenvalues.
Similarly, to other socio-economic work, we considered multiple criteria for choosing modes (eigenvectors) to use in laboratory selection using PCA [23-25]. We did not factor in any underlying model thus “interpretability” criterion does not apply [24-26]. In laboratory selection likewise to any socio- economic criterion ranking, we found that one often over-estimate the essential subspace if trying to factor a specific amount of variance, say 50 %, and thus it doesn’t work well [20,24,26]. Cattell criterion applied by constructing the eigenvalue scree plot and identifying the ‘kink’ tends to work best [20,24]. Unlike with FA, there was no harm in doing this subjectively per each variable [27,28]. We thus propose that this approach can be combined with subspace analysis to identify the saturation point for the RMSIP plots, as this is a good indicator of the essential subspace that is invariant to the “noise” in the data.
The trimming down of facilities from 20 to 15 indicate that PCA can actually be used to guide the current in country investments on multi-disease diagnostic platform and scale-up of multi-disease near POC platforms to overcome multiple market entry barriers that stem from a lack of understanding of the market potential, forecasting, level of investment and resources, regulatory requirements, post market support, data connectivity, balance on where to place them without disrupting the conventional centralized testing, and supply chain limitations. This study therefore provides the most optimum methodology for use in multi- disease testing placement and use, their economic value and budget impact. It can provide the required optimum balance for improving the conventional current centralized laboratory testing network.
Conclusion
Principal Component Analysis is a quantitative method which can be used to reduce many indicators to a sing score which can then be used to identify and rank facilities in priority order for renovations.
Fiberoptic Bronchoscopic Removal of Dental Crown Dropped in Bronchus During Dental Treatment-https://biomedres01.blogspot.com/2020/09/fiberoptic-bronchoscopic-removal-of.html
More BJSTR Articles : https://biomedres01.blogspot.com


No comments:
Post a Comment
Note: Only a member of this blog may post a comment.