Physical Activity and Academic Performance among Adolescents – An impact study using Active Science Mobile Application
Introduction
United States Childhood Obesity
Childhood obesity is significant problem in the United States. Since 1960, the rate of obesity and overweight has tripled and effects 33% of our children and youth [1]. It is currently affecting approximately 12.7 million youth aged 2-19 years of age [1]. Although we have made positive steps at reducing childhood obesity; it still remains a fairly stable prevalence of 17% of obese children. Obesity has been linked to early mortality, hypertension, dyslipidemia, type 2 diabetes, coronary heart disease, stroke, sleep apnea and breathing problems, some cancers, Low quality of life, mental illness such as clinical depression, anxiety, and other mental disorders [1]. The cost of obesity among adults and children in the United States was estimated to be nearly 210 billion dollars in medical care [2]. It is important that we find ways to prevent childhood obesity and decrease their risk of other complication. A major modifiable behavior that is associated with obesity is physical activity (Huffman FG et al. [3]). It has been found that physical activity improves brain structure, brain function, cognition, and school achievement.
Also, it improves bone health, decrease levels of body fat, improve cognitive skills, and improves the ability to concentrate and pay attention among youths (Healthy people). Children (ages between 10 to 19 years) who engaged in MVPA for 60 mins each day for 5 days per week was only 8% [4]. This gets even lower when children get older. So, it is paramount to find alternate ways to increase and sustain physical activity level to decrease the likelihood of chronic disease and obesity. Schools are the ideal place to improve children’s physical activity as they spend 6-7 hours a day for approximately 180 days per year at school (DHHS, 2012) and some of these hours could be utilized for physical education that will increase students’ physical activity which in turn will increase academic performance. A well-executed physical education program has been shown to help increase cognitive levels. A 2year study of a physical activity in California of 759 children demonstrated improved academic performance when additional time (more than 30 minutes of physical activity per week) was allocated for physical education program [5]. Another study shows that increasing the number and intensity of physical education sessions has a positive effect on both cognitive performance and academic achievement [6]. From these studies, it is clear that physical education is one of the methods to improve physical activity which eventually enhances academic performance and decreases the childhood obesity and its associated consequences among adolescents.
Utilizing Mobile Apps
For a physical education educator, it is difficult to find methods that consistently engage and motivate students to meet the recommended amount of daily physical activity and MVPA [7]. Utilizing technology to promote physical activity could be in effective way to improve academic performance and participation within physical education. Students spend on average 2.3 hours each day during the week and 4.3 hours on the weekends utilizing some form of multimedia. This includes watching TV, playing video and computer games, surfing the Internet, listening to or playing music, and using cell phones to call or text friends and others (Department of Elementary and Secondary Education DESE, 2011). This lends several areas for examining potential intervention to increase physical activity level within physical education. In 2012 an intervention was implemented in Texas that collaborated with schools and physical education educators from the state to develop easy and effective curriculum that could be utilized through a mobile app. The mobile app was called Choose Healthier. What they found at the end of the study is that the Choose Healthier mobile app helped get 90,000 students to move in Texas. They also found that more than 4,000 educators have used the app in more than 1,500 schools and organizations [7]. This study shows that there is effectiveness to utilizing mobile apps to improve physical activity not only within the school but state wide. Although the study did not demonstrate a correlation between physical activity and academic performance it did show promise on other venues that can be explored to connect the two.
In 2014 a new program in Massachusetts was developed with the intention of increasing physical activity and academic performance through the use of a mobile application. Active Science is an interactive mobile app that blends technologies, such as activity monitors and tablet to improve learning [8]. They conducted a study involving five different YMCAs After School Programs and Active Science and what they demonstrated was that Active Science effectively improved MVPA and increased science skills [8]. Some of the limitation of the study could be that the study was conducted for a shorter period and was not performed through a full school year [9-12]. This study gives insight on the effectiveness of a mobile app towards physical activity and academic performance and offers some potential on the implementation of this mobile app in a school based physical education program.
Purpose of Study
The data reveals that childhood obesity has been directly linked to chronic disease and it remains significantly prevalent in the United States. What we know is that physical activity is an immediate and cost-effective method to reducing childhood obesity. This is why we have to find ways to incorporate physical activity in the environment and physical education program is an ideal place to start. Utilizing Physical education program to harness a space so students can become more physically active is of importance but the value of physical education has not been strong enough to convince policy makers to make physical education mandatory in the United States. There is limited evidence to demonstrate that physical education can significantly improve academic performance, this is why we need find more innovative methods to improve academic performance within a physical education program. In this study we are going to use a mobile app (Active Science) to see if utilizing a mobile app can both further improve academic performance while improving physical activity in a physical education program. We hypothesis that mobile app will have a positive effect of on both physical activity levels and academic performance.
Methods
Participants
Participants have been recruited from Lawrence Public Schools (LPS) in Lawrence, Massachusetts. In 2017 LPS had 13,852 students enrolled in which 92.2% of the students were Hispanics (DESE, 2017). Median household income in Lawrence is $34,852 and 28.4 % of the populations fall below the poverty line (Data source, 2017). We have performed a convenience sampling from Spark Academy middle school that is within LPS. Although it is a convenience sample the percentage of Hispanic (92.1%) at Spark Academy is consistent with LPS. There are two separate 6th grade groups that were assembled before the beginning of the 2017-18 school year and these are the participants that will be participating in the research. All parents of the participants received a No Opt out consent form two weeks prior to the commencement of the program that detailed the purpose of study, benefits of program, and duration of the intervention of the study. The consent forms have been sent in Spanish and English due to the high number of bilingual participants (Spanish). No students returned consent form with a signature stating that they will not elect to participate in the program.
Measures
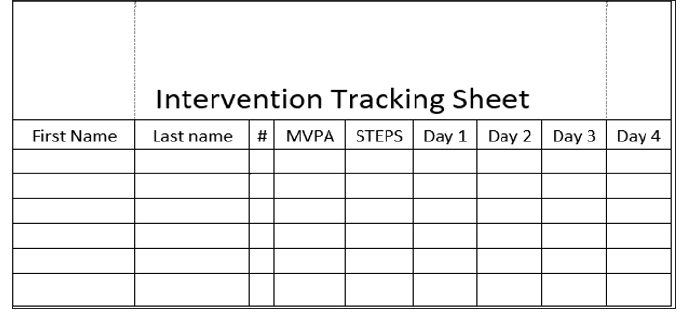
Baseline data and interventional data were measured. Data has been collected with Ekho MVPA Accelerometers and we collected total Steps and MVPA. Intervention tracking sheet has been used to gather 3 days of baseline steps and MVPA (Figure 1). Kindle 7 tablets were used for the Active Science application. The Active Science application will measure beginning perception and attitude of science and baseline science knowledge. Pretest was given on hard copy with preselected Active Science pretest questions. This allowed us to tailor the questions with the mission that participants will be participating in.
Procedures
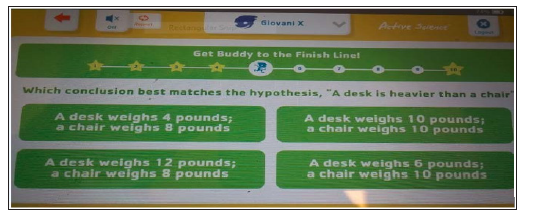
There are approximately 54 participants (30 males, 24 females) that are 10-13 years of age that could participate in the study. The study will be conducted in the schools “fitness room”, a separate room where students participate in PE, and will run within the normal PE period. On Tuesdays and Fridays from 10:55-11:35 the first group of participants will begin. Prior to collection of baseline data participants will be educated on proper use of Ahko accelerometer and proper use of tablets (Figures 2 & 3). This includes how to use both accelerometer and tablets and where to place accelerometer when they transition out of PE class. Accelerometers and accelerometer case will be coded with a number from 1-25 for 2 reasons:
a) Maintain privacy of participants when collecting data and
b) Allow participants clear designated area on returning accelerometers. Once participants have been educated they will begin study.
The first two weeks of data collection participants will walk into normal PE class and will wear accelerometers. At the end of PE class participants stretched and PE instructor collected both MVPA and steps. After the 2 weeks of collecting data and 3 weeks of AS intervention participants will take posttest (Figure 4). During the study all participants can elect to not participate and they will participate in the normal physical education program.
Participants will begin by putting on their accelerometer and meeting in the middle of the class for a 3 minute whole group work out. They will then partner up and begin their circuit workout. This includes various child modified work out machines. After the participants finish their partner work they will transition to the cycling bikes were they will cycle up until 13 minutes. After the 13 minutes students will have the option of continuing with their exercise or use other modalities to exercise such as jump-ropes, bosu-balls, or modified medicine balls. During this time students will be utilizing the tablets to perform Active Science. After 7 minutes students will perform a whole group cool down and then transition to open gym (a open time to connect with other classes in the gymnasium). On the way out to the gym I will collect accelerometers. An Incentive program was utilized for student participation to aide in increasing physical activity levels. This incentive program has been used year round and familiar to participants. The school utilizes 3 pointers “3pt” for “Active living” and “Perseverance”. Active living was awarded for participants that go beyond what the expectation.
a) Example: if the class is going to do 10 push-ups and the participant does 12 push-ups they will be awarded a “3pt” Perseverance was awarded for those participants that are struggling with an activity but are trying to their best to complete the task.
b) Example: if the participant is not able to perform 10 pushups but is doing their best to complete the 10 push-ups the will be awarded a “3pt” Incentive program will be awarded to all participants and non-participants.
Data Analysis
This study conducted T-Test and descriptive analysis among gender and age relative to steps and MVPA. Statistical analysis was conducted on pre and post perception of science among gender and age (Figure 5).
Results
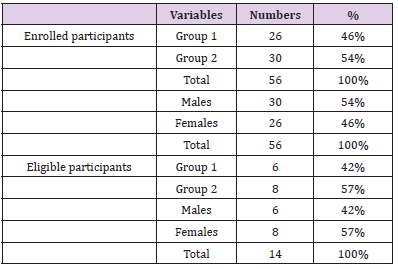
In this study, 56 participants were enrolled from Spark Academy middle school in Lawrence, Massachusetts. Convenience sampling was conducted for two 6th grade groups, Group 1 and Group 2. Both groups received the intervention at different times of the day. Initial enrollment was 26 participants (46% of total enrollment) and Group 2 initial enrollment was 30 participants (54% of total enrollment). Out of the 56 initial enrolled participants 30 were males (54%) and 26 were females (46%). Inclusion criteria required participants to complete a pretest and a posttest with a minimum of 1 day of baseline physical activity (PA). There were 14 participants that were considered eligible to participate in the study (25% of total enrolled), 6 participants from Group 1 (42%) and 8 participants from Group 2 (57%) (Table 1). Out of the 14 eligible participants 6 were males (42%) and 8 were females (57%). Gender among groups were not split evenly due to school logistics.
Note: Table 1 above highlights demographic information. The information provided includes enrolled participants and eligible participants.
Baseline Physical Activity
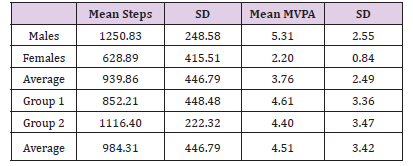
There were 3 random days selected to collect baseline physical activity. There were 8 students that completed all 3 days of baseline physical activity (57% of all eligible participants). There were 3 participants that completed 2 days of baseline physical activity (27% of eligible participants) and 2 participants that completed 1 day of baseline physical activity (27% of all eligible participants). Average steps and MVPA were calculated to assure accurate baseline data. In Table 2, Group 1 mean baseline physical activity was 852.21, SD =448.48, and Group 2 mean baseline physical activity was 1116.3, SD =222.32. Group 1 mean MVPA was 4.61, SD 3.36, and Group 2 mean MVPA was 4.40, SD =3.47. Mean MVPA for males was 5.31, SD = 2.55, and for mean MVPA for females was 2.20, SD=0.84.
Pre and Posttest Assessment
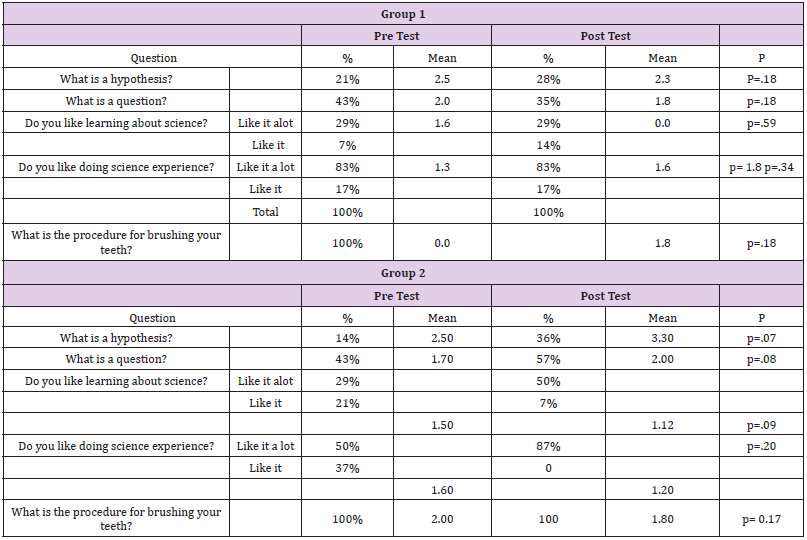
All participants participated in a Likert scale assessment to measure science knowledge and science attitude. For Group 1, there was a 7% increase in question 1, “What is a Hypothesis”, and 8% decrease in questions 2, “What is a Question?”, (21%-28, 43%- 35%, respectively, p = .18) from pretest to post test. For question 3, “Do you like learning about science” the amount of participants that answered, “Like it a lot” remained the same from pretest and posttest (29%29%), p= .59, but there was a 7% increase in students that answered “like it”. There was no change nor significant findings for question 4“Do you like doing science experiment” (83%83%) p=.34. All participants scored 100% when asked “What is the procedure for brushing your teeth”. For Group 2, “What is a hypothesis “there was no significant findings but students improved there score by 22% (14%-36%) p=.07. In questions 2, there was no significant finding for “What is a question” but participants improved their score by 14% (43%-57% respectfully) p=0.08. In questions 3, “Do you like learning about science” student’s improved their score by 21% and the amount of students that scored “like it” was 14% lower in the post test, p=0.09. For question 4, “Do you like doing science experiment” there was an increase of 27% (50%- 87) p=.20. In question 5 there was no significant finding and score remained the same from pretest to posttest (100%-100%) (Table 3).
Table 3: Indicates scores from pre and posttest relating to science knowledge and science attitude. Data collected based on a Likert scale assessment that incorporated age appropriate science questions. (*) Groups were divided due to academic service provided within each group. Group 2 had students with minimal amount of services.
Physical Activity
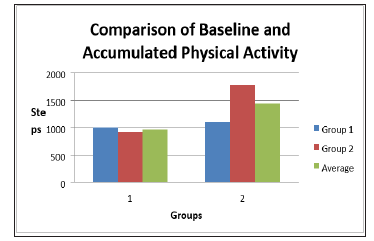
Figure 6 illustrates the baseline data and accumulated physical activity that was collected throughout the study. Accumulated physical activity was collected by averaging class average step in each class. For Group 1 there was 1003 steps taken at baseline and the accumulated physical activity was 1101. For Group 2 there was no statistical significance in baseline physical activity was 929.58 and the accumulated physical activity was 1776. An average step for both groups combined was 966 steps and accumulated average was 1438. There was no significant finding among groups. The importance of finding ways or innovative tools to improve academic performance while increasing physical activity is paramount to assure children up to adolescence are moving while learning. Understanding that the No Child Left Behind has made strides at reducing the achievement gap it has inversely correlated with the increase of obesity. Although it is not causal relationship it is noteworthy. We have to assure that we are doing both, improving academic performance while continuing to provide children through adolescence the opportunity to move daily. What was found in this study, although its not significant, it bears a trend that if build upon could be utilized to change current policies regarding physical activity and physical education.
In this study we found that there was leading trend towards improvement in academic performance but it was not statistically significant. When analyzing the pre and posttest both groups positively improved their scores after the 3 week intervention. There was improvement in questions 1 and 2, which were geared at assessing science knowledge. As well as, question 3 that were geared at assessing science attitude. Another outcome that occurred in this study was that there was an increase in baseline physical activity and accumulated physical activity this was trending in the appropriate direction but was not significant.
Academic Performance
There are some variables that could have explained the lack of significance in Academic performance. An explanation could be this study’s small sample size (14 participants). When compared to a study by Finn and Capisi that involved pre and posttest assessment of science knowledge and attitude after engaging in PA, we can see that they demonstrated statistical significance in the study. This study had a larger sample size (54 participants), as well as, participants were younger of age. The age difference could have also improved engagement which could improve PA and AP. But not all research stray in this direction of this study. In a research by Cornejo in 2014 found that PA was negatively associated with AP. They stated that a high level of PA could take away time from studying and in turn decrease AP. The study utilized end of year grades to measure AP which could have limited the research to bias but it is still noteworthy to acknowledging that not all PA results in improved academic performance (Cornejo et al). Although the data was not statistically significant, we did observe an increase in AP even though it was not statistically significant. This could lend its self to think that if the sample size was larger the outcome could have been significant.
Physical Activity
When participants utilize technology or participate in a study they are more likely to improve their PA. As in the pilot study by Evans Et all were participants initially increase their PA from baseline to follow up. This could be consistent with the results that occurred within this study. Participants participated in a 3 week intervention which could have led to the initial peak in initial PA levels. There are some studies that suggest that mobile application is not effective. In a study by Zhu and Dragon in 2018, suggested that mobile technology- integrated in PE might not be effective for increasing students’ PA levels over a short duration of time, particularly when the mobile technology does not direct PA prompt. Active science application does not prompt participant to move therefore it could lend to lower activity levels as seen in group 1 (852 steps) compared to group 2 (1116 steps). The short 3week intervention could have also deemed to be a factor to why the data was not significant. Participants in this study initially could have increased their initial PA due to the novelty of the application but due to the short duration of the intervention it was difficult to see if mean PA levels would have increased, decreased, or remained the same.
Strengths and Limitation
This was the first study to utilize Active Science application within a school setting and select older participants (6th grade) compared to traditional Elementary students (K-5th grade). This allowed the study to fit within the logistics of a normal public school setting compared to previous Active Science study were they were conducted afterschool or summer camp. It also aided in measuring attitude of Active science within an older group. Some limitations were the lack of participants that were eligible to participate within the study. There were 54 participants enrolled but we ended with 14 eligible to participate in the study. This was due to lack of inconsistency in participant attendance and school based priorities (such as additional Math and ELA classes). Prior to the commencement of the intervention there was an application update that led to a decrease in the length of the intervention. If the study could have remained at 6 weeks it could have yielded a different result. Lastly, identifying groups that have consistent attendance could have aided in collecting more consistent baseline PA data and pre and post assessment.
Future implication for Active Science
Future research should allocate more time in understanding the logistics of the school in which study will be conducted in. As well as, identifying which participant groups have better attendance and have more participants of equal learning abilities. This would allow active science to make fewer adjustments on the application. Lastly, Active Science should identify more age appropriate games that are geared for middle school participants. Currently, application games are geared for Elementary students. This can lead to disengagement of older participants.
Practical Application
Although this data was not significant there is much that has been gained. Participants increase physical activity and improved in science knowledge and attitude. This can be used to begin improving on how to modify the tablets from Elementary age students to middle school aged students. This study should remain in 6th grade participants until modifications have been made.
Conclusion
Although obesity has plateaued in the United States finding alternative methods to improve PA is of importance. If children and adolescence can reach 60 minutes of PA a day they are more likely to live a healthy life. This is why is paramount to validate PE in schools. PE allows students to move and learn physical skills but also improve their AP. Although, the aforementioned research did not have significant data it is a great leading step to improve and validate the effectiveness of PE and its effectiveness on academic performance. Active science has shown that it can improve physical activity and academic performance within a PE setting. This study has set a platform worth continuing. If we can improve upon this research it will allow validity to make change in the current state and federal level.
Method for Selection of Laboratories in Need of Infrastructure Improvement to Meet HIV Viral Load and Early Infant Diagnosis Unmet Testing Needs in Kenya-https://biomedres01.blogspot.com/2020/09/method-for-selection-of-laboratories-in.html
More BJSTR Articles : https://biomedres01.blogspot.com




No comments:
Post a Comment
Note: Only a member of this blog may post a comment.