Vibrational Cooling Effect of Zeolite on Molecular Desorption Studied by Time-Resolved Laser Desorption Ionization Mass Spectrometry
Introduction
Laser desorption ionization (LDI) mass spectrometry is one of the most reliable techniques for analyte detection. By using matrix molecules that absorb laser photons, “soft ionization,” a process that does not decompose an analyte during ionization, becomes possible. This technique, called matrix-assisted laser desorption ionization mass spectrometry (MALDI MS), has been widely applied to the analysis of biopolymers, such as proteins or peptides, as its soft ionization potential enables observation of analyte-related ions with very few fragments [1-3]. However, MALDI MS has several drawbacks, including low ionization efficiency, protonated analyte peak suppression by alkali metal ion contaminants, and inapplicability to low molecular weight compounds due to the dissociation of matrix molecules. To overcome these drawbacks, many attempts have been made, including matrix-free techniques [4-7], application of nanometer-sized particles [8-10], and the use of a co-matrix with conventional organic matrix molecules [11-14]. Recently, we have revealed that zeolite is one of the most promising additives for MALDI MS. Zeolites are crystalline aluminosilicates with three-dimensional frameworks and nanometer-order cages. Zeolites have high catalytic activity due to the charge imbalance at the Si-O-Al bridging sites, and those sites are compensated typically by such cations as H+ and Na+. Hydroxyl (OH) groups having Brönsted acidity exist in H+-exchanged zeolite. It is known that the Brönsted acid site is responsible for the catalytic activity of zeolite. By using zeolites in MALDI MS, it was found that they prevented the dissociation of matrix molecules and enhanced the peak intensity of the protonated analyte [15].
The mechanism of the peak intensity enhancement could be understood as efficient proton supply from the Brönsted acid sites and stabilization of intra- and intermolecular proton transferred states by the strong polarity of zeolite [15]. However, the reason why zeolite prevents the dissociation of matrix molecules is still not clear, although it could be assumed that the excess vibrational energy of matrix molecules would be released to the lattice vibrations of zeolite. In this study, we examined how the three-dimensional framework as zeolites influenced molecular desorption by time-resolved mass spectrometry. Time-resolved mass spectrometry is a pump-probe type measurement [16-18]. By pumping, vibrational excitation of intermolecular dissociative modes takes place. Then, the molecule undergoes ionization including protonation and cation adduction by the probe, and the ion is released to the gas phase for detection. Therefore, the time required for molecular desorption can be detected by changing the delay time between pump and probe. It was understood that zeolite suppressed molecular desorption because it acted as a heat bath, diffusing excess vibrational energy efficiently into its lattice vibrational modes.
Experimental
2,4,6-Trihydroxyacetophenone (THAP) and 1’-hydroxy- 2’-acetonaphthone (HAN) were purchased from Sigma. NH4+- terminated zeolite (NH4M20) was supplied by the Catalysis Society of Japan. For time-resolved mass spectrometry, a Ti: sapphire laser with a regenerative amplifier (Spitfire, Spectra Physics) was used to provide femtosecond pulses (800nm, 0.8mJ, 110fs). The repetition rate was 10Hz. The output was frequency-doubled (400nm) by an LBO crystal and then divided into pump and probe beams. The time delay between pump and probe was changed by the optical delay equipped in probe line. Mass spectrometry was performed under the condition that the spectrum could not be observed by single-beam excitation (pump or probe pulse only); pulse energy was 8μJ for the pump and 10μJ for the probe. Both pulses (pump and probe) were focused by a quartz lens and introduced into a laboratory-built time-of-flight (TOF) mass spectrometer. Solutions of THAP and HAN (1.0 x 10⁻² mol dm-3) were prepared with a mixture of acetonitrile and water (v/v=7:3). Ten microliters of each solution were pipetted onto a stainless steel sample target and the solvent was allowed to evaporate. Thus-obtained crystals of THAP or HAN were subjected to time-resolved mass spectrometry. For the measurement of THAP on zeolite, THAP (16.8mg) was first mixed with NH4M20 (67.2mg) (weight ratio=1:4) in a mortar and pestle and the mixture was suspended in a mixture of acetonitrile and water (v/v=7:3, 10mL; 1.0 x 10⁻²mol dm-3 for THAP). Then, ten microliters of the suspension was pipetted onto a stainless steel sample target. The obtained crystals of THAP/NH4M20 were subjected to time-resolved mass spectrometry.
Results and Discussion
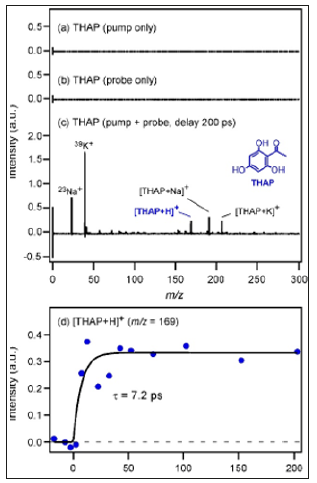
Figure 1a shows the mass spectrum of THAP crystals measured by pump pulse irradiation. No ions were detected by only the pump pulse irradiation. Figure 1b shows the mass spectrum of THAP crystals measured by probe pulses. No ions were detected also by only the probe irradiation. In contrast, when the sample was irradiated by the pump and probe pulses at the same spot at a certain delay time, the situation became different. Figure 1c shows the mass spectrum of THAP crystals obtained by the pump-probe measurement (probing at 200ps delay after pumping). The peak of protonated THAP, [THAP+H]+ , was observed at m/z=169, whereas the peaks of [THAP+Na]+ and [THAP+K]+ were observed at m/ z= 191 and 207, respectively. It is noted that this delay time was neither TOF nor the timing of ion extraction voltage (10ms) after a laser shot, but the timing between the pump and probe pulses. In addition, any time resolution of electronic devices was not used in this study. Figure 1d shows the time dependence of the peak intensity of [THAP+H]+. The peak intensity of [THAP+H+ gradually increased with increasing delay time.
Figure 1: Mass spectrum of THAP crystals measured with a) pump pulse b) probe pulse c) Time-resolved mass spectrum of THAP crystals measured with pump and probe irradiation (delay at 200ps) d) Time dependence of peak intensity of [THAP+H]+.

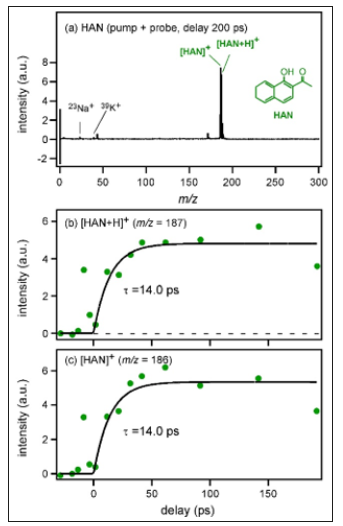
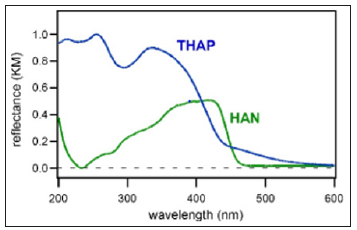
By fitting analysis using exponential functions, the time constant of the rise component was determined to be 7.2±2.3 ps. Figure 2a shows the mass spectrum of HAN crystals measured with pump and probe irradiation (probing at 200ps delay after pumping). Peaks of [HAN]+ and [HAN+H]+ were observed at m/ z= 186 and 187, respectively. The time dependence of the peak intensity of [HAN+H]+ is shown in Figure 2b. Although the S/N ratio was not good, the rise time was determined by fitting analysis as 14.0±9.4 ps. In addition, the time dependence of the peak intensity of [HAN]+ is shown in Figure 2c. Although [HAN]+ and [HAN+H]+ were different species, it was found that the intensity rise was also reproduced by the same exponential function having the lifetime of 14.0ps. Therefore, it became clear that the rise component represented not the ionization efficiency but the desorption time, which was determined by the environment where each molecule existed. HAN has a similar molecular structure to THAP but a higher molecular weight. In addition, it was found that the absorbance of THAP at the excitation wavelength for time-resolved mass spectrometry (400nm) was almost equal to that of HAN as shown in diffuse reflectance spectra of THAP and HAN crystals (Figure 3).
Figure 2:Time-resolved mass spectrum of HAN crystals measured with a) pump and probe irradiation (delay at 200ps). b) Time dependence of peak intensities of [HAN+H]+ c) [HAN]+

Therefore, the different appearance of the mass spectra is due to the difference in desorption and ionization properties of the two crystals. If we consider the 3N-6 rule for molecular vibrations (N is the total number of atoms in the structure), the number of intramolecular vibrational modes of HAN would be larger than that of THAP. By pumping, THAP or HAN was photoexcited to the S1 state. In the deactivation of the S1 state to the S0 state, photon energy was changed to intramolecular vibrational energy. After the intramolecular vibrational relaxation (IVR) process, those energies dissipated into the intermolecular vibrational modes. For the desorption of a molecule, multi-quantum excitation and breaking of every intermolecular vibrational mode are necessary. Therefore, it is possible that HAN requires much more time for IVR and vibrational energy dissipation into the intermolecular modes than THAP because the number of intramolecular vibrational modes of HAN is larger than that of THAP, leading to a longer desorption time. The desorption time difference between HAN and THAP could be explained also by taking those dimers into consideration. If a HAN dimer and the 3N-6 rule for the molecular vibrations are assumed, the calculated number of intermolecular vibrational modes would be 6, which is equal to that of a THAP dimer.
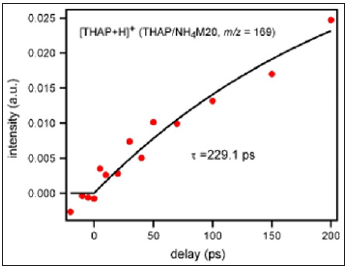
Figure 4:Time dependence of peak intensity of [THAP+H]+ from THAP/NH4M20 measured by time-resolved mass spectrometry.

However, it is generally known that intermolecular vibrational modes often couple with intramolecular ones. Therefore, the number of intermolecular vibrational modes of HAN is larger than that of THAP practically because HAN has more intramolecular vibrational modes than THAP. The desorption time was determined by how rapid desorption-related intermolecular vibrational modes were excited. As HAN crystals as well as the dimer had more intermolecular vibrational modes than THAP crystals, it could be understood that much more time was necessary to excite those modes in HAN than THAP as the pump input energy (400nm, 8μJ) was equal for both measurements. Then, how desorption proceeded when the molecules existed on a material with a high vibrational density of state was investigated. In this experiment, NH4+-terminated zeolite was used instead of H+-type zeolite in order to extract the influence of only the three-dimensional framework on the desorption; ammonium ions blocked the active sites of zeolite, which led to minimum electrostatic attraction between the molecule and zeolite. (Figure 4) shows the time dependence of the peak intensity of [THAP+H]+ obtained from THAP/NH4M20.
As the active sites of zeolite were blocked by ammonium ions and efficient proton supply to THAP was hindered, the peak intensity was almost one-tenth of that observed for THAP crystals (Figure 1c); only the effect of the three-dimensional framework on the desorption could be extracted. Although the S/N ratio was not good, the time dependence of the peak intensity was fitted by exponential functions and the rise component was determined as 229.1±133ps. For the desorption of THAP on zeolite surface, intermolecular vibrations between THAP and zeolite must be excited. However, as those vibrations were directly connected to zeolite lattice vibrations with high density, it became difficult to accumulate desorption energy in the intermolecular vibrational modes between THAP and zeolite. The rapid diffusion of vibrational energy by the zeolite lattice was responsible for the long desorption time (229.1ps) of THAP. Therefore, it was understood that zeolite offered such condition as diffusion of excess vibrational energy causing matrix as well as analyte fragmentation. Although molecular desorption became difficult by using zeolite, the peak intensity of analyte-related ions became strong when H+-type zeolite was used15 since ionization by efficient proton (cation) supply from Brönsted acid site was possible.
Conclusion
The desorption times of the protonated species of THAP ([THAP+H]+) and HAN ([HAN+H]+) from their crystals were determined to be 7.2±2.3 and 14.0±9.4ps, respectively, with a pumpprobe type time-resolved mass spectrometer. This desorption time difference could be explained by considering the number of intermolecular vibrational modes in THAP or HAN dimers. It was clarified that a long time was required for the desorption of HAN, which had many intermolecular vibrational modes. Then, the influence of the three-dimensional framework on the desorption process was investigated. The desorption time for THAP adsorbed on zeolite was 229.1±133ps. For the desorption of THAP on zeolite surface, the intermolecular vibrations between THAP and zeolite must be excited. As the intermolecular vibrations between THAP and zeolite were directly connected to zeolite lattice vibrations with high density, it became clear that desorption energy accumulation in those modes was difficult, leading to the long desorption time.
Toward an Exosome-Based Therapeutic Strategy in Regenerative Dentistry-https://biomedres01.blogspot.com/2020/09/toward-exosome-based-therapeutic.html
More BJSTR Articles : https://biomedres01.blogspot.com


No comments:
Post a Comment
Note: Only a member of this blog may post a comment.