Developing a Functional Staging to Assist Clinical Interpretation of the Oswestry Disability Indexs
Introduction
Improvement in pain and function are two essential outcomes in orthopedic surgery and spine management. Patient-reported outcomes designed to assess levels of pain and function have become pivotal in evaluating orthopedic interventions [1]. Among them, the change scores in Oswestry Disability Index (ODI) [2] have been used widely as the objective measurement of functional disabilities of lumbar spine function in both medical research and clinical practice. The popularity leads to the existence of more than 27 versions of ODI adaptations in 24 different languages/cultures for application [3].
The questionnaire has been used:
a. To measure functional improvement following spine surgeries [4-6];
b. To assess the benefits and efficacy of stretching exercises and spinal manipulative therapy in patients who suffer from low back pain [7,8]; and
c. in functional capacity evaluations that can affect eligibility for ongoing benefits and rehabilitation funding [9].
The ODI is a simple disability scale that uses 10 items to measure the disability level. It reveals functional capacity with reallife physical activity [10]. Additionally, the order of item difficulty could be used as a rule of progressive management program [11,12]. Previous studies supported the psychometric properties of ODI. The reliability of ODI was supported by moderate to high reliability coefficients: test-retest reliability (Intraclass correlation [ICC] = 0.70-0.92 [13-16], intrarater reliability (ICC = 0.93) [17], internal consistency (Cronbach’s alpha = 0.78-0.97) [13,15-19]. Findings of the ODI also demonstrate high correlations with other measures, such as visual analogue pain intensity scale (r = 0.67), Roland-Morris Disability Questionnaire score (r=0.71- 0.76) [13,15], and short-form-36 (r = 0.25-0.46) [20]. Factor analysis supports its unidimensionality [13,18,21]. Furthermore, responsiveness studies report several cutoff thresholds to classify patient’s improvement [14,22]. Psychometric examinations at the item level have been performed [1,9,11,23-25]. However, prior studies show great variations of item difficulty hierarchical order, especially the order of items at the middle difficulty level.
Such inconsistencies in the studies may result from specific settings (e.g., outpatient vs spine center, work-related vs spine deformity) or relative small sample size (n = 42 [12], 95 [23], 100 [24], 133 [9], 408 [11]). Therefore, it is necessary to involve a larger sample size to reexamine variations of item difficulty hierarchical order. Functional staging [26] is a visual display of function status classification that aims to enhance clinical interpretation of patientreported outcomes. Functional staging produces a set of hierarchical outcome levels for classifying patients into different stages that describe functional status. By visually scrutinizing the form along with a respondent’s score generated by patient-reported outcomes (e.g., ODI score at admission or follow-up), clinicians could easily see that the respondent appears to have more difficulty with certain activities and that information could help clinicians to formulate short-term or long-term treatment goal(s) [12]. According to our knowledge, functional staging has not been available for the ODI questionnaire. The purposes of this study were to:
a) Examine the psychometric properties of the 10-item ODI 2.0 (0-100) questionnaire using the Rasch analysis, and
b) Develop a functional staging approach to guide clinical interpretation of the patient’s improvement by interpreting ODI scores.
Methods
Data Collection
This study used clinical patient data provided by FOTO, Inc (Knoxville, TN, USA). Patients’ demographic data and self-report surveys were collected prior to patients’ initial evaluation and therapy using the Patient.
Inquiry® Software
Data were selected from the database when patients met the following criteria:
a) Were 18 years old and older;
b) Received outpatient physical therapy;
c) Received orthopedic care due to lumbar spine impairments; and
d) Completed the ODI questionnaire upon admission (between April 2015 and May 2016). IRB approval was waived as this was a secondary data analysis using de-identified data free of personal identifiers.
Setting and Participants
A sample of 3,460 patients with orthopedic lumbar spine impairments seeking outpatient physical therapy in 274 clinics was analyzed (Table 1).
Table 1: Patient characteristics.
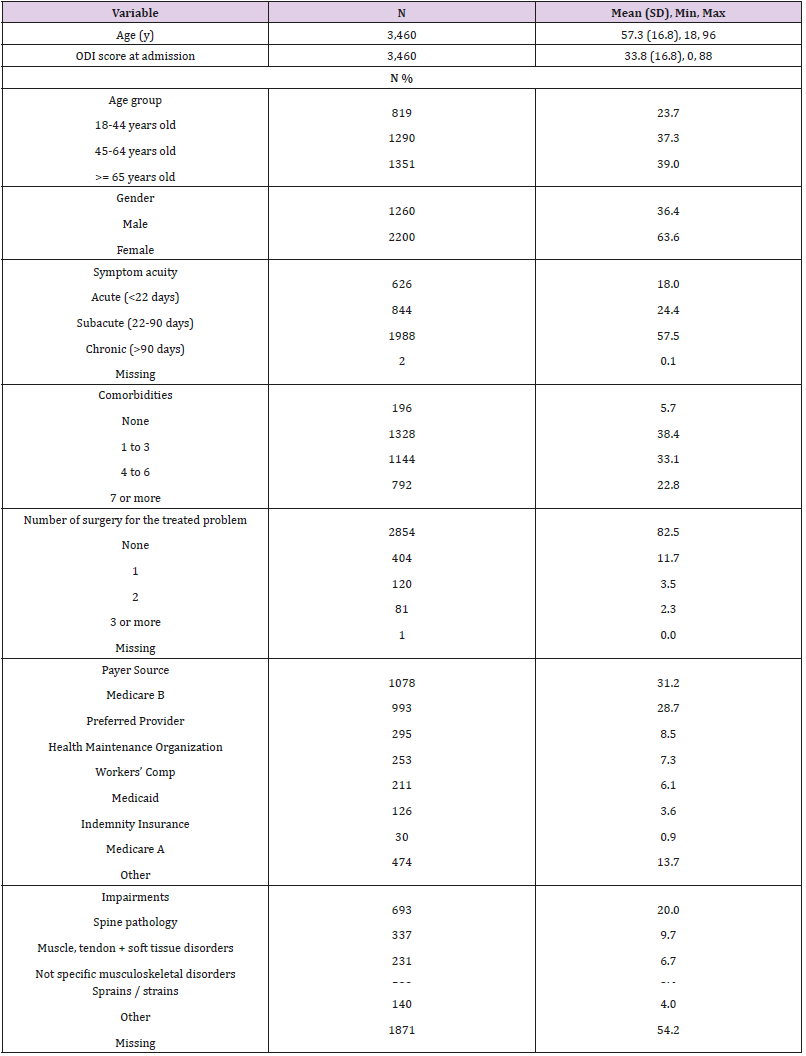
Abbreviations: SD=standard deviation; min=minimum; max=maximum, ODI = Oswestry Disability Index.
Outcome Measures
The ODI 2.0 questionnaire was designed to give clinicians information about how back or leg pain affects a patient’s ability to manage their pain in everyday life. The questionnaire includes 10 items: pain intensity (item 1), personal care (item 2), lifting (item 3), walking (item 4), sitting (item 5), standing (item 6), sleeping (item 7), sex life (item 8), social life (item 9), and traveling (item 10). Each item consists of six statements correlating to scores of 0 through 5, with 5 representing the greatest disability. The point total from each section is summed and then divided by the total number of questions answered and multiplied by 100 to create a percentage disability. Scores range from 0-100% with lower scores meaning less disability.
Based on their score, patients were categorized into 5 levels of disability [2]:
a) 0% to 20%: minimal disability,
b) 21% to 40%: moderate disability,
c) 41% to 60%: severe disability,
d) 61% to 80%: crippled, and
e) 81% to 100%: bed-bound.
Rasch Analysis
The ODI data were analyzed by the Rasch partial credit model (PCM) using the Winsteps software [version 3.90] [27]. Using iterative computation procedures, the Rasch model computes person ability (i.e., the functional disability measured by the ODI) and item difficulty parameters on the same common metric. For easier interpretation, higher or more positive measures (in logits) represent higher function of a person or more challenging of an item. Rating scale structure was examined using Linacre’s criteria [28]:
a) At least 10 observations should be in each rating scale category;
b) Average measures (i.e., Rasch-Thurstone thresholds) should advance monotonically; and
c) Outfit mean-squares should be less than 2.0.
Categories with low frequency counts or disordered rating scale structure may suggest that the operational definition of the rating scale category can be assigned to the respondent only in rare situations, with a narrowly defined scope, or was redundant when other response categories were present. Item difficulty hierarchical order was inspected via the estimated item difficulty calibrations, which are expressed in logits with higher positive values indicating a more challenging task. Two types of fit statistics were performed to investigate whether the response patterns on the lumbar functioning fit the Rasch’s probabilistic model. Infit is more sensitive to unexpected behavior affecting responses to items near the person’s measure level (i.e., information-weighted), whereas outfit is more sensitive to unexpected behavior by persons on items far from the person’s measure level. A fit statistics higher than 1.40 indicates misfit [29].
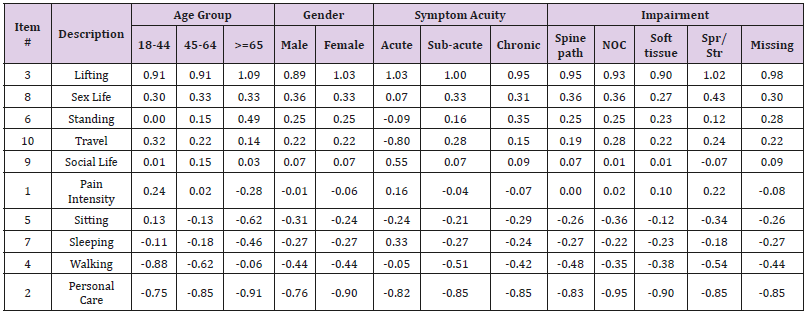
Person-item match/targeting was examined by inspecting the overall score distribution (i.e., coverage range), and comparing the means of person measures and item difficulty estimates. If the mean of person measures is higher, items are relatively easier to the sample of patients. The person separation index (G) is an estimate of how well the scale can differentiate persons into statistically distinct person strata with centers three measurement errors away [strata = (4*separation + 1)/3] [30]. To examine item bias or whether item difficulty hierarchical orders were similar by subgroup, we performed differential item functioning (DIF) analysis on ODI items by age group (18-44, 45-64, >=65 years old), gender, acuity (acute: <22 days, subacute: 22-90 days, chronic: >90 days), and impairment:
a) Spine pathology,
b) Muscle, tendon + soft tissue disorders,
c) Not specific musculoskeletal disorders,
d) Sprains / strains, and
e) Patients without impairment codes.
Because the DIF analysis is a series of pairwise t-tests, a priori determined DIF items were those with:
i. Statistically significant t-test (p-value =<0.01), and
ii. Impact difference in item difficulty estimates of 0.35 (logits) or greater to avoid statistical significances caused by trivial differences.
Meanwhile, ICC with absolute agreement was computed to examine the agreement of item difficulty estimates between groups. To assess unidimentionality, we conducted exploratory factor analyses (EFA) followed by confirmatory factor analyses (CFA), utilizing Mplus (Muthe´n & Muthe´n, Los Angeles, CA) [31]. Model fit was evaluated using the comparative fit index (CFI), and the Tucker-Lewis index (TLI). Values of CFI and TLI greater than 0.90 are indicative of good model fit [32].
Functional Staging
Item difficulty parameters and rating scale thresholds, calibrated based on the Rasch model, were used to create the functional staging. Briefly, functional staging merges two things together:
a) The probabilistic model – as analyzed using the Rasch analysis – and
b) Functional status classification levels defined clinically by experts, clinicians or others.
Therefore, the estimated parameters (i.e., thresholds values) obtained from the Rasch analysis were used to integrate with 5 levels of functional disability mentioned above. The detailed procedure to develop a functional staging has been described elsewhere [33-36].
Results
Rasch Analysis
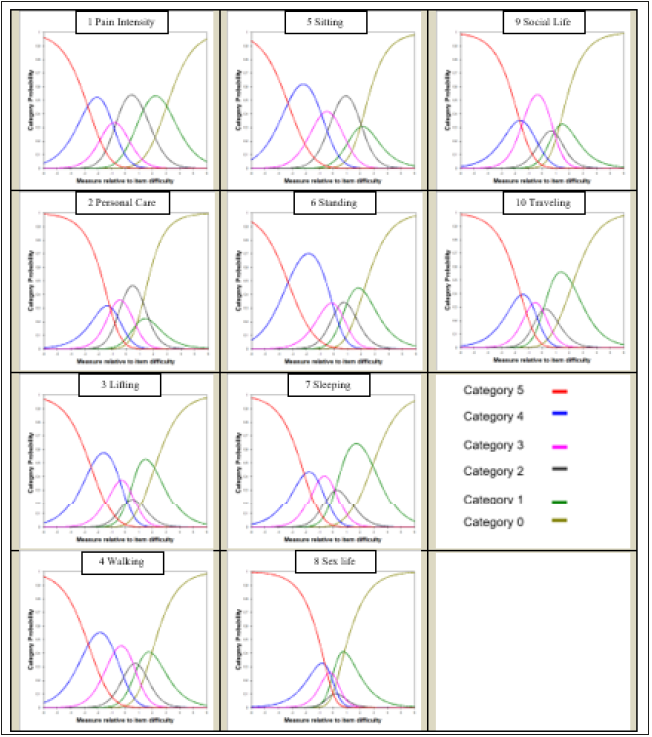
All rating categories had at least 10 observations. Two items had disordered rating scale thresholds: response categories from “5” to “4” in item5 (sitting) and item2 (personal care). One response category, rating scale category of “5” (I do not get dressed, wash with difficulty, and stay in bed) in item2, had outfit greater than 2.0. The category probability curves (Figure 1) show how probability of the observation of each category (y-axis) is relative to the item measure (x-axis). Results revealed that a few response categories (e.g., “2”) were less likely to be observed; and narrow scope in middle response categories in the sex life item. Table 2 presents the estimated item statistics of the ODI items in difficulty order. ‘Lifting’ (on the top) appeared to be the most difficult item. All items showed good infit and outfit statistics (< 1.40). Comparing to the mean (SD) of item difficulty estimates of 0.0 (0.5) logits, the patient ability level, on average, had a slightly higher mean (SD) of 0.99 (1.1) logits, suggesting that items were slightly easier for the patient sample.
Table 2: Item difficulty parameters of the ODI items.

Note: ODI items are listed in descending order of difficulty in the left column – more challenging items are listed on the top.
*Rasch-Thurstone thresholds (50% Cumulative Probability) is the thresholds wHise a person at the boundary between “1” and “2” would have a 50% chance of selecting a rating category of ‘1’ or below, and a 50% chance of selecting ‘2’ or above.
However, only 18 (0.5%) patients who obtained the maximum score (i.e., ceiling) and 0 (0%) patients who had the minimum score (i.e., floor), suggesting a great coverage of the functional status for the patient sample. With a separation index equaled to 2.15, the ODI items can differentiate persons into 3.2 statistically distinct person strata. DIF results showed that most of the item difficulty estimates by subgroups were highly correlated. ICCs were 0.82 by age group, 0.99 by gender, 0.74 by symptom acuity, and 0.98 by impairment, respectively (Table 3). ODI items were free of DIF by gender and impairment. Four items were suggestive of DIF by age group. For patients >= 65 years old, sitting was easier, but standing and walking were more challenging. Pain intensity was more challenging for patients 18-44 years old.
Five items were suggestive of DIF by symptom acuity. For patients with acute conditions, traveling was relatively easier to manage, but sleeping and social life are more difficult. Additionally, patients with acute conditions felt easier in standing activities comparing to chronic group, but reported more difficult in walking when comparing to subacute group. Results supported the unidimensionality of the m-ODI questionnaire. The factor loadings ranged from 0.55 (sitting) to 0.79 (social life). The CFI was 0.89 and the TLI was 0.95, suggesting marginally good model fit. The first factor explained 49.6% of the total variance, followed by 11.2% variance explained by the second factor, and 6.7% by the third factor.
Functional Staging
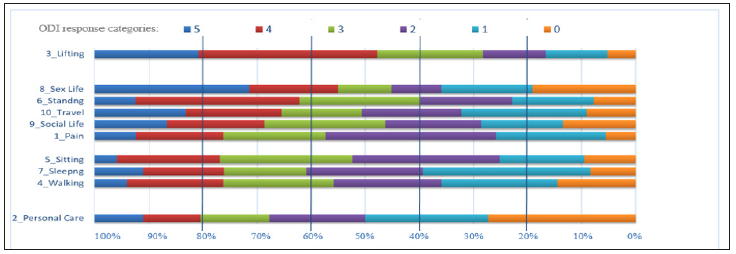
Figure 2 displays the functional staging of the ODI questionnaire and the expected response (horizontal bars) to a given item as a function of the underlying ability (i.e., functional disability) estimated by the ODI questionnaire. In this figure, the ODI items are listed in descending order of difficulty in the left column – more challenging items are listed on the top. Beneath the figure is the ODI score ranging from 0% to 100% separated by different levels of functional staging ranged from level 1 (bed-bound) to level 5 (minimal disability). Using the functional staging method, we can obtain the expected responses of each item at each ODI score by drawing a vertical line over an ODI score (x-axis) on the figure.
Figure 2:Functional staging using the Oswestry Disability Index (ODI). This figure shows the expected response (the color horizontal bars) to a given item as a function of the underlying ability (i.e., functional disability) estimated by the ODI questionnaire.
A Clinical Example
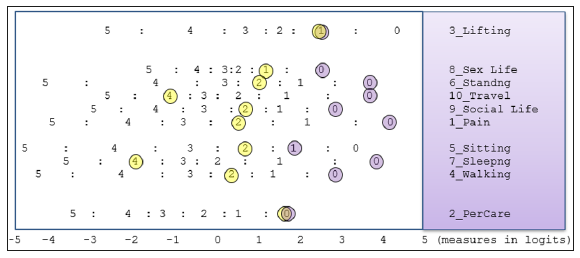
To illustrate how to use these strategies, we selected an actual patient out of the database for demonstration purpose. Mr. John Doe (male, age 19), came to the clinic due to acute muscle, tendon, soft tissue disorders at the low back. His initial ODI score was 40 at admission and 4 at discharge. To visualize his responses, we plotted all his responses in Figure 3, where yellow circles identify the responses at admission, and purple circles identify responses at discharge. By drawing a vertical line over an ODI measure (x-axis) or circling the responses, clinicians can see the predicted responses. At admission, the functional staging classified Mr. John Doe as either ‘moderate’ or “severe” (between level 3 and level 4). The real responses of items 1 to 10 from Mr. Doe and the expected responses ‘()’ based on the staging were 2(2), 0(1), 1(3), 2(2), 2(2), 2(2), 4(2), 1(2), 2(2), and 4(2), respectively. At discharge, the functional staging classification suggested Mr. Doe improved to level 5 (minimal disability). The real responses of items 1 to 10 and the expected responses ‘()’ were 0(0), 0(0), 1(0), 0(0), 1(0), 0(0), 0(0), 0(0), 0(0), and 0(0), respectively. Specifically, Mr. Doe had no difficulty in almost all daily activities, except lifting heavy weights, which gives extra pain.
Figure 3:Clinical example using the keyform illustration. The 83-yr chronic patient’s (Mr. John Doe) responses at admission are circled on the figure: yellow circles identify the responses at admission (ODI score = 40), and purple circles identify responses at discharge (ODI score = 4).
Discussion
This study examined the psychometric properties of ODI 2.0 questionnaire and presented the functional staging to translating ODI into clinical practice. Similar to previous studies [1,11,12,23- 25], our results supported unidimensionality, the match of item difficulty to patient functioning, general good fit to the Rasch model, multiple disordered thresholds and underused response category of the ODI, regardless patient samples and clinical settings across studies. We decided not to collapse categories because each ODI item has its own definition of rating scale categories and collapsing categories may not provide practical benefits as clinicians or researchers still use the original version of the questionnaire. We did observe low frequency counts in rating scale category “5” with only 11 patients reported in sitting and 18 patients reported in personal care items, respectively, which might cause the unstable estimation of the thresholds. The sex life item, on the other hand, has a very narrow scope in middle response categories.
Patients either reported a “0” (my sex life is normal and causes no extra pain), or a “5” (pain prevents any sex life at all), instead of middle response categories such as rating scale “2” (my sex life is nearly normal but is very painful). Of particular concern is that prior studies show great variations of item difficulty hierarchical order, especially of items at the middle difficult level [1,11,12-25]. For example, item difficulty of the ‘sex life’ item was ranked number 2 (in our study), 4 [11,24], 7 [9], and 8 [23] in previous studies. Such a finding is worrisome because the empirical item difficulty hierarchical order produced by the Rasch analysis is supposed to function as evidence of construct validity to the theoretical base of the instrument. There are several clinical application of the functional staging. For example, clinicians can set short-term or long-term goals by inspecting expected responses between (a) ODI score at admission and (b) ODI score at admission plus minimal detectable change points.
Meanwhile, patients’ unexpected responses (e.g., observed response is deviated from the expected response) are easy to identify and these may be useful to help clinicians manage patients who may consider whether there is a logical reason why the client had an unexpected response. There are several limitations of this study. Since this study was a secondary analysis of prospectively collected data, the researchers had no control of the data collection procedure. Missing values (e.g., impairment codes) were inevitable in routine outpatient clinics. In addition, the database is not linked to the electronic medical records, so impairment codes cannot be verified. There may also exist selection biases from clinics subscribed to FOTO, Inc., which might be different from clinics that are not in the network.
Conclusion
This study supported the clinical use of ODI in outpatient rehabilitation settings. Functional staging approach provides more clinically meaningful interpretations of outcomes measures and may facilitate use of these measures by clinicians in routine clinical practice.
Serum Albumin Conformational Disturbances in Melancholic Depression can be Revealed Using Time Resolved Tryptophan Fluorescence-https://biomedres01.blogspot.com/2020/10/serum-albumin-conformational.html
More BJSTR Articles : https://biomedres01.blogspot.com

No comments:
Post a Comment
Note: Only a member of this blog may post a comment.