Accentuated Risk of Tenofovir-Associated Nephrotoxicity and Hepatoxicity among HIV Patients in Nigeria: Empirical Evidence from a Cohort Study
Introduction
Nigeria has the second largest HIV burden in the world and one of the highest incidence rates in sub-Saharan Africa [1]. Alongside nine other countries, mostly in Southern and Eastern Africa, it accounts for almost 80% of all people living with HIV (PLWHIV) [2]. However, with concerted global efforts, significant progress has been made in addressing the pandemic, such that the annual AIDS-related death rate has declined since its peak in the mid2000s, and the annual new HIV infection rate has also plummeted from its peak level in 1997 [3]. The acceleration of HIV testing and treatment within the context of a comprehensive approach that included condom use, voluntary medical male circumcision, preexposure prophylaxis (PrEP), and efforts to protect human rights and establish an enabling environment for service delivery led to a 32% global decline in AIDS-related deaths and a 16% global decline in new HIV infections between 2010 and 2016 [4]. Nevertheless, antiretroviral therapy (ART) has contributed immensely to curbing the surge of the HIV/AIDS scourge [5]. In 2017, 20.9 million PLWHIV had access to life-saving antiretroviral treatment. This was a rise from 17.1 million in 2015 and 7.7 million in 2010. Access to antiretroviral drugs remains suboptimal in Nigeria as only 30% of the over 3 million PLWHIV have access to ART [6,7]. Given the pivotal role of ART, two of the 2015 “90-90-90” global targets for HIV/AIDS control were to ensure that by 2020, 90% of all people with confirmed HIV infection receive sustained ART and that 90% of all people receiving ART will have viral suppression.
These targets are hinged on a global consensus that ART is central to ending HIV epidemic and, this has informed the recent World Health Organization “test-and-treat-all” guideline [4,8]. Tenofovir Disoproxil Fumarate (TDF), a pro-drug of Tenofovir has been widely used as the preferred backbone of HIV combination therapy. As a Non-nucleoside Reverse Transcriptase Inhibitor, TDF not only prevents viral transcription from RNA to DNA and, thus, stop HIV replication, but also, has improved cell permeability and oral bioavailability altogether accounting for its low rates of discontinuation from tenofovir-related viral resistance or toxicity. Nonetheless, it has been associated with toxic effects such as nephrotoxicity, hepatotoxicity, lactic acidosis and bone demineralisation [9,10]. TDF, due to its renal excretion, may interact with the apical membrane transporters in the proximal renal tubule and lead to excessive entry or reduced outflow of the drug, favoring intracellular accumulation and increased renal toxicity [11]. Studies have reported increased kidney tubular dysfunction, osteomalacia and Fanconi syndrome in patients on TDF-containing regimen [11-13]. Toxicities associated with ART have been studied extensively in developed countries, nonetheless, there is limited information about such toxicities from treatment programs in developing countries [14].
Remarkably, there is an architectural disparity in the kidneys of people of various descent and, thus, their susceptibility to potentially toxic exogenous substances would vary across regions [15]. Consequently, this study could provide new insights into TDF-associated nephrotoxicities among blacks in a developing environment. Since cure is not yet a possibility, HIV patients on ART do not only have to maintain a lifelong adherence but also, face the risk of toxic effects from the antiretroviral drugs [16]. Thus, there is a need to prioritize the assessment and prevention of the untoward effects of these drugs on HIV-positive clients to forestall the negative impact on their quality of life following ART use. Urinary Neutrophil Gelatinase-Associated Lipocalin (NGAL) or lipocalin 2 has been effective as an early and sensitive marker for monitoring the status and treatment of different renal conditions that reflect deficiencies in glomerular filtration barrier, proximal tubule reabsorption, and distal nephrons. Cystatin C has also been found to reflect effects on the glomerular filtration rate [17,18]. This study, therefore, estimated serum levels of hepatic enzymes, NGAL and cystatin C and lipid to explore the association between renal dysfunction, hepatoxicity as well as dyslipidaemia and the use of TDF-based ART in Nigeria. Findings from this study will be expedient for reviewing clinical practice guidelines on drug monitoring and treatment with ARVs, informing further research on new drug development and mitigation of the toxic effects of ARVs.
Methods
This study was a prospective cohort of adult HIV positive patients recently enrolled into HIV testing and treatment programme in University of Port Harcourt Teaching Hospital, Port Harcourt, Nigeria. All 104 patients were treatment naïve at the beginning of the study and selected with a simple random technique as have already been described in an initial study which shared clinical data from the same patients [19]. Whereas fifty-seven patients had Tenofovir-based ART -Tenofovir Disoproxil Fumarate, Efavirenz and Lamivudine (group I), forty-seven patients were on non-Tenofovirbased ART - Zidovudine, Lamivudine, Nevirapine (group II). All Patients were 18years and above and those who were pregnant, had chronic medical conditions (diabetes, hypertension, baseline renal abnormality or disease) or used alternative medicines were excluded from the study [19]. Ethical approval was sought and obtained from the ethical review board of the University of Port Harcourt, Port Harcourt as part of an already published study [19]. Participation in the study was voluntary, written informed consent was taken from participants and confidentiality was maintained throughout the study.
Blood and freshly voided urine samples were collected for determination of parameters at baseline, 16 weeks and 24 weeks. At all visits, a brief clinical history was taken, and physical examination done; adherence to medications was also assessed and recorded. Biomarkers of renal function, NGAL and cystatin C, were estimated from the urine samples. From the venous blood collected from each patient serum was derived for determination of the following parameters: Aspartate aminotransferase (AST), alanine aminotransferase (ALT), alkaline phosphatase (ALP), Total protein (TP), Albumin (ALB), High-density lipoproteins (HDL), low-density lipoproteins (LDL) and Cholesterol (CHL) (all taken before breakfast). Samples were collected in appropriate bottles and labelled with a unique study number; in addition, the date and time of the sample collection, study arm, ART drug regimen, length of treatment and the corresponding nameless results were documented in data sheets. Standard procedures were employed in processing the samples for the various tests. Abnormal cystatin C (Normal: 62.50 – 2000 ng/ml or µg/L 0.0625-2mg/L = 0.51–0.98) and NGAL (Normal: 7.81–500pg/ml) levels were those above the normal ranges and, the prevalence of normal and abnormal NGAL and Cystatin levels was compared across the two treatment groups.
In this study, Chronic Kidney Disease-Epidemiology Collaboration (CKD-EPI) Cystatin C formula – estimated glomerular filtration rate (eGFR) = 133 ×min (Scys/0.8, 1)-0.499 × max (Scyr /0.8, 1) ×0.996Age × 0.932(if female) - was applied to determine GFR; where Scys (standardized serum Cystatin C in mg/l) min indicates minimum Scys/0.8 or 1, Scys max indicates maximum Scys/0.8 or 1 and age = years. eGFR < 60 persisting to the 16th or 24th week was regarded as CKD [19]. Data were analysed with Statistical Package for Social Sciences (SPSS) version 22.0 (IBM Corp., Armonk, New York, USA). Continuous variables were expressed in medians as well as means ± SD, whereas categorical variables were presented as frequencies and percentages. Odds ratio were applied to estimate the magnitude of the association between exposure to TDF and prevalence of abnormal cystatin C and NGAL levels; while McNemar and matched odds ratio was applied for the increase in the prevalence/frequency of abnormal cystatin C and NGAL levels between initial and subsequent visits. Cochran’s Q test was used to elicit if the difference in the proportion of patients with abnormal urine biomarkers (cystatin C and NGAL) between repeated visits was significant within each group of patients and was followed by a post-hoc analysis where significant. A one-way analysis of variance of repeated measures was applied to deduce if the difference in mean serum parameters between visits was significant within in each group. Yates correction was applied where more than 20% of the cells had expected values < 5. With Chi-square test difference in proportions was elicited while Student t-test was employed to test the difference between means with two-sided significance level set at <0.05.
Results
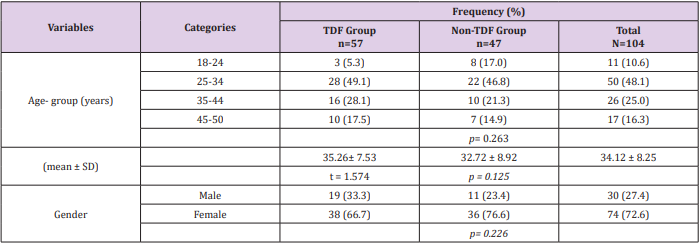
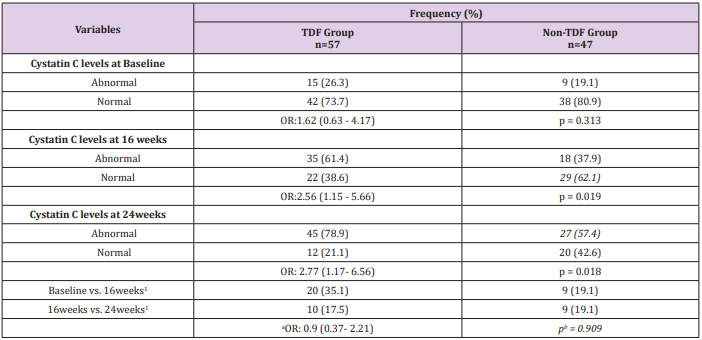
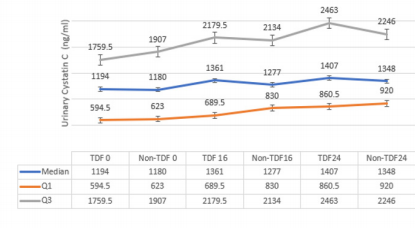
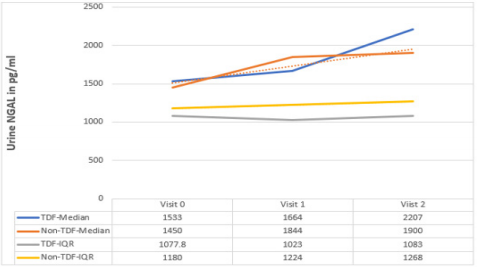
Sex and age distribution did not vary significantly between the two treatment groups (Table 1). Among the TDF group urine cystatin C increased from 1194ng/ml at baseline to 1407ng/ml at 24 weeks following commencement of ARVs, while lower values of 1180ng/ml and 1348ng/ml were recorded among the nonTDF group (Figure 1). There was a gradual increase in the median values of urine NGAL from baseline to the 24th week after the commencement of ARVs. The rise was more rapid among the TDF than the non-TDF group from the 16th week to 24th week. However, NGAL level at baseline was higher among the TDF-group (Figure 2). The majority (78.9%) of TDF-exposed patients had abnormal levels of cystatin C at 24 weeks; tenofovir-exposed patients were almost three times as likely as the non-exposed to have abnormal levels; OR: 2.77 (1.17- 6.56). About two-fifths (37.9%) of non-TDF exposed had abnormal levels however, TDF-exposed were more than twice more likely to have abnormal levels of cystatin C than others; OR: 2.56(1.15 - 5.66). The frequency of abnormal cystatin C levels increased between visits and was higher for the TDF group, however, across the two treatment groups increase in abnormal cystatin C levels did not vary significantly, OR=0.90 (0.37- 2.21) (Table 2).
Table 2: Abnormal Cystatin C levels for Both Groups
Note: Normal: 62.50 – 2000ng/ml, abnormal >2000ng/ml; 1: Increase in the frequency of abnormal cystatin C levels between visits; *OR: odds ratio; p= chi-square p-value; a : OR for matched pairs; b : p-value for McNemar chi-square with Yates correction; Cochran’s
Q test for TDF group - 6.23, p=0.035; Cochran’s Q test for Non-TDF group –2.07, p=0.356.
Figure 1: Urine concentration of Cystatin C at 0, 16 and 24 weeks for both Groups.
Note: 0: at baseline; 16: at 16 weeks; 24: 24 weeks; Normal: 62.50 – 2000ng/ml; Q1:1st quartile; Q3: 2nd quartile.
Figure 2: Urine concentration of NGAL at 0, 16 and 24 weeks both Groups.
Note: 0: at baseline; 1: at 16 weeks; 2: 24 weeks; Normal: 7.81 – 500pg/ml; IQR: interquartile range.
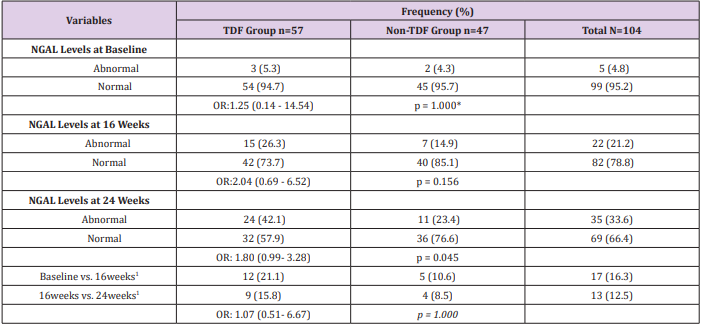
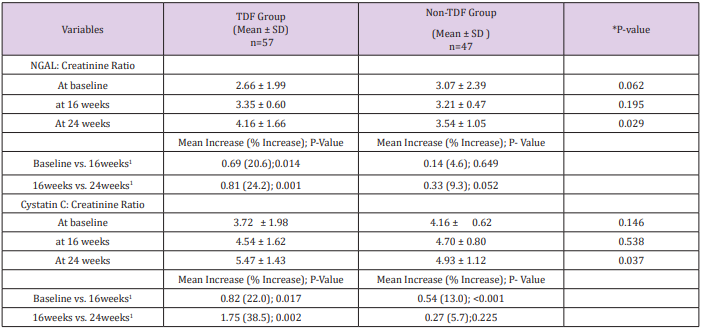
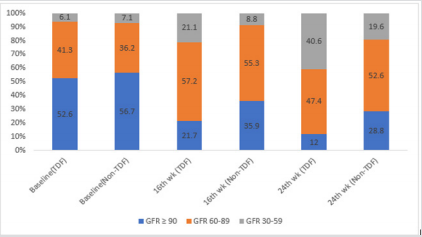
At baseline, less than half (47.4%, 43.3%) of the patients on either tenofovir or non-tenofovir ARV regimen had renal impairment. While just over a quarter (21.1%) of the TDF group had CKD at 16 weeks, less than one-tenth of the non-TDF group (8.8%) had renal function reflecting eGFR <60ml/min/1.73m2 were already at the stage of chronic kidney disease. Two-fifth versus just less than half of this figure (40.6% versus19.6%) of the TDF and non-TDF groups respectively had chronic kidney disease by the 24th week. Statistically significant difference was recorded when both groups were compared at 16 and 24weeks; p=0.004, p=0.019 (Figure 3). Proportions of TDF group with abnormal NGAL levels at baseline and 16 weeks were higher than the non-TDF group, however, the association between abnormal NGAL levels and the use of TDF was not statistically significant (p>0.05). Two-fifth (42.1%) of TDF-exposed patients had abnormal levels of NGAL at 24 weeks, and they were almost twice as likely as the non-exposed to have abnormal levels; OR: 1.80 (0.99- 3.28). The increase in the frequency of abnormal NGAL levels between visits did not differ significantly across the two treatment groups, matched OR: 1.07 (0.51- 6.67) (Table 3). The mean NGAL-Creatinine ratio (NCR) at 16 weeks was not significantly different between the two groups, however, the TDF group had higher NCR than the control group at 24 weeks (4.16 ± 1.66µg/g vs. 3.54 ± 1.05µg/g; p=0.029). The pairwise mean increase in NCR was significant only for the TDF group with at least one-fifth (20.6%, 24.2%) increase between visits. Similarly, the mean Cystatin C-Creatinine Ratio (CCR) at 24 weeks (5.47 ± 1.43µg/g vs. 4.93 ± 1.12µg/g; p=0.037) was higher for the TDF group than the non-TDF group. The mean values of CCR increased significantly between baseline and 16th week for both groups, however, the increase was significant only for the TDF group from 16th to 24th week (p=0.002) (Table 4).
Table 3: Abnormal NGAL levels for Both Groups
Note: OR: odds ratio; Normal: 7.81 – 500pg/ml, abnormal: >500pg/ml; 1: Increase in frequency of abnormal Cystatin C levels between visits; Cochran’s Q test for TDF group - 8.00, p=0.018; Cochran’s Q test for Non-TDF group –1.40, p=0.497; *Yates correction.
Table 4: NGAL and Cystatin C/Creatinine Ratio between the Groups
Note: 0: at baseline; 1: last 16weeks; 2: at 24 weeks; *p-value for difference between two independent means; CCR: Cystatin C/ creatinine ratio; NCR: NGAL/creatinine ratio
Figure 3: prevalence of abnormal GFRs among study participants.
Note: GFR: Glomerular filtration rate; renal impairment: GFR: <90ml/min/1.73m2 : CKD: GFR <60ml/min/1.73m2 persisting from baseline to 16th and/or 24 wk.; P-value for association between GFR and TDF use at baseline, 16th and 24th wk.: 0.907LR, 0.004, 0.019; LR- likelihood ratio chi-square.
Mean alanine aminotransferase was significantly higher among the TDF group; p=0.027,p<0.001, p=0.010. The mean serum aspartate aminotransferase at 24 weeks among TDF-exposed was higher than in the non-exposed patients. The difference was statistically significant; p<0.001. The mean serum alanine aminotransferase at 24 weeks among TDF-exposed was higher than in the non-exposed patients (19.72 ± 5.51 and 16.84 ± 5.60 respectively). The difference was statistically significant; p=0.011. Aspartate aminotransferase was higher among the TDF-exposed patients at 24 weeks. The mean concentration of serum direct bilirubin at 24 weeks among TDFexposed was significantly higher than in the non-exposed patients (6.07 ± 2.15 vs. 4.97 ± 1.42 respectively; p=0.003). Baseline values of all serum parameters, except for alanine aminotransferase, were comparable across the two groups. There was a significant increase in ALP and AST between baseline, 16th and 24th week among the TDG group. The non-TDF group only had a significant increase in ALP and AST from 16th to 24th week. AST did not vary significantly between baseline and 16th week among the TDF group. Total bilirubin remained relatively unchanged for both groups, whereas direct bilirubin leaped significantly for the TDF group to 6.07µmol/L, a value above normal at the 24th week.
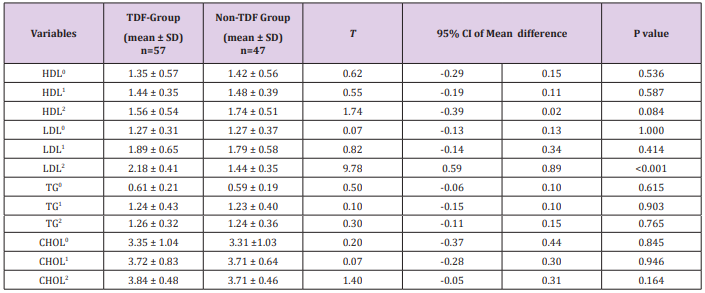
Although the overall F-test for the mean difference was significant for direct bilirubin, alkaline phosphatase and alanine aminotransferase the pairwise comparisons between the baseline and second visit mean values were not significant for alkaline phosphatase and alanine aminotransferase (Table 5). The mean concentration of serum HDL was higher for the non-TDF than the TDF group, however, the difference was not statistically significant; p > 0.05. The mean concentration of serum LDL at 24 weeks among TDF-exposed was higher than in the non-exposed patients (2.18 ± 0.41 and 1.44 ± 0.35 respectively; p<0.001). The mean concentrations of serum triglyceride and Cholesterol among TDFexposed were comparable across the two groups (p>0.05).
Table 5: Serum Parameters Indicative of Hepatic Function
Note: 0: at baseline; 1: last 16weeks; 2: at 24 weeks; HDL (1.0-1.3mmol/L); LDL (<2.59mmol/L); TG: triglyceride (0.06-0.61mmol/L); CHOL: total cholesterol (10 to11.1 mmol/L).
Discussion
This study revealed elevated levels of NGAL in both groups of patients. Even raised levels of these markers were detected from as early as 16 weeks after treatment started, signifying that they could be used as early indicators of renal dysfunction before a significant decline in renal function becomes obvious. The above findings as it pertains to NGAL are consistent with those of previous studies which exemplified its usefulness for detecting sub-clinical renal dysfunction [20–22]. More so, the NGAL levels among the TDFexposed group exceeded normal range and points to deteriorating renal function. In the follow-up period, NGAL rose precipitously such that greater proportions of TDF-exposed patients had abnormally elevated levels, however; the levels of Cystatin C were almost similar among both treatment groups. Thus, the values of Cystatin C among TDF-exposed patients were only marginally higher than those for the non-exposed group. While the underpinning factors behind the illusive congruence in Cystatin C values remain unclear, extra-renal inflammatory processes could give rise to elevated levels in both groups of patients, thereby, reducing its reliability for detecting renal tubular dysfunction. Nevertheless, rising levels of Cystatin C as well as NGAL have been noted to have a significant link with advancing chronic kidney disease [23]. In addition, an earlier study has demonstrated the usefulness of urinary NGAL in detecting renal impairment in HIV patients [20,21].
The findings of this study do not completely preclude a pretherapy renal dysfunction, as levels of NGAL were higher among the TDF-group at baseline, nonetheless, they experienced, in the follow-up period, a more expeditious surge in NGAL levels than the non-exposed sub-population. Prevalence of abnormal Cystatinbased GFR increased more significantly from baseline to 16th and 24th weeks among the tenofovir-exposed group than the nonexposed. The above find corroborates the untoward effect of TDF on renal function which has already been documented in previous research publications. [22,26,29,30] However, the fact that about the same proportion had subtle deranged function at baseline in both groups confirms a pre-assessment comparability among the groups. The levels of Urinary NGAL: creatinine ratios before the commencement of ARVs seemed better for the TDF group although the relative incremental differences between the baseline and subsequent values were higher for the TDF than the non-TDF group. A similar pattern was also observed for urinary cystatin C: creatinine ratio. The preceding probably implies that users of TDF had a worse renal function and is akin to what Rasmussen and his colleagues found out in Denmark [24] Therefore, routine clinical assessment for symptoms and features of renal toxicity could be enforced for all TDF-exposed patients.
Serum alanine transaminase at 16 and 24 weeks were significantly higher in the tenofovir group. However, serum alanine aminotransferase remained within normal limits during the followup period. Similarly, the values of serum alkaline phosphatase were higher for the TDF-exposed group and continuously increased from baseline among all patients; although unlike alanine aminotransferase, alkaline phosphatase was considerably higher than acceptable levels from the second visit. Similarly, the use of Tenofovir has been recognized to be associated with increased serum alkaline phosphatase levels among HIV patients [25]. Aspartate aminotransferase was also higher for the TDF-exposed group, although the difference in means was only significant at the last visit. Higher levels of liver enzymes allude to stress that renal dysfunction might have placed on hepatic cells, besides the direct effect of the drugs on liver cells during metabolism. This often accelerates the rate of progression of renal disease. Direct bilirubin levels were significantly higher among tenofovir users at the third visit, at which time it was also higher than normal levels, ensuing from a precipitous rise after 8weeks. Thus, it was impossible to entirely exclude hepatocellular damage; more so, gradually increasing levels of aspartate and alanine aminotransferases were observed from baseline to the last visit. Nonetheless, almost all baseline values of hepatic function indices were nearly the same between TDF and non-TDF groups. The above finding suggests that hepatic function prior to ART initiation was similar in the two groups. Among the TDF group, AST remained about the same between the baseline and the 16th week. The finding on aspartate aminotransferase is similar to that reported from a previous study in which levels of AST did not change significantly, following a period of treatment with tenofovir/lamivudine regimen [26].
Most mean lipid values were virtually the same in both groups of patients in this study; which suggests that dyslipidaemia was not a major problem for the patients on tenofovir. Probably, a longer period of follow-up is required for any significant changes in lipid metabolism to be detected among these patients on tenofovir. Nonetheless, serum LDL levels at the last visit were significantly higher among TDF group. While there is a debate about how serum lipids, especially cholesterol, increase the risk for cardiovascular disease in patients on ART [27], the serum lipid profile appeared normal and indicates a low cardiovascular risk. Conversely, a randomized clinical trial conducted to compare metabolic parameters after 48 weeks of standard- and low-dose Stavudine therapy and tenofovir disoproxil fumarate therapy among HIV positive South Africans revealed that TDF caused raised lipid levels [28]. Also, another study in which TDF replaced Stavudine reported an increase in lipid profiles among the patients [29] However, other studies have noted a decline in lipids following the administration of TDF [26,30]. Impending abnormality in lipid metabolism is not entirely inexorable among patients in this study, as high levels of alkaline phosphatase recorded among the tenofovir users implies on-going subtle liver dysfunction that could invariably interfere with lipid metabolism. This was not a multicentre study and may have been limited by a selection bias.
Conclusion
This study highlighted the risk of developing nephrotoxicity and hepatoxicity among patients on tenofovir-based antiretroviral therapy. The results of this study showed that TDF-exposed patients are more likely to develop renal impairment than others even though; baseline renal impairment could not be excluded for this group of patients. All in all, the risk of TDF drug toxicity was more pronounced on the kidneys than the liver, which probably was affected as a compensatory mechanism for gradual but significant renal dysfunction. Pre-ART commencement and on-ART screening/monitoring for baseline renal /liver status and TDF-associated nephrotoxicity and hepatoxicity should be prioritized among HIV clients.
More BJSTR Articles : https://biomedres01.blogspot.com/

No comments:
Post a Comment
Note: Only a member of this blog may post a comment.