Association of Chemerin rs17173608 and Vaspin rs2236242 Polymorphisms with Type Two Diabetes Mellitus and its Impact on their Corresponding Serum Levels in Egyptian Population
Type-2 diabetes mellitus (T2DM) is an endocrine disease having a significant genetic component. Polymorphisms of many genes may affect genetic susceptibility of the disease that is characterized by insulin resistance and islet disorder [1]. Several lines of evidence suggest that genetic polymorphism plays a pivotal role in the pathogenesis of a wide range of human disorders including cancers, diabetes, cardiovascular disorders, kidney diseases, and neurodegenerative diseases [2]. Obesity and type-2 diabetes mellitus (T2DM) are related to dysregulation of adipokines. Recent researches have shown that novel adipokine chemerin is involved in regulation of inflammation, adipogenesis and glucose metabolism by functioning as an endocrine signaling molecule [3]. Chemerin serves as a potent chemoattractant when acting as a ligand on cells expressing Chemerin receptors. White adipose tissue had high expression of both chemerin and its receptor CMKLR1 (chemokine-like receptor1), confirming that they serve as a primary source of chemerin.
Furthermore, Chemerin stimulates lipolysis by direct activation of hormone-sensitive lipase in mature white adipose cells [4]. Chemerin levels have been proven to have a direct positive correlation with adiposity indices. It has been linked with visceral obesity and resultant cardiovascular disease [5]. Chemerin influences adipose tissue development, inflammation, and glucose homeostasis and may contribute to the metabolic derangement characteristic of obesity and obesity-related diseases. Disruption of chemerin gene is associated with glucose intolerant and decreased glucose-stimulated insulin secretion as well as decreased skeletal muscle and white adipose tissue glucose uptake [6]. Moreover, it may be involved in cross-talk between adipose tissue and skeletal muscle contributing to the negative relationship between obesity and insulin sensitivity [7]. Chemerin is located on chromosome b7q36.1 and is composed of 6 exons and 5 introns, which encodes a protein of 163 amino acids [8]. chemerin rs17173608 (T/G) is in the intron 3, it is suggested that this single-nucleotide polymorphisms (SNPs) probably affect only gene expression and not the function of the gene product [9].
In recent years, several polymorphisms in candidate genes such as adipokines that may influence susceptibility to T2DM [10]. Chemerin gene polymorphisms were studied in patients with metabolic syndrome and diabetes [11]. Vaspin is a recently identified novel adipokine related to high expression in adipose tissue of obese and T2DM patients and insulin sensitivity [12]. The precise mechanism of vaspin in the body is not well known [12]. This may be due to inhibition of proteases that degrade antihyperglycemic and anorexigenic molecules [13] or anti-inflammatory effect [14]. Thus far, it is not distinct whether elevated vaspin levels represent a cause or the consequence of T2DM. The vaspin gene is located on chromosome 14q32.13 and consists of 6 exons and 5 introns. A single nucleotide polymorphism in intron 4 of a vaspin gene (its approved code by the HUGO Gene Nomenclature Committee is SERPINA12), vaspin rs2236242, was found to be strongly associated with diabetes [15]. The target of this study is to appraise the correlation between chemerin rs17173608 and vaspin rs2236242 polymorphism and the serum level of their corresponding adipokines, chemerin and vaspin and to assess the influence of these polymorphisms on the risk of T2DM in a sample of Egyptian population.
Subjects and Methods
Subjects
A total of 350 participants (181 male and 169 female) were enrolled in the study: 210 patients with T2DM and 140 age and sex matched nondiabetic healthy control subjects. 210 T2DM obese patients without complications were recruited from admitted patients of the internal medicine department of Kasr Al Ainy University Hospitals. 140 Non-diabetic subjects were randomly recruited from the local population Cairo city to act as control. They had normal fasting blood glucose levels, were not suffering any health problems, and had a negative history for T2DM and CVD. All participants gave their informed consent prior to participation, and the study was conducted in accordance with the approval of the Ethics Committee of the Faculty of Pharmacy, cairo University, Egypt.
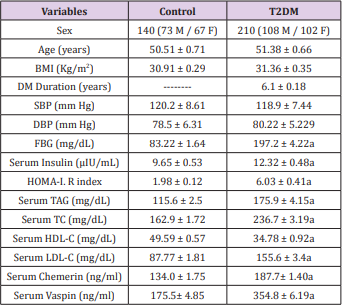
A detailed medical history and drug treatment(s) were collected for all subjects. The following exclusion criteria were used for all study participants: Patients suffering from T1DM, insulin treatment, thyroid, hepatic, acute infectious diseases, acute or chronic inflammatory disease, autoimmune disease, any hematologic disorder (assessed by complete blood count for every participant), and cancer were excluded from this study. Both the nondiabetic control group and the diabetic group were selected to have matching BMI and had a similar distribution of sex and age. The characteristics and biochemical data of patients and healthy controls are summarized in Table 1.
Table 1: Clinical and Hemodynamic Characteristics of Participants.
Source: T2DM: Type 2 Diabetes Mellitus; BMI: Body Mass Index; FBG: Fasting Blood Glucose; TAG: Triacylglycerol; TC: Total Cholesterol; HDL-C: High-Density Lipoprotein; LDL-C: LowDensity Lipoprotein Cholesterol.
Data are given as mean + SEM
aSignificant difference from control group at P < 0.05.
Blood Sampling and Laboratory Assays
About 8 mL of fasting venous blood was obtained from all participants. Aliquots of blood were collected on EDTA for estimation of plasma glucose and extraction of DNA. The remaining portion of the blood samples were collected in serum separation tubes for determination of insulin, total cholesterol (TC), low density lipoprotein cholesterol (LDL-C), high density lipoprotein cholesterol (HDL-C), and triacylglycerol (TAG) using standard laboratory methods. Serum chemerin and serum vaspin levels were measured by an enzyme linked immunosorbent assay (Chemerin Human ELISA; Quantikin R and D System, USA) [16] and (vaspin ELISA RayBio, USA) [17]. The homeostasis model assessment of insulin resistance index (HOMA-IR) was calculated from fasting insulin and glucose levels as described by [18].
Genotyping of Polymorphisms
Genomic DNA was extracted from whole blood using DNA extraction kit and stored at -80°C in aliquots until required. This was done using TIANamp Genomic DNA kit (Beijing, China) according to the manufacturer’s instructions. The concentration of the extracted DNA was determined by using Qubit 2.0 Fluorometer. The chemerin (rs17173608) and vaspin (rs2236242) SNP polymorphisms were detected using Tetra amplification refractory mutation system polymerase chain reaction (T-ARMS-PCR) [13]. using the following primers: the primers for chemerin (rs17173608) were Forward inner (G allele): 5’-ATTGCTATAGTCCAGTGCCCTTCG-3’, reverse inner (T allele):5’-CCAGTTCCCTCTGTCGGCTTAA-3’, forward outer: 5’-GTCAGACCCATGCAGTTTTCAAAC-3’, reverse outer: 5’-GAGTTCCTCTCTCAAGCATCAGGG-3’. The primers for vaspin rs2236242 were forward inner (T allele) 5’AAGACGCCGCTTCTGTGCACT3’, reverse inner (A allele) 5’CACAGGGACCCAGGATAACTTGCT3’, forward outer 5’GGAGGCAGACCAGGCACTAGAAA3’ and reverse outer 5’ACCATCTCTCTGGCTTCAGGCTTC3’
For chemerin (rs17173608) PCR amplification was carried out in 25μl reaction mixture using 100ng DNA, 0.5μl dNTP 10mmol/l, 0.75μl MgCl2 50mmol/l, 10pmol/μl of each primer, 0.3U Taq DNA polymerase 5 U/μl (Qiagene). The PCR cycling condition was as follows: an initial denaturation for 5min at 95°C, followed by 30 amplification cycles each of 90s, 30s at 95°C, 30s at 58°C, and 30s at 70°C, and then a final step for 10min at 70°C was performed. PCR products were detected on 2% agarose gel stained with ethidium bromide. The amplification gives products of 262bp for G allele, 322bp for T allele, and 549bp for two outer primers (control band). For vaspin rs2236242 amplification, an initial denaturation of 5min at 95°C was followed by 30 amplification cycles each of 90s with 30s at 95°C, 30s at 62°C, and 30s at 72°C, and then a final step for 10min at 72°C was performed. The amplification gives products of 174bp for the T allele, 248bp for the A allele, and 378bp for the control band.
Statistical Analysis
The distribution of the alleles of chemerin (rs17173608 T/G) and vaspin (rs2236242 T/A) SNPs were tested for Hardy-Weinberg equilibrium (P > 0.05). Proportions of genotypes of alleles were compared by X2 analysis, Odd ratios (ORs) and 95% confidence intervals (CI). Descriptive statistics were computed for all variables. The results were expressed as means ± SEM. Differences in serum vaspin and chemerin concentrations between individuals with different genotypes were tested by Student’s t-test. The significance level was set at 0.05 or less. All statistical analyses were performed with Graphpad prism version 5.
Results
Table 1 represent the 350 participants which were included in the current study with their clinical characteristics and all predictable risk factors for obesity complications, such as BMI, hypertension (distinct as a systolic blood pressure (BP) 140mmHg, a diastolic BP 90 mmHg, or both), FBG, insulin, and lipid profile (TC, HDL, and TAG) (P < 0.05). As revealed in Table 1, there was no significant difference in the sex distribution, age, and BMI between the studied groups. Type 2 diabetic patients (T2DM) showed significantly higher levels of serum fasting blood glucose, serum insulin, as well as HOMA-IR compared with normal subjects. Among the lipid profiles, the levels of TC, LDL-C, and TAG were significantly higher in T2DM subjects than controls. Whereas levels of HDL-C were lower in T2DM patients than controls. In the present study the serum chemerin level in T2DM patients showed significant increase to 134.0 ± 1.75 ng/mL than the healthy control group 187.7± 1.40ng/mL (P ≤ 0.05) as well as serum vaspin levels revealed significant increase in T2DM patient 354.8 ± 6.19ng/mL in comparison to the healthy control group 175.5± 4.85ng/mL.
Genotypes and Allele Distribution of Chemerin Gene rs 17173608 T/G
The genotype distributions chemerin rs 17173608 T/G SNP agreed with those expected from Hardy–Weinberg equilibrium in all study groups. Results existing in Table 2 specified that there is a significant difference in the frequencies of chemerin rs 17173608 combined genotype (TG+GG) and G allele in type 2 diabetes patients in comparison to the controls (63.4% versus 30%) X2 = 37.33, P < 0.0001 and (61% versus 26.4%), X2 = 80.36 P < 0.0001respectively
Table 2: Differences in allele distribution and genotype frequency of chemerin gene single nucleotide polymorphism (SNP) rs 17173608 T/G between control and TDM groups.
Source: OR, odds ratio; 95% CI, 95% confidence interval.
Results are expressed as number and in parentheses percent. P < 0.05 is considered statistically significant after adjusting for age, sex, and BMI. Chi squared (X2 ) test was performed to compare categorical data.
Association Between Chemerin Gene rs17173608 T/G Polymorphisms with T2DM
Subjects with the TG/GG genotype and G allele were at increased risk for T2DM (OR = 4.03, CI = 2.55 - 6.37, P < 0.0001) and (OR = 4.35, CI= 3.12- 6.04, P < 0.0001) respectively in comparison with subjects having the TT genotype and T allele (Table 2).
Correlation Between Chemerin Gene rs17173608 T/G Polymorphisms and Chemerin Serum Levels
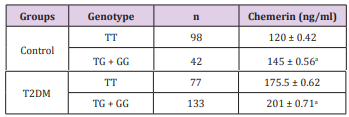
As illustrated in Table 3 it was revealed that serum level of chemerin in patients with TG/GG genotype in the T2DM was higher than those with the TT genotype with statistically significant difference (201 ± 0.71ng/mL and 175.5 ± 0.62ng/mL, respectively) (P ≤ 0.05). Similarly the serum chemerin level of genotype TG/GG carriers were significantly higher than that of the TT genotype in the healthy control (145 ± 0.56ng/mL and 120 ± 0.42ng/mL, respectively) (P ≤ 0.05).
Table 3: Genotypes of chemerin gene rs 17173608 T/G gene polymorphism and serum chemerin in study groups.
Source: Data are given as mean ± SEM
aSignificant difference from TT genotype at P ≤ 0.05.
Correlation Between Vaspin rs2236242 T/A Polymorphisms and Vaspin Serum Level
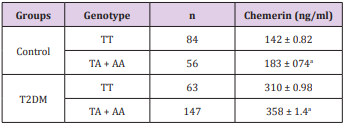
Subjects who carry TA/ AA genotype (n = 147) of T2DM group showed significantly higher serum apelin values (358 ± 1.4ang/ mL) than TT (n = 63) (310 ± 0.98ng/mL). Similarly, controls with TA/ AA genotype (n = 56) showed increased levels of serum apelin (183 ± 074ang/mL) compared with TT (n = 84) (142 ± 0.82ng/mL) (Table 5).
Table 4: Differences in allele distribution and genotype frequency of vaspin rs2236242 single nucleotide polymorphism (SNP) T/A between control and TDM groups.
Table 5: Genotypes of Vaspin gene rs 2236242 T/A gene polymorphism and serum vaspin in study groups.
Source: Data are given as mean ± SEM
aSignificant difference from TT genotype at P ≤ 0.05.
Discussion
In recent decades, the incidence of patients with T2DM has significantly increased. Genetic components as well as environmental factors have been reported to contribute to the development of T2DM (Ben-Haroush et al., 2004). Polymorphisms in some adipokines genes have been intensively investigated in patients with diabetes in various populations. Accordingly, our main objective was to explore the possible association between of chemerin rs17173608 and vaspin rs 2236242 genes polymorphisms with the corresponding serum levels and susceptibility to T2DM in an Egyptian population. To best of our knowledge, this is the first study that revealed the association of chemerin and vaspin polymorphism with T2DM specifically in difference to other studies which investigated the association of chemerin rs17173608 with metabolic syndrome generally. Chemerin is a newly-discovered adipocytokine, which is closely associated with the occurrence of metabolic diseases, such as type 2 diabetes mellitus, obesity and metabolic syndrome, it has been expressed in high level in white adipose [19].
It has proposed that increase of the chemerin level in insulinresistant subjects is apparently as a compensatory mechanism. In consistent with this assumption, some of studies have inspected an association between increased serum chemerin concentrations with progression of T2DM [20]. The current study revealed that serum chemerin was significantly elevated in T2DM patients compared with controls. This harmonizes with the study by Habib et al. [5], who conveyed that patients with T2DM had significantly higher chemerin levels compared with normal control individuals; El-Mesallamy et al. [21] and Weigert et al. [22] also reported the same finding. The outcomes of this study showed that the combined genotype (TG + GG) along with the minor G allele of chemerin rs17173608 polymorphism exhibited association with increased risk of T2DM in Egyptian population. These outcomes support the results of Taheri M. et al [23]. However, other studies [24] found that the G allele was associated with lower visceral adipose tissue mass in non-obese thus no relation with metabolic syndrome diseases.
Furthermore, Hasanvand et al in a recent study regarding chemerin rs17173608 polymorphism showed that genotypes and alleles were equally distributed between Gestational diabetes mellitus (GDM) and normal control groups thus no difference was found in the susceptibility to GDM in association with this variant [9]. In the present study, the carriers of chemerin rs17173608 polymorphism G allele had significantly higher chemerin serum levels, hence, the polymorphism of chemerin was correlated with its circulating concentrations, therefore chemerin rs17173608 gene polymorphism could affect the expression of chemerin and its serum level. In consistent with this hypothesis, some of studies have examined an association between increased serum chemerin concentrations with development of T2DM [11,25]. Regarding vaspin polymorphism our results indicated significantly increase in the serum levels of vaspin in patients with T2DM when compared to the normal control one in consistent with Yang et al. [26] and other studies [27,28]. While on the other side Youn et al results stated that there is no significant difference in vaspin serum levels between the control group and patients suffering from T2DM [29].
The existing study revealed that the TA + AA genotype of vaspin rs2236242 polymorphism was significantly associated with increased T2DM risk. These consequences agree with the results of Kempf et al. [15]. In contrast, others research papers exhibited that the combined genotype TA +AA and the minor A allele was defending against metabolic syndrome [11,23]. Concerning the correlation among serum vaspin and different polymorphic forms of vaspin rs2236242, our current study revealed that the carriers of vaspin rs2236242 polymorphism A allele and combined genotype TA + AA had significantly higher vaspin serum levels in comparison to the TT genotype. These results were contradictory to the outcomes of Alnory et al. [30] who reported that there is no significant difference in the vaspin level between different genotypes forms of vaspin rs2236242. In conclusion, our study in the Egyptian population indicated that chemerin rs17173608 and vaspin rs2236242 polymorphisms are associated with susceptibility of T2DM related with elevated serum chemerin and vaspin levels suggesting that these polymorphisms affect chemerin and vaspin expression.
More BJSTR Articles : https://biomedres01.blogspot.com/


No comments:
Post a Comment
Note: Only a member of this blog may post a comment.