Application of Lean Six Sigma Methodologies and In-Vitro Dissolution Studies for Simultaneous Determination of Cefdinir and Sodium Benzoate by RP-HPLC and UPLC Methods in their Dosage Forms
Introduction
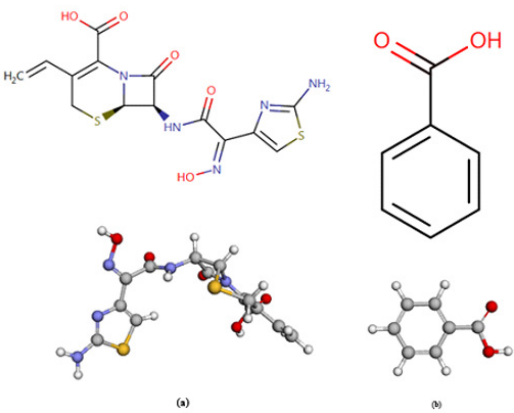
Recently, the use of application of quality tools and lean six sigma methodologies are widespread in most of the industries, especially pharmaceutical industries that are intended to reduce waste time, eliminate defects in the process and increase the capability of the process [1]. Simultaneous determination of binary mixture analytes in one reaction system using the same reagent and columns has become fascinating feature and very useful in modern analytical chemistry. This leads to saving money and effort of analysts as well as it is beneficial for quality control laboratory to analysis and release batch of product before the deadline. So, the current work introduces a new RP-HPLC and UPLC methods for simultaneous quantification of cefdinir and sodium benzoate in their pure and dosage forms, application of lean six sigma methodologies and in vitro dissolution studies to compare among different suppliers and manufacturers. Cefdinir (CFR) (Figure 1a) is a third-generation oral cephalosporin antibiotic sold under the brand names Cefzon and Omnicef. It is chemically named as [6R- [6α, 7β (Z)]]-7-[[(2-amino4thiazolyl) (hydroxyimino)acetyl] amino]-3-ethenyl-8-oxo-5-thia1-azabicyclo [4.2.0] oct-2-ene2-carboxylic acid.
Cefdinir is a white to slightly brownish-yellow solid. It is slightly soluble in dilute hydrochloric acid and sparingly soluble in 0.1 M pH 7.0 phosphate buffer. The empirical formula is C14H13N5O5S2 and the molecular weight is 395.42 [2]. CFR belongs to a class of antibiotics called cephalosporins, which work for killing bacteria or halting their growth. CFR is prescribed to treat a wide range of bacterial infections, including certain types of pneumonia, sinusitis, bronchitis, strep throat, sore throat, middle-ear infections, and certain skin infections [2]. SDM is the chemical benzoate of soda (C7H5NaO2) (Figure 1b), produced by the neutralization of benzoic acid with sodium bicarbonate, sodium carbonate, or sodium hydroxide. The salt doesn’t occur naturally. The ingredient is used as an antimicrobial and as a flavoring agent used in food at levels not to exceed good manufacturing practice. Current usage results in a maximum level of 0.1 percent in food [3]. An HPLC method for determination of CFR is officially reported in the United States Pharmacopeia (USP) [4].
It is still a limited number of analytical methods that are reported for the determination of CFR individually or in combination with other drugs including High performance liquid chromatography (HPLC) [5-12], Ultra performance liquid chromatography (UPLC) [13], capillary electrophoresis and electrochemical methods [14,15], thin layer chromatography (TLC) [16], colorimetric and spectrophotometric [17-21], and comparative in vitro dissolution studies for cephalosporins [22,23]. Like CFR, SDM is officially reported in British Pharmacopeia (BP) [24] and United States Pharmacopeia (USP) including titration and HPLC. The literature review revealed that a variety of analytical methods have been reported for its determination in its pure drug and dosage forms using HPLC [25-27], Ultra performance liquid chromatography (UPLC) [28,29], HPTLC [30], Isoabsorption [31], and spectrophotometry [32,33]. For the best of our knowledge, there is no RP-HPLC and UPLC methods for the simultaneous determination of cefdinir and sodium benzoate in their pure, powder for oral suspension and capsule dosage forms without previous separation. Therefore, the main aim of this work is to establish this needed novel RP-HPLC and UPLC methods for the determination of binary mixture of CFR and SDM and application of lean six sigma methodologies, quality tools and comparative in vitro dissolution studies.
Experimental
Apparatus
Waters ACQUITY® Arc™ UPLC System, a quaternary liquid chromatography provides plug-and-play method compatibility for UPLC separations with 2489 UV/Vis Detector with Empower™ 3 Software. UV- 1800 double beam UV-Visible spectrophotometer (shimadzu-Japan) with the highest resolution and spectral bandwidth of (1nm from 190-1100 nm range) matched with 1 cm quartz cells, was used for all absorbance measurements. Perform data analysis by software (UV-Probe 2.5.2). Dissolution apparatus (PTWS 1220, Pharma Test Apparatebau AG, Germany) is used to study the dissolution profile. Climatic chamber (VOSTCH VP 1300, Germany) with SIMPATI 4.06 Software is qualified and calibrated under storage condition (40 ±2o C / 75 ±5 % RH). pH meter METTLER TOLEDO Seven Compact. Statistical analysis was performed using Minitab® 17.1.0 and validated Microsoft Excel sheet 2016.
Pure Samples
CFR API Corporation (Japan), covalent lab (India) and SDM were kindly supplied by Hikma pharmaceutical industries company, BeniSuef, Egypt with potency of 99.7%, 98.8% and 99.9%, respectively.
Pharmaceutical Formulations
Innovator Product Omnicef 125 mg per 5 mL POS and Omnicef 300 mg CAP are supplied by Hikma Pharmaceuticals which gained a license of Omnicef from Astellas Pharma (Japan). Generic product DINAR 125 mg per 5 mL POS and DINAR 300 mg CAP are purchased from Adweia company.
Reagents
Acetonitrile HPLC-grade, methanol HPLC-grade, purified water, potassium dihydrogen orthophosphate, sodium hydroxide, hydrochloric acid, hydrogen peroxide and orthophosphoric acid analytical grade, are procured from (Scharlau, Spain).
Solvent
Dissolve about 3.4gm potassium dihydrogen phosphate and 10.65gm disodium hydrogen phosphate in about 750 mL water. Adjust the pH to 7.0± 0.05 using phosphoric acid or 1N NaOH solution then add sufficient water to make 1000 mL.
Standard Solutions
Stock Standard Solution (1500 μg/mL of CFR and 1000 μg/mL SDM)
Accurately transfer 150 mg of CFR and 100 mg of CFR into 100 mL volumetric flask. Add about 70 mL of solvent. Sonicate for 10 min till dissolving then completes to volume with the same solvent and mix well.
Laboratory Prepared Mixture (250 μg/mL) of each of CFR and SDM
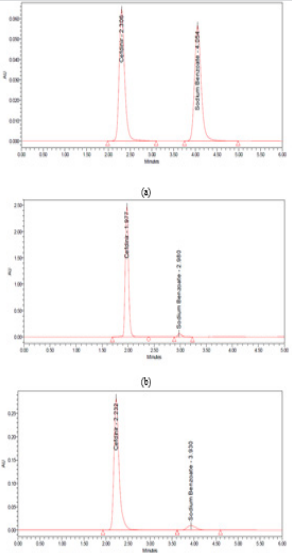
Due to the low concentration of SDM in the sample where CFR is twenty-five folds higher than SDM, so we have prepared a mixture of equal concentrations (250 μg/mL) of each of CFR and SDM using solvent as a blank to show the peak shape and to assure the separation quality (Figure 2a).
Working Standard Solution (750 μg/mL) of CFR and (30 μg/ mL) SDM
Accurately transfer 5 mL and 3 mL aliquot from each of the previously prepared stock standard solutions into 10-mL volumetric flasks. Complete to volume with the same solvent. Mix well and filter through 0.45 μm Nylon filter and inject into the chromatographic system (Figure 2 b & 2c).
Figure 2: chromatograms of (a) 250 µg/mL of CFR and SDM and 750:30 µg/mL of a mixture of CFR and SDM at (b) HPLC (c) UPLC.
Application to Pharmaceutical Formulation (Omnicef® and DINAR®125 mg/5mL POS)
Tabbing bottle to loosen powder, add water in two portions, shaking well after each addition, complete to the mark with water. Directly transfer from the bottle 3 mL (equivalent to 75 mg CFR and 3.0 mg SDM) into a 100-mL volumetric flask, add about 75 mL solvent, sonicate for 10 min till dissolved then complete to volume with the same solvent. Mix well and filter through 0.45 μm Nylon filter and inject into the chromatographic system.
Application to Pharmaceutical Formulation (Omnicef® and DINAR®300 mg CAP)
Weigh and empty 20 capsules and calculate the average content per capsule. Weigh accurately about the equivalent to 150 mg CFR from their contents. Then transfer completely to 200 mL volumetric flask with the aid of 150 mL solvent, sonicate for about 10 minutes and complete to volume with the same solvent and mix well. Filter through 0.45 μm Nylon filter and inject into the chromatographic system.
Chromatographic Conditions
Isocratic separation was performed at ambient temperature using Agilent XDB-C8 (4.6 mm x 250 mm) 5µm or equivalent, with a mobile phase consisting of acetonitrile: 0.05 M phosphate buffer solution pH 4.5 (50:50 v/v) at flow rate of 1.0 mL /minute and UV detection at 254 nm with injection volume of 10 μL for RP-HPLC. Waters CORTECS® C18 column (50 mm × 4.6 mm, 2.7 μm particle size) at flow rate 0.3 mL/min, injection volume 0.3 μL was used for RP-UPLC where the total run time was 6 min.
Construction of Calibration Curves
Separately transfer different dilutions from their corresponding stock standard solutions into separate series of 10 mL volumetric flasks covering the concentration ranges (50-1000 µg/mL) of CFR and (5-50 µg/mL) of SDM. Triplicate 10 and 0.3µL injections were injected for each concentration applying the recommended chromatographic conditions. The chromatograms were recorded, the peak areas of both CFR & SDM were estimated and the calibration curves relating the obtained integrated peak areas to the corresponding concentrations were constructed and the regression equations were computed.
Comparative in Vitro Dissolution Study
The main reason for making comparative in vitro dissolution study is to disclose any variation occurring in the final product market as change in inactive ingredients, change in raw material suppliers (as adding new supplier) or submission re-registration stability file product for ministry of health (MOH), so in the previous cases comparative in vitro dissolution study must be performed to release the drug products.
Dissolution Parameters
Apparatus: Type II (Paddle)
Dissolution medium volume: 0.05 M Phosphate buffer, pH 6.8
Speed: 50 rpm
Temperature: 37 ± 0.5 °C
Time: 10,20,30 and 45 minutes
Test Preparation
Place one unit in each vessel from the generic product and the innovator one, using sinker in case of capsule and immediately operate the apparatus at the rate specified. The automated system will withdraw the samples at time intervals, then drug release was measured using the chromatographic system.
After Reconstitution Studies and Accelerated Stability
Re-constitution stability study was conducted on the first new supplier batch under storage condition 5 ± 3o C in refrigerator for 14 days to provide information for the labelling on the preparation, storage condition, and in-use period of the constituted or diluted product. Accelerated stability studies intended to increase the rate of physical change or chemical degradation by using extravagant conditions of elevated temperature and humidity with the purpose of investigation degradation pathways and predicting shelf life were performed. These cases were tested: storage condition (40 ±2oC / 75 ±5 % RH) for six months; the first three primary validation batches, if reprocessing occurs in any batch, for post approval manufacturing changes batches, exceeding hold time limitation: If the batch exceeds the time allowed in any manufacturing stage and adding new suppliers [34].
Process Capability Six-pack Quality Tools for Normally Distributed Assay
Lean six sigma and quality tools play an important role regarding assessing and estimating change during the process, and thus can be useful, also to choose or modify the process in some of the stages of the product improvement, where current work is used to analyse the ability of comparison among various suppliers and follow-up the process during the past two years and assure that the Process Capability Index (Cpk) is > 1.33.
Results and Discussion
The present work discusses comparative in vitro dissolution studies for simultaneous determination of the co-formulated binary mixtures of CFR and SDM in their suspension and capsule dosage forms which will lead to a paradigm shift towards pharmaceutical analysis where it reduces wasted time, effort, reagents, and columns. Also, application of lean six sigma and quality tools will help the quality team to detect the defect and variation during the process, so that they can be eliminated easily before the end of the process. Several trials were developed to optimize affecting parameters and to obtain a good separation of the binary mixture of CFR and SDM. So different compositions of mobile phases with different ratios were tried such as methanol (100%); methanol: purified water (70:30, v/v); acetonitrile: purified water (70:30, v/v) and methanol: purified water (95:5, v/v). All solvents of the mobile phase were filtered through 0.45μm Nylon filter paper to remove particulate matter and degassed by sonication. Also, (0.2,0.3,0.8, 1.0, 1.5 and 2.0 mL/min) flow rates were tried. Preliminary studies have been involved trying C8, C18 reversed-phase columns. The best developing mobile phase of the system was found to be a mixture of acetonitrile: 0.05 M phosphate buffer solution pH 4.5 (50:50 v/v) at flow rate 1.0 and 0.3 mL /minute for HPLC and UPLC methods. The retention times are quite short and sufficiently separated. This selected developing system has allowed good separation with good Rt values without tailing of the separated bands and good theoretical plates and resolution.
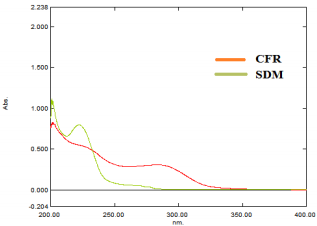
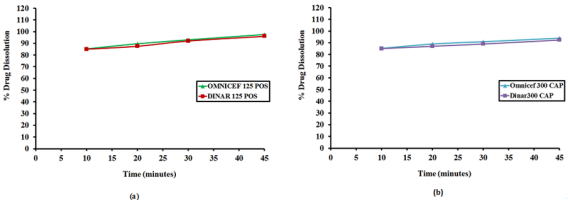
Wavelengths were scanned at (200 - 400 nm) for 15 µg/mL for both drugs, CFR and SDM in pure form (Figure 3), showing maximum absorbance at 283 nm and 222 nm, respectively. Besides, λmax for both drugs are 234 and 208 nm which are the intersection points of both drugs; were also tested. However, the wavelength 254 nm was selected for the separation of both drugs because it has maximum intensity and sensitivity. In vitro dissolution studies are considered as a major part of the pharmaceutical industry and regulatory agencies of powder for oral suspensions and capsule dosage forms for comparison of the release rate of the drug products and to demonstrate the quality of in vitro similarity [35]. The acceptance criteria of the dissolution for product release were estimated according to international guidelines and USP monograph comparison. In vitro dissolution profiles of drugs were recommended on three different dissolution mediums (pH 1-7.5) In case of the monograph is not available [36]. The best developing system was 900 mL 0.05 M phosphate buffer, pH 6.8 Type II (paddle) at speed rate of 50 rpm with time intervals; 10, 20, 30 and 45 minutes. In the present study, the percentage of drug released for dissolution media were >80% in 10 min. According to the FDA Guidance for Industry and EMA guidelines, for dissolution profiles to be considered similar as shown in Figure 4, where more than 85% of the drug is dissolved within 15 minutes, dissolution profiles may be accepted as similar without further mathematical evaluation of the similarity factor f2 [37].
Figure 4: Dissolution Profile of CFR from (a) Dinar 125 POS, the generic brand and Omnicef 125 POS, the Innovator brand and (b) Dinar 300 CAP, the generic brand and Omnicef 300 CAP, the Innovator brand.
Method Validation
The proposed method was validated, in accordance with ICH guidelines [38]. Regarding Linearity and range, LOD and LOQ, Accuracy and recovery, Precision (repeatability and intermediate precision), Robustness, Stability of the analytical solution, Formulation assay, system suitability, specificity.
Linearity and Range
In order to evaluate the linearity of an assay procedure, a series of standards at different concentrations of the target concentration were prepared. After running each preparation in triplicate, a linear regression analysis was performed on the average peak areas versus the concentrations of the levels studied. The linearity of the proposed methods was obtained over concentration range (50 - 1000 and 5-50 µg/mL) with coefficient of regression >0.999 for CFR and SDM, respectively. The linearity results are shown in Table 1.
Table 1: Regression and validation parameters of the proposed HPLC and UPLC methods for determination of CFR and SDM.
aLimit of detection (3.3× σ /Slope) and limit of quantitation (10× σ /Slope).
Limit of Detection and Quantitation
The limit of detection (LOD) and limit of quantitation were based on the standard deviation of the response and the slope and can be calculated as LOD=3.3×σ /slope and LOQ=10×σ /slope, where σ = the standard deviation of the response as listed in Table 1.
Accuracy and Recovery
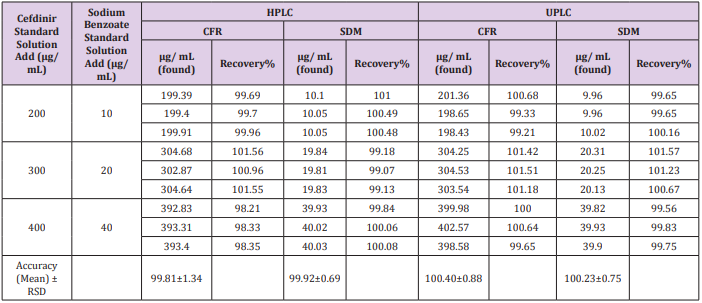
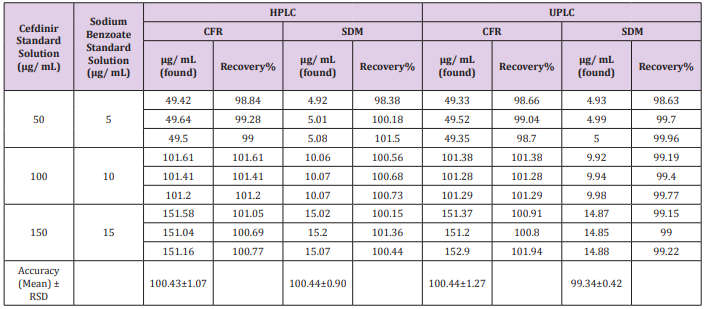
The recovery was calculated in triplicates of three concentrations (200, 300, 400 μg/mL) for CFR and (10, 20, 40 μg/ mL) for SDM within linearity at all different media comparing the individual peak response with that of the reference solution. The mean % recoveries for CFR and SDM were between (98.0 - 102%). Results are shown in (Table 2). Moreover, accuracy was evaluated by applying the standard addition technique to the samples with good recovery suggesting that there is no involvement from excipients as shown in Table 3.
Table 3: Determination of CFR and SDM in pharmaceutical formulation by the proposed methods and application of standard addition technique.
Precision
Repeatability was proceeded using 6 replicates of the standard solution of the compound being studied (750 μg/mL) for CFR and (30 μg/mL) for SDM in all different media. The system was precise as the relative standard deviation RSD ≤ 2%. High precision of the method was obtained as shown in Table 1. Intermediate precision (ruggedness). Intermediate precision expresses the within-laboratories variation parameters by RSD, evaluation has been tested for different days, different analysts and effect of use of different columns (different lots and/or suppliers). Good results were obtained as presented in Table 4.
Robustness
For measuring the capability of the method to remain unaffected by small, but deliberate, variations in method’s parameters such as: influence of variations of pH of the mobile phase (±0.2), Flow rate change (±0.1 mL/min), wave length change (254±2.0nm) and column temperature change (30,25˚C). Good results were gained as presented in Table 4.
Stability of the Analytical Solution
The method was proceeded to evaluate the stability assay of the standard solution when it was stored in a fridge and another part was stored at room temperature for 24 hours, then the solutions were tested against a freshly prepared standard; relative standard deviation should be less than 2%. Results are displayed in Table 4.
Formulation Assay
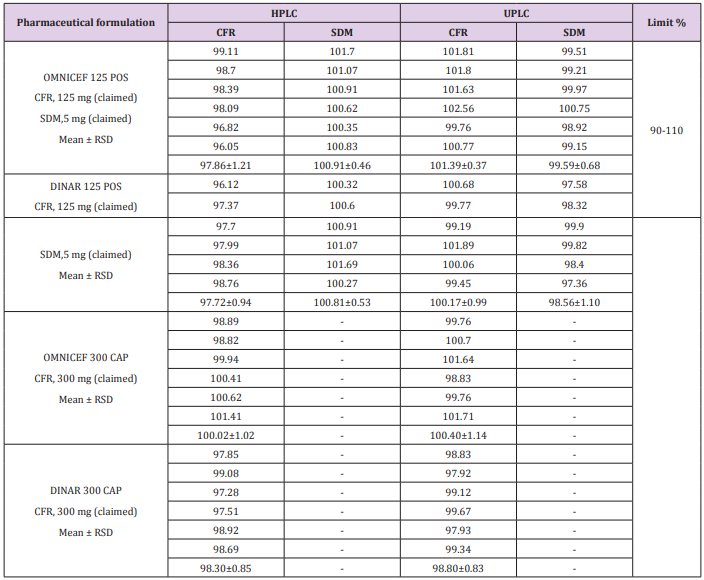
The proposed method was performed by assaying six samples from the commercially dosage form (OMNICEF®, DINAR®125 mg /5 mL POS and OMNICEF®, DINAR®300 mg CAP) to determine the assay of CFR and SDM. The obtained results are displayed in Table 5. indicating that the method is selective for the analytes without interference from the excipients used to formulate.
Table 5: Assay results for the determination of CFR and SDM in their dosage form by the proposed HPLC and UPLC methods.
System Suitability
Tests were based on the concept that chromatographic system, analytical operations and samples to be analyzed constitute an integral system that should be checked by calculating various parameters such as the number of theoretical plates (N), tailing factor (T), resolution (Rs), precision and selectivity (k’) to ensure the performance of the system. All calculated parameters were found within the acceptable limits indicating good selectivity of the method as listed in Table 6.
Specificity
Specificity is the ability to assess unequivocally the analyte in the presence of components that may be expected to be present such as impurities, degradation products and excipient. There must be inarguable data for a method to be specific. Specificity measures only the desired component without interference from other species which might be present; separation is not necessarily required. Also, the standard addition technique was applied by adding known concentration of pure form for both drugs to dosage form and the recovery of the added pure forms were calculated to check the specificity and selectivity of the method. The obtained results shown in Table 3 indicate no matrix interference.
Application of Comparative in vitro Dissolution Study for the Proposed Method
In vitro dissolution was carried out on two generic products viz., DINAR 125mg/5mL POS and DINAR 300 mg CAP dosage forms selecting dissolution parameters as described by FDA dissolution methods [39]. For comparative studies, the in vitro dissolution of innovator brand e.g., OMNICEF 125mg/5mL POS and OMNICEF 300 mg CAP dosage forms were performed at the same conditions and results were compared with those of generic brands. The quantitative release of drug at specified intervals from the product was determined using the validated HPLC and UPLC methods. The dissolution results which are summarized in Table 7 showed that the value of RSD % is less than 10 % at the initial point and less than 5 % for other intervals. Also, the in vitro dissolution profile and the cumulative percentage of generic and innovator products released were plotted against time (Figure 4a & 4b), The dissolution profile of generic brand showed similar behavior to the innovator one. There was an agreement that the f2 test is not necessary when the two products each provide at least 85% dissolution in 15 min. The percentage dissolved for all products was above 85% of the labeled claimed content from the very first sampling time.
Table 7: Cumulative % Dissolution profile of CFR in dosage forms using FDA dissolution media after minutes.
Application of Accelerated and after Reconstitution Studies
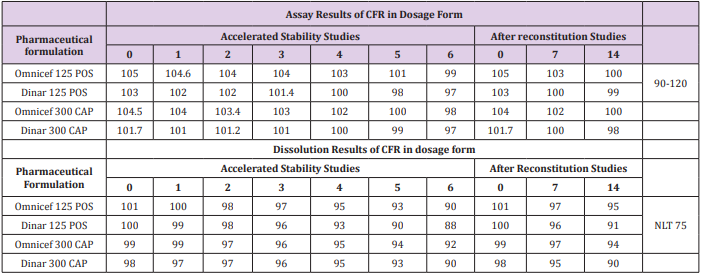
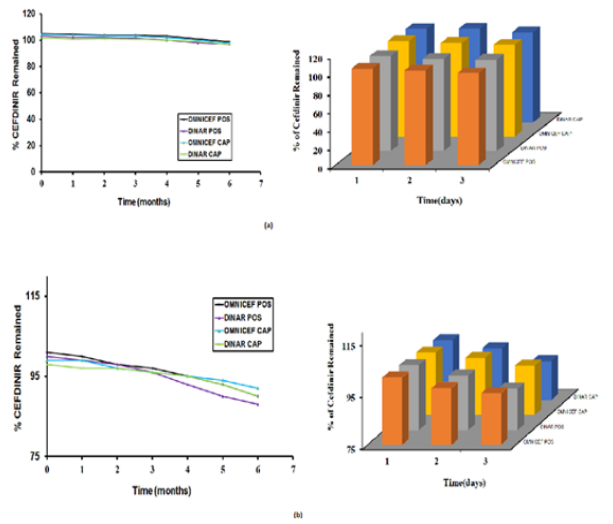
Accelerated stability studies were conducted at temperature 40 ± 2 OC & relative humidity 75 ± 5 % for 6 months and after reconstitution studies under 5 ± 3OC in refrigerator for 14 days (Figure 5a & 5b), includes that generic and innovator products attained their physical, chemical and microbiological attributes and no significant change occurred during the study period. The obtained results are shown in Table 8.
Table 8: Assay and dissolution results for accelerated stability and after reconstitution studies for the determination of CFR in dosage form by the proposed methods.
Figure 5: Cefdinir remained (%) of (a) assay and dissolution (b) of Omnicef 125 “POS”, Dinar 125 “POS” and Omnicef 300 mg “CAP”, Dinar 300 mg “CAP” Stored for Six Months at 40ºC & 75% RH and 14 days after reconstitution at 5±3ºC.
Application of Quality Control and Statistical Tool for Normally Distributed Assay
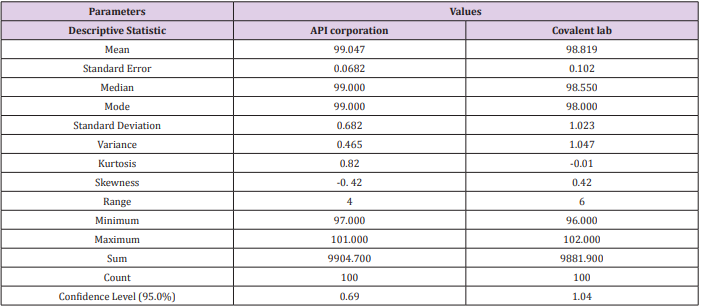
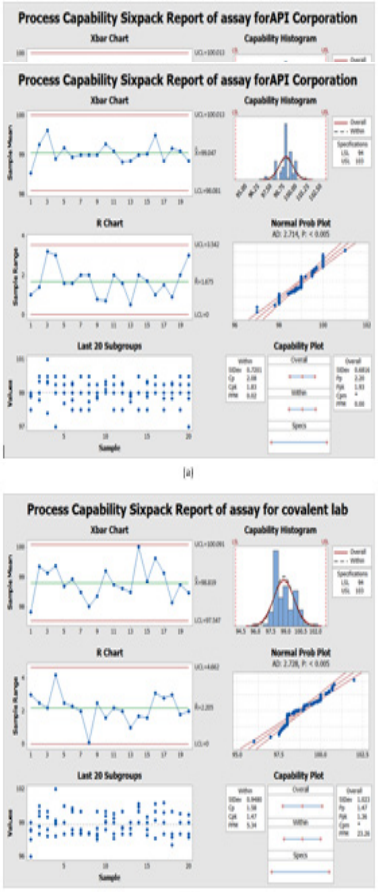
Data was collected for the last two years of 100 batches of assay for CFR as mentioned in Table 9 by our quality team for monitoring the manufacturing operation for different suppliers. Then, were measured using the Minitab program. Process capability six-pack analysis indicated that the data for the first supplier API corporation (Japan) is statistically capable and more accurate than the second supplier as Cpk is 1.83 (Figure 6a & 6b), means that it meets 6 sigma levels. Also, in the second supplier covalent lab (India) the process is normally distributed, within the control specification and statistical control as the Cpk is 1.47 i.e., it meets 4 sigma levels.
Figure 6: Process Capability Six-pack quality tools for normally distributed assay results of 100 batches of Cefdinir for comparison between two suppliers and (b) covalent lab (India) supplier using Minitab® 17.1.0.
Conclusion
Application of lean six sigma and quality tools were performed to detect and eliminate the defect through stages of process and comparison between the two suppliers. So, a specific, accurate and simple HPLC and UPLC methods were developed and properly validated according to the requirements of ICH guidelines for the simultaneous estimation of co-formulated binary mixtures of CFR and SDM in their suspension and capsule dosage forms. Comparative in vitro dissolution studies have been achieved for two generic brands; Dinar 125 POS & Dinar 300 CAP and hence, it was assumed equivalent to the innovator product of Omnicef 125 POS and Omnicef 300 CAP at FDA dissolution media and the two products were considered identical. Based on the above results, the analytical method is valid and can be used for regular routine analysis and stability study.
More BJSTR Articles: https://biomedres01.blogspot.com/





No comments:
Post a Comment
Note: Only a member of this blog may post a comment.