Near Chaos Graphic Images
Introduction
Chaos has emerged as a topic of study in the 21c [1]. The paper
extends it to art practice. Interest in Robotic art and evaluation
issues is current (News/Science) and runs parallel to the author’s
research. It stems from a recent Ph.D, ‘Programmable Analogue
Drawing Machines’ awarded by Manchester MIRIAD in 2011 [2].
This led to ‘Art by Machine’ [3] summarizing the research, and work
covered in the author’s website [4]. Simple instructions leading to
complex outcomes, was inspired by Turing’s work in the mid 20c
[5]. Most recent work is into ‘near chaos’, concerns the philosophical
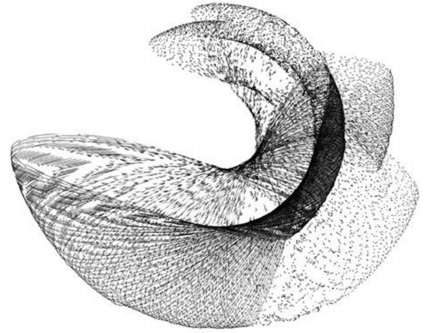
implications of evaluation of machine-made images. When further programming complexity is added to the
drawing machine’s output it might be expected to make it less likely
to achieve coherence in the images. Surprisingly the outcomes have
been better than expected; coherent images including secondary
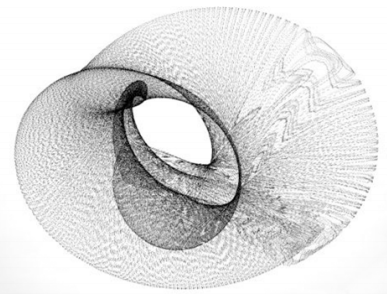
patterns persist (Figure 1). Drawing machines, generating ‘near
chaos’ images have a counter intuitive aspect. Unpredictable,
inaccuracy might seem helpful, but the opposite is true. The basic
machine must be deterministic, precise in line to line accuracy.
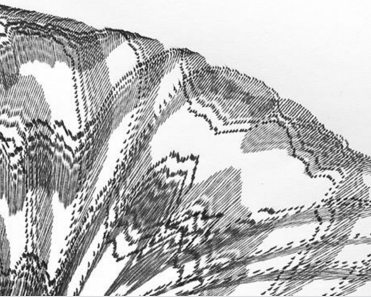
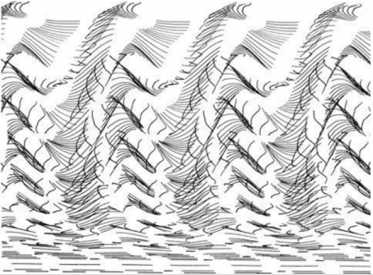
Many machines have been built able to create near chaotic outputs but in this paper the emphasis is on images produced by machine and evaluation issues arising from them. The analogue machines are complex; each one would fill a small paper. However, it is helpful to mention the mechanical actions crucial to creating a disruptive input which are a common feature of most machines. A fast pen-lift mechanism breaks up the continuous line into dots and dashes causing secondary patterns whilst a pen rotator and pen lift device is a feature of another machine (Figure 2). The latter is controlled by a sequential time output programmer. Of all the features employed the broken line via pen-lift is the principal contributor to the study of ‘near chaos’.
Figure 2: Effect of EGCG and EGCG derivatives on the proliferation of NSCLC cells. A. NCI-H1975 cells were treated with increasing doses of EGCG (1), EGCG-G1 (2) and EGCG-G2 (3) at the indicated concentrations for 48 hours. Cell proliferation was measured by MTT assay and expressed as the proliferation rate. B. H2O2 concentrations of EGCG (1), EGCG-G1 (2) and EGCG-G2 (3), tested using a H2O2 Quantitative Assay Kit (Water-Compatible).
Integral to both machines are sun and planet gearing systems generating complex mathematical curves. All the analogue machines employ multiple D.C. motors and linkages, which due to their inherent instability generate the essential component of quasi-randomness. This is a major factor in creating ‘near chaos’ effects. Finally, the platen, onto which the pen draws, influences the output. This can be a turntable, with either circular or elliptical motion or a horizontal movement. The difference with an identical programme is seen below in (Figures 3 & 4).
Figure 3: Effect of EGFR TKIs, EGCG derivatives or a combination of the two drugs on the proliferation of NCI-H1975 cells. A-F. gefitinib; erlotinib; lapatinib; icotinib; mubritinib and vandetanib (1μM) combinated with EGCG derivatives (EGCG-G1 and EGCG-G2) (30μM) with or withnot 10ng/mL EGF. Data represent the average of three independent experiments (mean ± SEM, p < 0.001). *** p < 0.001.
Figure 4: Combination of EGCG-G2 and grlotinib has synergized inhibitory effects on the phosphorylation the four members of the Her (ErbB) family in H1975 cells. NCI-H1975 cells were treated with EGCG-G2 (30μM), gefitinib (1μM) or EGCG-G2 plus gefitinib, after 12 hours, NCI-H1975 cells were stimulated with or withnot 10 ng/mL EGF for 5 minutes. The expression levels of the proteins were determined by western blotting with β-tubulin as the loading control.
Divisors
Intent, method and evaluation are three divisors often employed to discuss art works. This paper will only address the first and last, as a precis of the method i.e. analogue machines with D.C motors has been touched on in the introduction.
Intent
The original intent was to research how simple instructions may lead to complex outcomes in drawings made by programmable analogue drawing machines. A combination of determinism and quasi-randomness produced coherent non-figurative images where the selection criterion was based on aesthetic quality. When the focus of the research shifted towards exploring ‘near chaos’ the intent also altered. The programming was set to disrupt the drawing towards a ‘tipping point’ where the drawing almost became chaotic but just retained some coherence. The decision as to where the image was judged to be coherent is of course subjective. This aspect is examined in the evaluation section below. What is implied by this approach is to reduce the importance of conventional aesthetic criteria and simply concentrate on coherence. This in the author’s opinion is seen as a subtle but significant point. It resonates with views expressed by artists such as Paul Klee [6]. His phase “Taking a line for a walk” applies here perhaps.
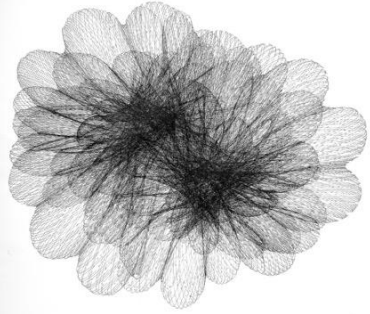
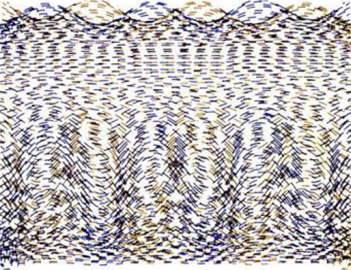
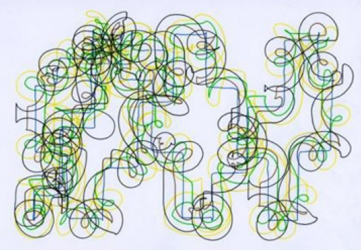
The approach to examining intent and leading to evaluation issues is perhaps best dealt with by looking at a variety of images and offering comments on each. From 50 years research, the variety is wide ranging from simple drawings derived from Lissajous figures, sine waves and X:Y plotters to drawing with light exploiting color and tonality. Added color, via post production scanned work in Adobe Photoshop is another important aspect of the work where the color is used to highlight the character of the shapes drawn. When the attention was shifted to ‘near chaos’ it was seen that earlier work already had intimations of chaos which stemmed from the large element of quasi-randomness present in the design and programming. Some of these are shown, as it is felt that they have relevance to the topic. In some instances, an enlarged section of a drawing serves to emphasize the chaotic detail present (Figures 5 & 6). A recent addition is a double pen holder. The two-color drawing increases the chaos (Figures 7 & 8).
Figure 5: Transport of EGCG and EGCG-G2 across Caco-2 monolayers. TEER values were also measured to account for the integrity of the monolayer during the experiment. A. TEER values of Caco-2 monolayer (Ω·cm2). B. The transepithelial transport rate of EGCG and EGCG-G2 (50μg/mL) in the apical to basolateral direction. C. The transepithelial transport rate of EGCG and EGCG-G2 (50μg/mL) in the basolateral to apical direction. *** p < 0.001.
Figure 7: Effect of EGCG and EGCG derivatives on the proliferation of NSCLC cells. A. NCI-H1975 cells were treated with increasing doses of EGCG (1), EGCG-G1 (2) and EGCG-G2 (3) at the indicated concentrations for 48 hours. Cell proliferation was measured by MTT assay and expressed as the proliferation rate. B. H2O2 concentrations of EGCG (1), EGCG-G1 (2) and EGCG-G2 (3), tested using a H2O2 Quantitative Assay Kit (Water-Compatible).
Figure 8: Effect of EGFR TKIs, EGCG derivatives or a combination of the two drugs on the proliferation of NCI-H1975 cells. A-F. gefitinib; erlotinib; lapatinib; icotinib; mubritinib and vandetanib (1μM) combinated with EGCG derivatives (EGCG-G1 and EGCG-G2) (30μM) with or withnot 10ng/mL EGF. Data represent the average of three independent experiments (mean ± SEM, p < 0.001). *** p < 0.001.
The sine wave has been used in several machines as a basis for research and has been particularly useful when the broken line effect was present. The sinewave machine allows interactive control of the drawing as it progresses which can be useful in producing a drawing with a variety of characteristics (Figure 9). Adding color often helps to increase the variety and can move the image in a chaotic direction (Figures 10-13). A further device to alter the presentation is to invert a drawing post scanning. this can sometimes enhance the image character. Multiple pen holders may be used to add variety to the drawing (Figure 14).
Figure 9: Combination of EGCG-G2 and grlotinib has synergized inhibitory effects on the phosphorylation the four members of the Her (ErbB) family in H1975 cells. NCI-H1975 cells were treated with EGCG-G2 (30μM), gefitinib (1μM) or EGCG-G2 plus gefitinib, after 12 hours, NCI-H1975 cells were stimulated with or withnot 10 ng/mL EGF for 5 minutes. The expression levels of the proteins were determined by western blotting with β-tubulin as the loading control.
Figure 10: Transport of EGCG and EGCG-G2 across Caco-2 monolayers. TEER values were also measured to account for the integrity of the monolayer during the experiment. A. TEER values of Caco-2 monolayer (Ω·cm2). B. The transepithelial transport rate of EGCG and EGCG-G2 (50μg/mL) in the apical to basolateral direction. C. The transepithelial transport rate of EGCG and EGCG-G2 (50μg/mL) in the basolateral to apical direction. *** p < 0.001.
Figure 12: Effect of EGCG and EGCG derivatives on the proliferation of NSCLC cells. A. NCI-H1975 cells were treated with increasing doses of EGCG (1), EGCG-G1 (2) and EGCG-G2 (3) at the indicated concentrations for 48 hours. Cell proliferation was measured by MTT assay and expressed as the proliferation rate. B. H2O2 concentrations of EGCG (1), EGCG-G1 (2) and EGCG-G2 (3), tested using a H2O2 Quantitative Assay Kit (Water-Compatible).
Figure 13: Effect of EGFR TKIs, EGCG derivatives or a combination of the two drugs on the proliferation of NCI-H1975 cells. A-F. gefitinib; erlotinib; lapatinib; icotinib; mubritinib and vandetanib (1μM) combinated with EGCG derivatives (EGCG-G1 and EGCG-G2) (30μM) with or withnot 10ng/mL EGF. Data represent the average of three independent experiments (mean ± SEM, p < 0.001). *** p < 0.001.
Figure 14: Combination of EGCG-G2 and grlotinib has synergized inhibitory effects on the phosphorylation the four members of the Her (ErbB) family in H1975 cells. NCI-H1975 cells were treated with EGCG-G2 (30μM), gefitinib (1μM) or EGCG-G2 plus gefitinib, after 12 hours, NCI-H1975 cells were stimulated with or withnot 10 ng/mL EGF for 5 minutes. The expression levels of the proteins were determined by western blotting with β-tubulin as the loading control.
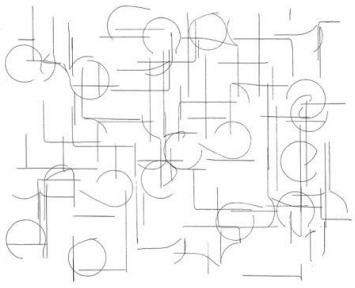
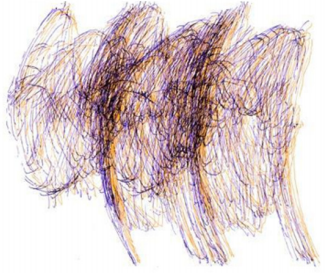
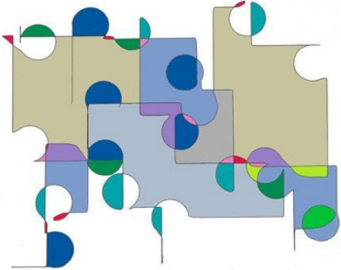
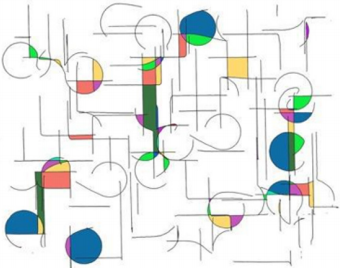
As seen above the nature of the pen unit can contribute to the expressive effects available in programming the drawing. The pen rotator unit is particularly useful where it may use with or without a pen lift action. Color is added to highlight the circular and linear blocks. Some near chaotic distribution of the circles is evident (Figures 15 & 16). Figure 17 is seen as one of the most successful recent images as it encapsulates the notion of ‘near chaos’.
Figure 15: Transport of EGCG and EGCG-G2 across Caco-2 monolayers. TEER values were also measured to account for the integrity of the monolayer during the experiment. A. TEER values of Caco-2 monolayer (Ω·cm2). B. The transepithelial transport rate of EGCG and EGCG-G2 (50μg/mL) in the apical to basolateral direction. C. The transepithelial transport rate of EGCG and EGCG-G2 (50μg/mL) in the basolateral to apical direction. *** p < 0.001.
Figure 17: Effect of EGCG and EGCG derivatives on the proliferation of NSCLC cells. A. NCI-H1975 cells were treated with increasing doses of EGCG (1), EGCG-G1 (2) and EGCG-G2 (3) at the indicated concentrations for 48 hours. Cell proliferation was measured by MTT assay and expressed as the proliferation rate. B. H2O2 concentrations of EGCG (1), EGCG-G1 (2) and EGCG-G2 (3), tested using a H2O2 Quantitative Assay Kit (Water-Compatible).
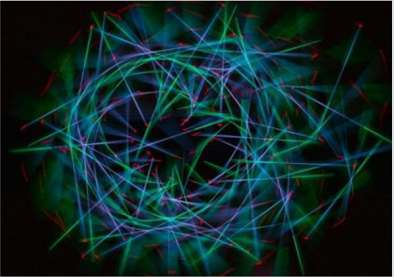
So far all the drawings have been graphic. When drawing with light, the soft color and tonality make a significant change o the image. A high-end digital camera records the light pen. The nature of the ‘near chaos’ image is very different. This concludes the variety of images where there are different examples of ‘near chaos ‘drawings. Other examples shown are to illustrate points concerning evaluation.
Evaluation
It is argued that the approach to the art works follows the Gombrich [7] notion of the ‘beholder’s share’ i.e. the response to and benefit derived from an art work is governed by what the viewer brings to the process. Whilst this puts the artist’s intent into second place it is felt to be a workable practice and is adopted in this paper. Evaluation is more complex when the subject is ‘near chaos’. It is the opposite end of a continuum between itself and order; the theme of Kenneth Martin’s ‘Chance and Order’ work in the mid 20c [8]. His work explored the role of chance. Using dice as random input, images displayed ‘near chaos’ characteristics.
Martin’s continuum establishes a deterministic start showing the distance moved towards ‘near chaos’; the process ending when coherence is evident. With machine drawings evaluation is informed by the expectation that combined inputs should fail to generate coherent images. Surprisingly this has not been the case and it is hoped that the various images shown above bear this out to the viewer. Evaluation of chaos and art intensifies the problems of definition, addressing two complex issues. The complexity calls for a philosophical approach and factors below come into play. Considering them might clarify the issues. Paul Klee [6] was a musician and artist, so a musical analogy might be helpful. Music consists of notes of different pitch and timbre, where delivery and interpretation govern the effect on the listener. The same music has first been seen as Chaotic and eventually as Classical. Art objects now seen as chaotic may be seen differently in future although the artist’s curiosity remains the same.
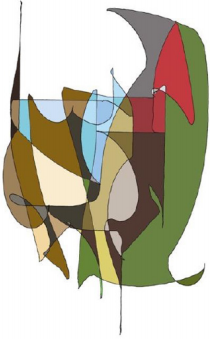
A concluding thought is offered. Simple instructions with a potential for chaos created Figure 18 with complex lines and added color. The author sees ’Homage to Klee’; others may see a jumble of lines with no meaning. We must decide which approach to adopt with regard to generative art from both machines and robots. Our predisposition to seek figurative meaning in abstract images occurs in Hamlet and Polonius’s argument about the shape of clouds and has a bearing on our responses today. In Figure 19 a product from quasi-random input, has been perceived as a woodpecker. A drawing programmed with chaotic potential has become an illustration!
Figure 18: Effect of EGFR TKIs, EGCG derivatives or a combination of the two drugs on the proliferation of NCI-H1975 cells. A-F. gefitinib; erlotinib; lapatinib; icotinib; mubritinib and vandetanib (1μM) combinated with EGCG derivatives (EGCG-G1 and EGCG-G2) (30μM) with or withnot 10ng/mL EGF. Data represent the average of three independent experiments (mean ± SEM, p < 0.001). *** p < 0.001.
Figure 19: Combination of EGCG-G2 and grlotinib has synergized inhibitory effects on the phosphorylation the four members of the Her (ErbB) family in H1975 cells. NCI-H1975 cells were treated with EGCG-G2 (30μM), gefitinib (1μM) or EGCG-G2 plus gefitinib, after 12 hours, NCI-H1975 cells were stimulated with or withnot 10 ng/mL EGF for 5 minutes. The expression levels of the proteins were determined by western blotting with β-tubulin as the loading control.
The view can be taken that the artist’s job is not to convince but to offer results stemming from curiosity and seeking innovation (Figure 20). Then re. ‘Gombrich’, the viewer makes of it what they will. Does this render intent irrelevant? Another viewpoint comes from the philosopher Collingwood, who stated that “Art is the community’s medicine for the worst disease of mind, the corruption of consciousness” [9].
Figure 20: Transport of EGCG and EGCG-G2 across Caco-2 monolayers. TEER values were also measured to account for the integrity of the monolayer during the experiment. A. TEER values of Caco-2 monolayer (Ω·cm2). B. The transepithelial transport rate of EGCG and EGCG-G2 (50μg/mL) in the apical to basolateral direction. C. The transepithelial transport rate of EGCG and EGCG-G2 (50μg/mL) in the basolateral to apical direction. *** p < 0.001.








No comments:
Post a Comment
Note: Only a member of this blog may post a comment.