Application of SSR Markers for Testing the Uniformity/Purity Analysis of a Large Wheat (Triticum Aestivum L.) Tilling Population
Introduction
Wheat provides 20% of the total calories consumed by human beings. Major cultivated species of wheat is Triticum aestivum L. (2n=6x=42, also known as bread wheat). It has three sub genomes A, B and D, together makes 17.6 GB wheat genome Spannagl, et al. [1]. In spite of huge investment made in understanding wheat Genet. and genomics, there are still many gaps in elucidating different genetic pathways because of its huge and complex genome size and its ploidy level Slade, et al. [2]. TILLING (Targeting Induced Local Lesions IN Genomes), a powerful reverse genetic strategy that allows the detection of induced point mutations in individuals of the mutagenized populations (to induce genetic variations, a number of mutagens like physical and chemical have been used. Out of which, chemical mutagen especially ethyl methane sulphonates (EMS)-induces point mutations randomly in genomes of different crop species Greene, et al. [3-6], can address the major challenge of linking sequence information to the Biol. function of genes and can also identify novel variation for crop Breeding. Slade, et al. [2].
Wheat is especially well- suited for TILLING due to the high mutation densities tolerated by polypoid. However, only a few wheat TILLING populations are currently available in the world, which is far from satisfying the requirement of Res.ers Chen, et al. [7-13,5]. Before inducing mutations, genetic uniformity of the genetic material is extremely important Sabetta, et al. [14]. Seed purity is undertaken by morphological means. Due to uncertainties in such methods, there is always a risk of incorrectly rejecting or accepting a seed lot Remund, et al. [15]. Morphological traits are growth stage specific, prone to environmental errors and are limited in number. Wheat is a self-pollinating plant but occasionally outcrossing occurs. However, it is impractical to have pollen control by bagging spikes in the greenhouse or in the field. Therefore, rapid and accurate assessment of a large TILLING population through such means is difficult. Thus, as a standard procedure, putative mutants identified are further subjected to microsatellite marker analysis for confirming their authenticity Wu, et al. [16-20]. Simple Sequence Repeats (SSRs) are co-dominant in expression-make them a marker of choice and have been used extensively in genotyping individuals of different plant species Asif, et al. [21].
The propensity of SSRs showing hyper variability has been exploited to study the natural polymorphisms found in TILLING population of different crop species Xin, et al. [22,14] and or identifying contamination (off type plants) in mutant population that usually occurs by several means including mixing at harvesting, threshing, etc. Bora, et al. [19]. We consider this approach as a costeffective way to maintain quality control of the mutant stock. Thus, it is extremely important to test for heterogeneity and or natural variants in TILLING population.
Material and Methods
Plant Material
The hexaploid NN-Gandum-1 (Triticum aestivum L., 2n=6X=42) is a spring wheat variety released for cultivation in July 2016 that was bred by making a cross (Chirya-3/Opata//2x parula/3/ Rohtas-90) at the Plant Genomics & Mol. Breeding Lab, National Institute for Biotechnol. and Genetic Engineering. NN-Gandum-1 (also called as Gandum-1)’ has been evaluated for studying its adaptability throughout the Punjab province in Pakistan.
Mutagenesis and Tilling Population Development
Genetic purity of the variety was ensured by planting 500 single spike rows. Out of these, only one line was selected by observing uniformity in different morphological traits. Then the seed was increased by planting small plot. This seed was used to expose to chemical mutagen EMS. For optimization of dose, 180 seed in three replicates of each line were treated with eight different EMS doses (0.3, 0.4, 0.5, 0.6, 0.7, 0.8, 0.9, 1%), for two different exposure times (16 h and 18 h) at room temperature (RT = 25°C) with continuous shaking.
DNA Isolation
Genomic DNA was isolated from leaves of 21-day-old seedlings of Gandum-1 and each of 74 the M2 plants using the modified cetyl trimethyl ammonium bromide (CTAB) method. The DNA quantification was carried out using Nano-dropTM1000 spectrophotometer (Thermo scientific, USA) and diluted accordingly. The quality and quantity of the genomic DNA was also determined on 0.8% agarose gel. SSR purity analysis on M2: A total of 77 SSR primer pairs (WMS series) exhibited high PIC values were selected by surveying on 96 wheat genotypes (unpublished data). Total volume of 20 μL was used for PCR. The ingredients of the PCR were 20 ηg genomic DNA, 0.2mM dNTP, 1.5mM MgCl2, 2 μg of each primer (forward and reverse) and 0.5U Taq polymerase. The SSR (PCR) amplification of genomic DNA was carried out by incubating the DNA samples at 95°C for 5 min, then 35 cycles comprising 94°C for 1 min, annealing of primer at 55- 60°C for 30 sec and then extension at 72°C for 1 min. The final extension was carried out at 72°C for 10 min in Thermal Cycler (Bio-RAD C1000 Touch). After PCR amplifications, the PCR products were separated on 2.4 % high-resolution agarose gel (Bio-RAD electrophoresis system). The gels were stained with ethidium bromide and photographed on GelDoc-It®2 310 Imager.
Chromosome Survey and Statistical Analysis
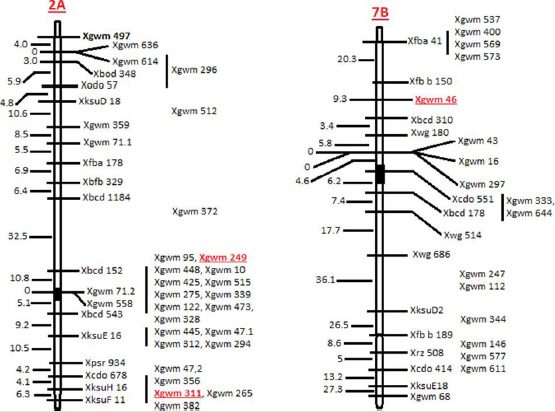
Position of the SSRs on chromosome was determined using Ensembl Plants (http://archive.plants.ensembl.org/index.html). Physical map of chromosome, position of markers and position of centromere was collected from the International Wheat Genome Sequencing Consortium (IWGSC) website (https://www. wheatgenome.org/) (Figure 1). For the analysis of EMS experiment, complete randomized design (CRD) was used. Analysis of variance (ANOVA) of the data was conducted using statistix 8.1 software.
Results
In present study, seed of wheat variety Gandum-1 were exposed to EMS at two exposure times (1 and 2 h) as previously reported Bahar, et al. [23]. It was observed that the germination rate showed gradual depression with the gradual increment of EMS concentration. After exposing for 1 hours, the germination percentage at 0.4, 0.5, 0.6, 0.7, 0.8 and 0.9% (v/v) EMS concentration was 83.4, 72.5, 58.3, 47.6, 42.2 and 34.5 respectively. While after exposing for 2 hours, the germination percentage at 0.4, 0.5, 0.6, 0.7, 0.8 and 0.9 % EMS concentration was 79.3, 67.8, 53.4, 41.2, 36.7, and 29.5, respectively. From this experiment, 0.8% EMS concentration for 2 hours exposure time at 35°C was found appropriate for developing a wheat TILLING population. Before conducting TILLING experiments, purity analysis of the newly developed genetic resource (M2) was done for differentiating induced mutations from the natural once. The M1 plants that were raised from EMS-mutagenized seed, were self-fertilized for harvesting M2 seed. In next wheat growing season, M2 seed were sown to raise M2 plants. From each of the M2 plant (in total 3634), genomic DNA was extracted. Genomic DNA of each of the plant was normalized up to 20ng/ul. PCR conditions were optimized.
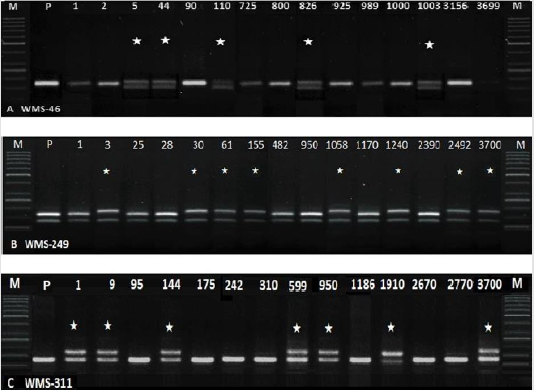
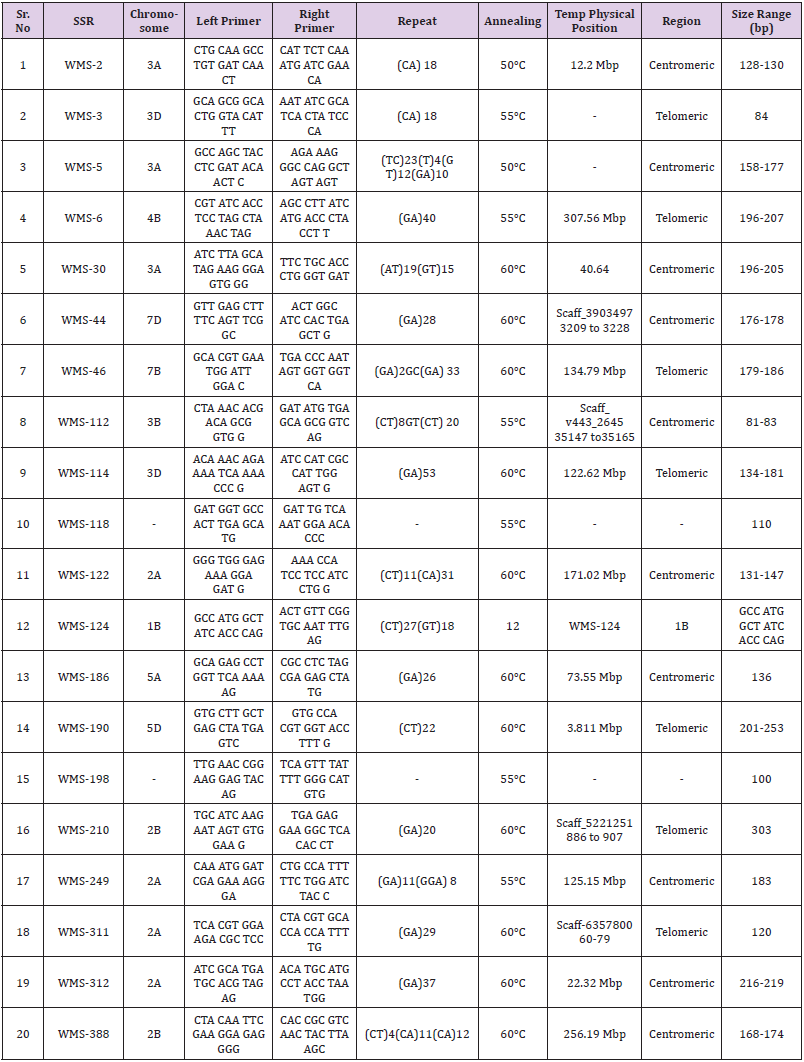
In total, 77 SSRs were surveyed on 96 wheat genotypes (data unpublished). Out of these, 20 SSRs primer pairs (WMS-2, 107 WMS- 3, WMS-5, WMS-6, WMS-30, WMS-44, WMS-46, WMS-112, WMS- 114, WMS-118, WMS- 122, 108 WMS-124, WMS-186, WMS-190, WMS-198, WMS-210, WMS-249, WMS-311, WMS-312 and WMS- 388) (Table 1) were selected on the basis of their PIC values. From these 20 primer pairs, only three SSR primer pairs (WMS-46, WMS- 249 and WMS-311) amplified polymorphic amplicons in M2 plants (Figure 2). These plants appeared to contain natural mutations. Two SSRs were mapped on chromosome 2A (WMS-249 and WMS- 311) while one was mapped on chromosome 7B (WMS-46) (Figure 1). The frequency of natural variants detected by WMS-46, WMS- 249 and WMS-311 were 5.09% (188 out of 3634), 7.23% (in total 268) and 8.29% (in total 307), respectively. These variants showing polymorphic alleles other than wild type (amplified by either of the primer pairs) were excluded from the TILLING population to avoid natural contamination (as per requirement of TILLING).
Figure 2: Amplification of M2 samples with WMS-46, 249 and 311. Lane M=50bp Ladder (P= parent, NN Gandum-1. *=natural variants).
Discussion
Dose of mutagen is largely dependent upon the genetic makeup of a genotype. It has been proposed by some Researchers that large genomes necessitate higher EMS concentrations. For example, reduction in germination rate in wheat is an indication of effective mutagenesis Bahar, et al. [23]. Such reduction in or slowing down of wheat seed germination with enhanced EMS concentration may occur by the delay or inhibition of some physiological processes Kumar, et al. [24-26]. An ideal population would carry maximum mutations without losing fertility of majority of plants Weil, et al. [27]. Thus, before launching an experiment, dose of a mutagen should be optimized Till, et al., [28-29]. Induction of mutations in crop species seems to be a straightforward strategy but some technical challenges including purity of a genetic material impact the quality of a newly developed mutant population Caldwell, et al., [30]. Determining the genetic purity of a mutant population is one of the most important features that aids in improving the quality of a TILLING experiments by discarding the natural variants present in the population. Microsatellite markers have also been used for purity analysis of TILLING populations of fruit, vegetables, sunflower, Soybean and other crops Wu, et al. [16,22,14,31]. For example, a total of 4 and 15 SSR primer pairs were surveyed on sunflower and sorghum, respectively to identify variants in population Xin, et al. [22,14].
Conclusion
It is concluded that SSR analysis by selecting the highly polymorphic loci (with high PIC value), preferably 20 SSRs, can be undertaken for selecting true-to-type mutant plants (other than natural variants). Usually, one can screen the whole population (3634 or more plants) within two week using semiautomated genotyping system. Therefore, the survey of SSR loci for determining the purity of a mutant population is recommended before embarking TILLING strategy, exome capturing Henry, et al. [32-34], SNP discovery Rimbert, et al. [35], re-sequencing of mutants of TILLING population Kagale, et al. [36] and genomebased strategies Scossa, et al. [37-39] that would help in reaching gold standard conclusions.
| For more Articles on : https://biomedres01.blogspot.com/ |


No comments:
Post a Comment
Note: Only a member of this blog may post a comment.