Computational Investigation of Secondary Acoustic Radiation Force Between Cells and Particles Out of Nodal Pressure Line
Introduction
The wide applications of acoustofluidic devices which have
been studied in recent years, play a key role in cell manipulation
and separation [1,2]. In such cases, the first part of acoustic force,
which is called primary acoustic radiation force, has been widely
investigated in last few decades [3-5]. This force acts on cells and
particles with different properties related to the containing fluid
and causes some effects on cell deformation which have also been
studied experimentally and theoretically in recent years in which,
the investigators have tried to improve their simulations by using
the solid models [6,7]. Recently, Aghaie, et al. [8] found that the
viscoelastic model predicts the cell deformation behavior more
relevant to the experimental data in comparison with previous
models which were applied to cells with no respect to inter-particle
force. When two or more suspended objects (particle or bubble)
are subjected to an external acoustic field, the inter-particle force
appears [9]. This mutual force between particles which is known as
secondary acoustic radiation force results in attraction or repulsion
and under this condition and each particle is exposed to both the
incident field (equal to the primary force) and the scattered field
from the neighboring [10]. This inter-particle force may affect some
applications like cell trapping, cell clustering, and cell sorting [11].
Most of the studies have developed and reported the secondary
force on bubbles in the acoustic field [12-16]. In 1906 a theoretical
investigation of acoustic interaction force between a pair of air
bubbles was derived by Bjerknes [9].
Crum [13] extended his analysis to the experimental study on pulsating bubbles in a sound field. By considering a wide distance range between two small gas bubbles in a viscous liquid, Doinkov [16] showed a repulsion between the bubbles which was in contradiction with Bjerknes formula. In addition to the bubbles, this mutual interaction force has been expressed both theoretically and experimentally for particles [17-19] and fluid spheres [20] in a plane wave field. Silva and Bruus [21] obtained a theoretical formula for interaction forces in the Rayleigh scattering limit. They calculated the inter-particle force by a potential field in an inviscid fluid. Sephrirahnama, et al. [10] proposed a numerical solution by using a weighted residue procedure to compute the total acoustic radiation forces. Their investigations were carried out in close proximity to pressure node with no restriction on the spherical particles size. Recently, Habibi, et al. [22] conducted a numerical simulation to find out the impact of particle size and material properties on the acoustic forces, including the secondary force. They demonstrated a various behavior in regimes and forces direction due to the resonant modes. The current literature lacks a research on the secondary acoustic force out of the nodal pressure. The monopole part of the secondary acoustic force vanishes in the pressure node. Most of the previous studies were also restricted to the bubbles in which, the dipole effect is eliminated, whereas the compressibility influences the secondary force.
Moreover, a few researchers have simulated the secondary acoustic force by numerical method. For example, Habibi, et al. [22] placed the particles in the wave propagation direction and considered a same direction for both the primary and the secondary forces. In this paper, we present a numerical and experimental study for two groups of particles to calculate the primary and secondary acoustic forces. In order to achieve our purpose, firstly, we select two polystyrene particles of different sizes (4.8 and 25μm). In the second section we use a red blood cell and silica particle with sizes 6 and 22μm, respectively. By considering a fixed position outside of the pressure node for larger particle, and a moving pathway for the smaller particle, the primary and secondary acoustic forces are calculated. As a consequence, the dependence of the secondary acoustic force on the inter-particle distance is obtained. Additionally, a summary on the experimental procedure is presented and all results are compared with the experimental analysis.
Theory and Formulation
Primary Acoustic Force
In the case where particles are suspended in a fluid and driven by an acoustic wave without considering an interaction phenomenon, they will be affected by the primary acoustic force. For a compressible particle in an ideal fluid, this force is written as [23]:

where R is the particle radius, k is the acoustic wave number, Eav is the acoustic energy density, and z is the distance till the nearest pressure node. Φ denotes the acoustic contrast factor defined as:

Here β is the compressibility, ρ is the density and the subindex p and f correspond to particle and fluid, respectively. Positive or negative value of contrast factor determine the particle/cell moving direction to the pressure node or antinode, respectively [23].
Secondary Acoustic Force
In the acoustic field, when particles are in close proximity to each other, the inter-particle force starts becoming significant. Investigation of secondary acoustic force on particles back to the study of Weiser, et al. [19]. They derived this interaction force for two solid particles with radius of Rp1 and Rp2 in two expressions:

where Vac is the incident field velocity, d is the inter-particle distance, and θ is the angle between the propagation direction of the incident wave and the centerline connecting the two particles. For the case where the particles lined up in the wave propagation direction (θ=0) the secondary acoustic force is repulsive. On the other hand, the force between the particles lined up perpendicular to the propagation direction (θ=90) is negative and attractive. Gröschl [1] by extending the Crum [13] study, carried out the formula including both the orientation and particle position effects. This force for two similar particles is given by:

where ω is the angular frequency. v(z) and p(z) are the velocity and pressure in the particle position, respectively, of the unperturbed incident acoustic field. The first term (dipole term) represents either attraction (θ=90) or repulsion (θ=0) and it vanishes at the pressure anti node. Likewise, the second term (the monopole term) depends on the compressibility representing an attractive force and it vanishes in the pressure node. For particles in between the pressure node and the velocity node, both terms should be considered. In the present study, in order to compute the primary and secondary acoustic forces, we use the perturbation method by considering a series for the pressure, velocity and density. These fields begin with the stationary part (p0, v0, ρ0), followed by the first order (p1, v1, ρ1) and second order terms (p2, v2, ρ2). Then the pressure, velocity and density can be written as [24]:

The acoustic radiation force acting on a particle, in an inviscid fluid can be calculated by integrating the time averaged second order pressure field on the surface of particle as given in the following equations [24]:

Here, C is the speed of sound in fluid, n is the normal unit vector, s is the surface of the particle, and < > is the time average operator. In Eq. (6) the first two terms are the kinetic and hydrostatic energy, and the third term is the momentum flux across the boundary surface of the particle [25]. The first order parameters (p1,v1) consist of the incident and scattered parts, for instance, the pressure can be expressed as:

where index in and sc refer to the incident and scattered wave, respectively. In the small size particle cases (R<<λ) the psc2 term will be negligible compared to pin2 and 2pinpsc [25]. However, for large particles the scattered terms must be considered. Also, the scattered-scattered and scattered-incident terms play a key role in the secondary acoustic force calculation because the acoustic inter-particle force depends strongly on the particle distance and scattering effects. In calculating the primary acoustic force acting on a particle, Gorkov’s equation cannot provide a precise solution because it does not take the scattering effects into account. Thus, due to the small distance between the particles in the present work, we employ the perturbation theory by using the first order terms to calculate the primary and secondary acoustic force.
Simulation Procedure
Algorithm and Boundary Condition
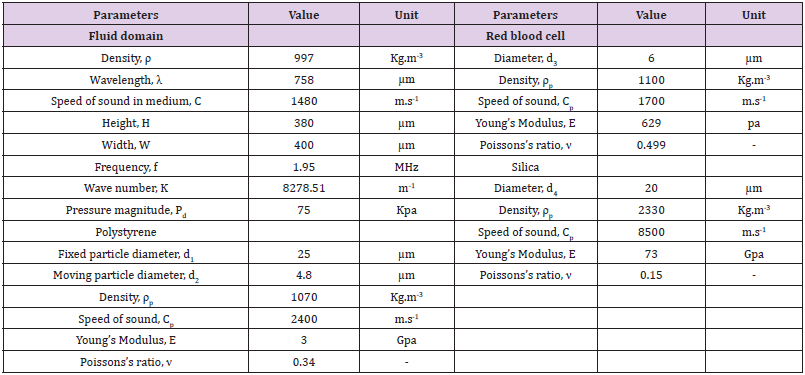
The commercial finite element software (COMSOL Multiphysics @ V.5.3) is implemented so as to simulate 2D and 3D models of two particles/cell in an acoustic field. The simulation model consists of two particles and particle/cell, experiencing acoustic force in different positions. The aim of simulation is to evaluate the primary and secondary acoustic force and the correlation between them in special positions out of nodal pressure. In the current study, we use the Acoustic Pressure physics to obtain the acoustic pressure field at the first steps. Furthermore, we employ the Solid Mechanics physics to obtain the impacts of linear elastic behavior particle as a scattering point. The computational domain is modeled by coupling the Pressure Acoustic and Solid Mechanics physics and acoustic radiation forces (primary and secondary) are evaluated by integrating from Eq.6 over the particle surface. The material and domain properties considered in the model, are given in (Table 1). The fluid characteristics are obtained from the COMSOL library. At the first case, both the fixed and moving particles are selected as polystyrene with sizes 4.8 and 25μm, respectively. Secondly, we consider a red blood cell (6μm of diameter) as a moving particle and silica particle as a fixed particle (20μm of diameter). These sizes were chosen to compare the simulation results with experimental data. While thanks to the axisymmetric domain we use a 2d model, in order to simulate the current study presented in results and discussion part, a 3d model is implemented.
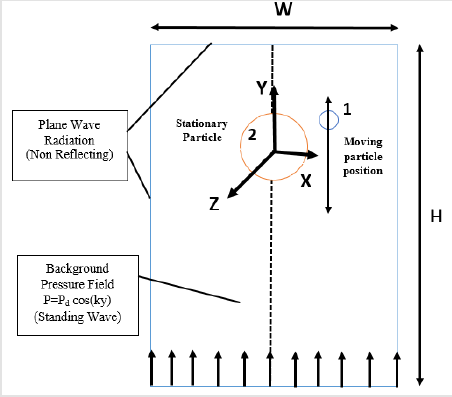
The applied boundary conditions are shown in (Figure 1). It is indeed a 3d case in which, surrounding fluid is deliberately represented as a rectangular geometry instead of cylindrical one to clearly show the boundaries. And particles are also depicted by a circular domain. The standing wave field is generated as p=pdcos(ky) propagating along the y-axis. We use the plane wave radiation for boundaries to surround the model with minimum acoustic reflection. The larger particle is fixed in between the pressure node and pressure antinode and the smaller particle is placed on particular positions in the neighboring of the stationary particle. Actually, we consider a definite pathway for the moving particle and determine the acoustic force based on this positioning. The primary acoustic force is obtained by Eq. (6) along the y-axis (the wave propagation direction) and compared with Gorkov’s theory. Integrating Eq. (6) over the smaller particle (moving particle) surface in the center-to-center line direction, leads to the secondary acoustic force and the results are compared with the experimental data in following sections.
Grid Generation
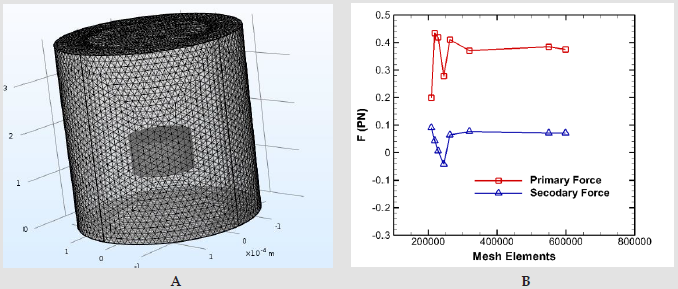
In order to obtain an appropriate mesh size, many different grid networks were tested. Finally, 423513 triangular elements are chosen as shown in (Figure 2a). We adopt a uniform mesh in outer region of the particles and moreover, a very refined meshes are used close to the particles. The maximum mesh size limited to 20.9μm for the fluid domain and 3.59μm for the solid domain. Also, the grow rate of the fluid and solid domain is set to 1.3. The grid independency is studied in (Figure 2b). To find an independent grid system, the primary and secondary acoustic forces are obtained for different cellular element sizes.
Validation
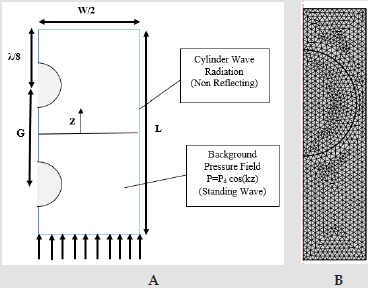
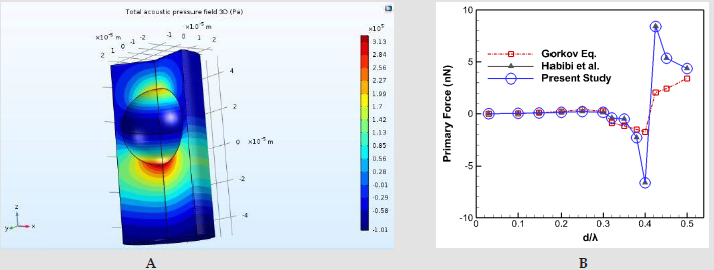
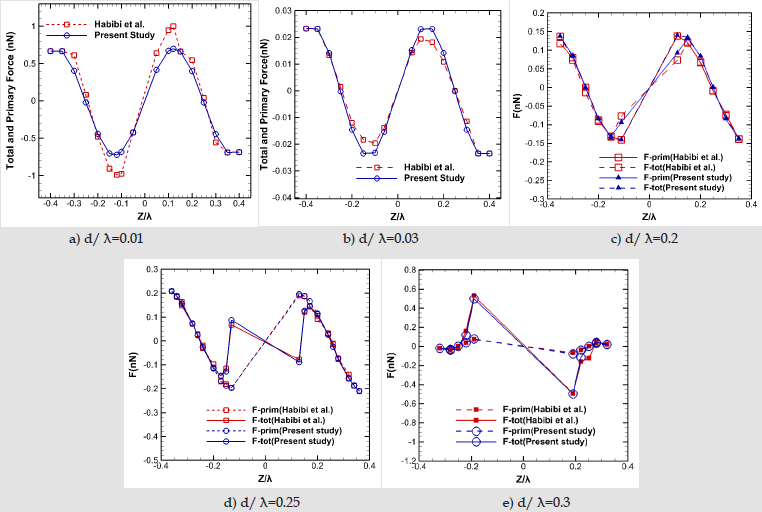
In order to investigate the validity of the current model, a numerical study is simulated, and its results are compared with [22]. A 2D axisymmetric model and grid network elements are demonstrated in (Figure 3). The polystyrene particle size varies from 0.03λ up to λ and its properties plus fluid domain parameters are mentioned in [26]. (Figure 4) illustrates the acoustic pressure contour and the primary radiation force which is compared with [22] results and Gorkov’s equation. As shown, our results are compatible with their models. However, there’s a difference between the numerical results and Gorkov’s theory. For the larger particles, it happens due to the restriction of Gorkov’s equation in considering the scattering effects. In the second case where there are two identically sized particles, the secondary acoustic force is presented and compared with [22] study. (Figure 5) illustrates the primary and total force acting on single and two particles. They determined the magnitude of secondary acoustic force by evaluating the primary and total forces. At first, they calculated the primary acoustic force for a single particle. By adding the second particle, they computed the acoustic force acting on first particle which was called total acoustic force. Since these forces are applied in the same direction, they calculated the secondary acoustic force by:

Figure 2:a) an uniform mesh in fluid domain and a dense mesh region around particles b) Mesh independency plot.
Figure 4:a) Acoustic pressure field 3D b) Primary radiation force of present study compared with results of [22] and Gorkov’s theory.
Where tot F is the total acoustic force on each particle in the presence of two particles? tot F and prim F is the primary and the secondary acoustic forces, respectively. Accordingly, the difference between the primary and total force values resulting in the secondary acoustic force, in the current case. As shown in (Figures 5a & 5b) for the ratio of particle diameter to wavelength of 0.01 and 0.03, the primary and total acoustic forces magnitude is the almost the same and indistinguishable. So, the title of y-axis in these two graphs, is primary and total force which are equivalent. Hence, the secondary acoustic force in these cases is nearly zero due to the small size and insignificant scattering effects. By increasing the particle size (Figures 5c-5e) there is an obvious difference between the primary and total acoustic force which indicates the existence of secondary acoustic force. In these cases, for small inter-particle distances (gap < 0.4), secondary force is dominant and overtakes the primary force. It can be clearly seen that the present simulation follows a similar trend with good agreement. As depicted in (Figure 4a), we solve the Pressure Acoustic Physics on both the fluid and solid domains whereas [22] did not consider the solid region in the Pressure Acoustic computational domain. By doing so, comparison between the secondary acoustic force values, represents insignificant differences.
Figure 5:Comparison between the primary and secondary acoustic forces acting on polystyrene particles which obtained by current modeling and [22] for different ratio of particle diameter to wavelength (d/ λ) in different normalized particle positions (z/ λ).
Experimental Data
We divided our results into two different sections as firstly we considered previous studies of authors [26,27] and simulated their experiments and compared their results with our evaluated data. At the second part, we make new experiments and simulate them as well and finally compare their results whit each other. The experimental procedure is exactly the same with [26,27] and extensively explained in those studies. They presented a new method to measure the secondary acoustic force between particles/cells. In their method, a scattering particle is fixed in the channel and the trajectory of other particles and cells are studied in close vicinity of the fixed particle. By extracting the particle/cell trajectory and subsequently particle/cell velocity and considering Stokes drag, FDrag = 6π nvrp , where n is dynamic viscosity, v is particle velocity and p r is particle/cell radius, in low Reynolds number of particles, the secondary acoustic force can be calculated.
They used the polystyrene and silica particle with diameter of 25 and 20 μm, respectively, as scattering points. The moving particles in close proximity of the scattering points include polystyrene with diameter of 4.8 μm and RBC with diameter of 6 μm for polystyrene and silica fixed particle, respectively. In that study, authors used a rectangular cross section microchannel with sizes 375×110 μm made of glass-silicon-glass layers.
The microchannel was excited by using the bulk acoustic wave with resonant frequency of 2-MHz. More information about the method of fixing the particle and injection the moving particle/cell into the microchannel can be found in [26,27]. In order to find the secondary acoustic force and separate that from primary acoustic force they just considered the lateral movement of moving particle in the perpendicular direction related to the wave propagation direction to calculate the Stokes drag force.
Results and Discussion
Inter-Particle Force Between Polystyrene Beads
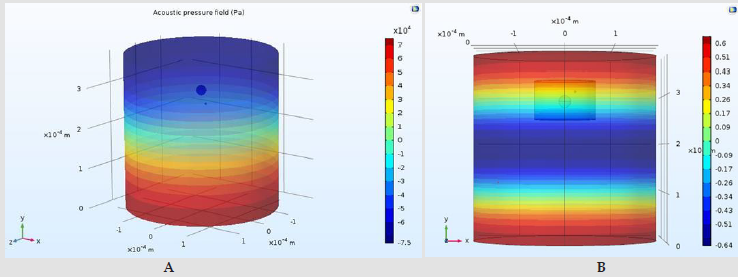
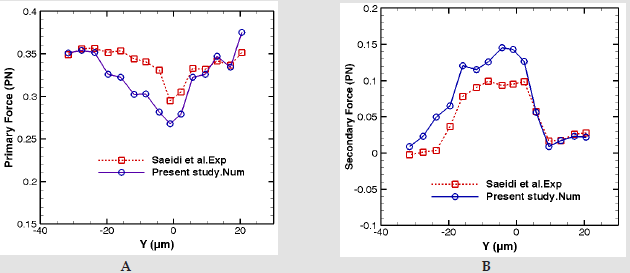
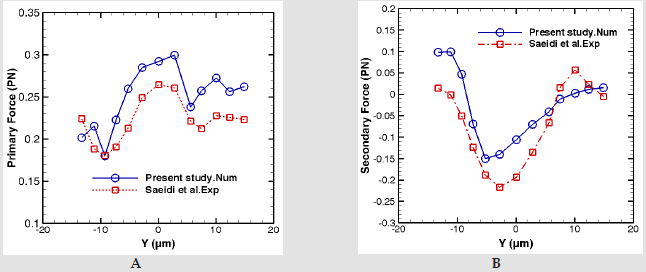
In this section, the numerical results of interaction of 25 and 4.8 μm polystyrene particles under the influence of acoustic field are compared. In order to consider the monopole and dipole effects, the polystyrene particles are located in between a pressure node and a pressure antinode. The acoustic pressure (which is generated by a plane wave and depicted in (Figure 6)and acoustic velocity are obtained by solving the 3D Helmholtz equation. As it can be seen, the acoustic pressure magnitude in the middle of channel is nearly zero which is indicated the nodal pressure plane, (Figure 6a). The time-averaged second order pressure () has been shown in (Figure 6b) and is approximately 1.25*105 times smaller than the magnitude of the first order pressure in (Figure 6a). This pressure acts on particles as an acoustic force and causes primary and secondary acoustic forces. The small moving and big fixed particles are shown in the (Figures 6a & 6b). (Figure 7)shows the primary and secondary acoustic forces on moving polystyrene particle positioned at different distances from the fixed particle. The location of the moving particle in simulation are chosen exactly in the same position which extracted from the experimental data [26]. The center of the fixed particle is considered as the origin of the coordinate system as the acoustic forces act on a small particle before and after reaching the fixed particle.
Figure 6:a) Color plot of acoustic pressure calculated by simulation in the 3D model at frequency of 1.95 MHz b) Color plot of the time-averaged second-order pressure at frequency of 1.95 MHz.
It’s also noticeable that when the moving particle reaches to the same level with fixed particle (position y = 0), the contact angel is approximately 0 and the center-to-center line is perpendicular to the wave propagation direction. In this condition, we face with a pure secondary acoustic force acting on the small particle. As it can be seen in (Figure 7a), the primary acoustic force decreases to the minimum value when the angel θ is close to 90. The distance between the fixed particle and the pressure nodal line is approximately 189μm. This force rises again in the further locations relative to the fixed particle. (Figure 7b) illustrates that contrary to the primary acoustic force, the secondary acoustic force is significant in the vicinity of fixed particle. Actually, the trends of primary and secondary acoustic force magnitudes change in the opposite way. Comparison between the numerical and experimental results of primary and secondary forces are depicted in (Figures 7a & 7b). The behavior of both forces from numerical results agrees with experimental data [26]. 2 Acoustic force between RBC and silica particle. In the second case, the same investigation has been done on the RBC and silica particle. The small RBC passes by the fixed silica particle.
Figure 7:Acoustic radiation force on polystyrene particle vs. y position : blue solid line shows the numerical results and the experimental data[26] is depicted by the red dashed line a) Primary acoustic force b) Secondary acoustic force
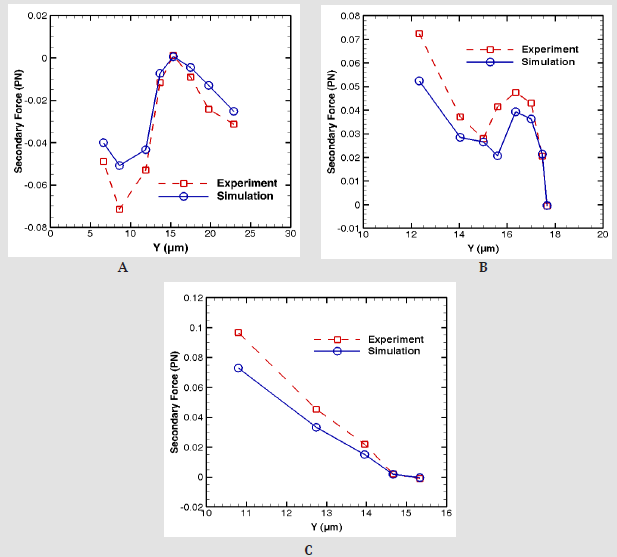
The primary and secondary acoustic forces acting on a red blood cell are calculated and shown in (Figure 8). In this case, the silica particle with a high stiffness (E=73Gpa) shows different trend in comparison with polystyrene particle. In general, the high magnitude of Young’s modulus, leads to the larger resonant frequency and in most cases, the eigenfrequencies strengthen the inter particle forces. (Figure 8b)shows that the secondary force acting on red blood cell varies from +0.1 to -0.15PN while the values from polystyrene particle changes approximately between 0 and 0.1PN. In other words, the higher stiffness of silica strongly affects the secondary acoustic force on RBC. In addition, by considering the fact that RBC has weaker acoustic properties relative to the polystyrene particle, we compensate this weak property with silica particle to highlight the secondary acoustic force acting on RBC. Considering that our simulation follows the previous experimental results with good accuracy, here we implemented new experiments for more investigation. In third section, new experiments by considering the RBC and silica particle have been done and their results are summarized in (Figure 9). At all cases, (Figures 9a & 9c) the fixed silica particle is located in the middle of the channel wall and pressure nodal line and moving RBCs are getting close to the fixed particle from the upside of the silica particle.
Figure 8:Acoustic radiation force on red blood cell particle vs. position and comparison with [27] a)Primary force b)Secondary force.
As it shown in all cases by decreasing the vertical distance of moving RBC to the silica particle the magnitude of the secondary acoustic force increases. In addition, in all cases almost at the vertical distances about 15-18 micrometer from fixed silica particle the magnitude of secondary acoustic force is nearly zero which indicates that the minimum effect of acoustic force in RBC trajectory. In case 1, (Figure 9a), there is a decrease in the magnitude of secondary acoustic force when the vertical distance of moving RBC is about 7 micrometers. The reason is the contact between the RBC and silica particle which reduces the RBC moving speed. In case 9 b, the sudden reduction in secondary acoustic force in vertical distance of 15 μm between RBC to silica particle could be related to the unexpected movement of RBC in close proximity of fixed particle based on visual observation. This unanticipated movement causes the change in center-center distance of RBC and silica particle and subsequently change in the secondary acoustic force.
Figure 9:Acoustic radiation force on red blood cell particle vs. position and comparison with [27] a)Primary force b)Secondary force
Conclusion
In this paper, the secondary acoustic radiation forces acting on
solid particles outside of the pressure node has been investigated
both numerically and experimentally. Initially, the primary and
secondary forces were determined by using a perturbation
theory. We have simulated the experimental condition so as to
obtain the forces acted on moving polystyrene particle. Afterward,
the mentioned procedure used for silica and red blood cell. By
comparison, the same behavior has been illustrated between the
numerical and experimental results. The investigation of acoustic
radiation force has shown that when the moving polystyrene
particle is positioned close to the fixed particle, the secondary force
rises significantly. It means that in the cases where the contact
angel is nearly 0 and the center-to-center line is perpendicular to
the wave propagation direction, the secondary force goes up, whilst
the primary force decreases sharply in this region. Additionally, in
the case of red blood cell and silica studied, we have observed the
similar relationship between the primary and secondary forces.
However, in this case, due to the larger stiffness of silica, the red
blood cell has experienced the higher variation in secondary force
than polystyrene particle.
For more Articles on : https://biomedres01.blogspot.com/


No comments:
Post a Comment
Note: Only a member of this blog may post a comment.