Estimation of Geographical Origin of Amfissis Cultivar Olive Oil Based on GC-FID/MS and Chemometrics
Introduction
Virgin olive oil (VOO) is produced from the fresh, immaculate
olive fruits of Olea europaea L. employing mechanical and physical
techniques [1]. VOO has grown in popularity amongst consumers
due both to its pleasant qualities and its health benefits. These
qualities are derived from the primary characteristics of olive
oil such as phytosterols, tocopherols, and polyphenols, and the
fact that VOO has elevated levels of monounsaturated fatty acids
(MUFA), the principal element being oleic acid [2]. Disparities in
geography, agronomy, and technology all contribute to variations in
the chemical configuration of VOO. Moreover, geographically based
compositional differences inform legislative initiatives, such as
those designed to safeguard both the denomination of origin (PDO)
and the protected geographical indication (PGI) [3,4]. The PGI and
PDO certifications not only allow consumers to identify the areas
where olive oil products were produced but also secures economic
advantages for olive growers in regions that have been accorded
specific designations.
VOO can be categorized according to both the region in which it is produced [5,6] and the cultivar of olive involved [7,8]. This classification is achieved using chemometrics combined with an array of data related to the composition of the oil, including its fatty acid (FA) content [9-11]. The profiles of FAs are primarily influenced by the relevant plant variety [12,13]. From the perspective of genetic diversity, monovarietal olive oils derived from specific varieties possess defined physical and biochemical characteristics that imbue the resultant oil with distinguishing qualities. Hence, FAs are highly important in the determination of the character and authenticity of VOO. The unique aromas of different VOOs are shaped by the presence of volatile compounds (VCs). The unique characteristics of different VOO volatiles are the consequence of both the ripening process and the enzymatic and chemical reactions which transpire during oil extraction and production. Volatile character and content are the product of an array of variables, including plant variety, geographical location, altitude, regional climate and temperatures, and technological considerations [14-17].
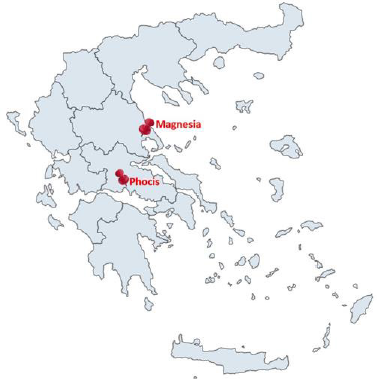
Greece is a major producer of olive oil. Figures published by Eurostat indicate that this country is the fourth largest olive oil exporter in the European Union [18]. Therefore, ensuring that the nation’s olive oil products accord with quality controls through effective regulatory and measuring processes is of immense economic significance to Greece. Moreover, it is essential that Greek olive oil retains consumer confidence by being accurately checked and authentically labeled since VOO is a product for which the value is closely allied to the manner in which it is produced and processed. The most frequently researched olive oil cultivar in Greece is the Koroneiki cultivar [5,9,19,20]. This means that other economically significant varieties have been overlooked including the Amfissis (or Konservolia) cultivar (Olea europaea var. med. rotunda) that is popular across large parts of Thessaly and Central Greece [21]. For this reason, the current study investigates the FA and VC content of VOO samples produced from the Amfissis cultivar originated from the Phocis region of Central Greece and the Magnesia region of Thessaly (Figure 1) using chemometrics. The aim of this study is to make a comparative evaluation of the samples from these two areas to identify the VOOs by their region, thereby rendering it possible to establish the regional authenticity of VOO in Greece.
Figure 1: Map of Greece showing the location of Phocis and Magnesia regions of VOOs samples from the Amfissis olive oil cultivar.
Materials and Methods
Samples
A total of 29 VOO samples were obtained from local olive oil mills under the framework of the research program QuaAuthentic_ GR, during the 2018-2019 harvesting period. The VOO samples were originated from the geographical regions of Magnesia (16 samples) and Phocis (13 samples). Olives were picked by hand or collected in nets at the stage of maturity index 5–6 and processed in selected local olive mills using the three-phase system technology. Samples were collected from November to the end of January and stored in dark glass bottles of 500 mL. The analyses of VOOs were performed soon after the production of olive oil.
Determination of Quality Indices
All the quality indices were determined according to the official method of the Commission Regulation (EEC) No 2568/91 [22]. Free acidity was expressed as % oleic acid and peroxide value was expressed as meq O2/kg. K232, K270 and ΔK were calculated from the absorption at 232–270 nm.
Determination of Fatty Acids
Fatty acid methyl esters (FAME) were prepared according to the official method of the Commission Regulation (EEC) No 2568/91 [22]. FAME were prepared in a screwcap vial, by vigorous shaking of the olive oil solution in hexane (0.1 g in 5 mL) with 0.5 mL of 2 N methanolic KOH. The analysis was performed by gas chromatography utilizing a Perkin Elmer Clarus 500 chromatograph (Perkin Elmer, Waltham, MA, USA) with a flame ionization detector. The column used was Supelco SP-2560 capillary column (75 m × 0.18 mm id × 0.14 μm film thickness) (Supelco, Bellefonte, PA, USA). Helium was used as the carrier gas with a flow rate of 1.5 mL/min. The injection volume used was 1 μL and the injector was operated at 250°C in split mode (20:1 split ratio). The column was maintained at 140°C held for 5 min, heated to 170°C at a rate of 8°C/min, heated to 210°C at a rate of 2°C/min held for 2 min, heated to 250°C at a rate of 20°C/min and held to 250°C for 10 min. The FAs were identified based on their retention times, utilizing a FAME standard mixture (Sigma-Aldrich, St. Louis, MO, USA). The FA content was expressed as a percentage m/m from the peak area.
Analysis of Volatile Compounds
The volatile compounds of VOOs were determined by solid phase microextraction-gas chromatography-mass spectrometry (SPME/GC-MS) in accordance with the method of [19] with few modifications. Five grams of VOO and 1 μL of β-ionone (Alfa Aesar, Ward Hill, MA, USA) along with a micro-stirring bar were introduced into a 15 mL screw top glass vial with PTFE/silicone septa. The SPME procedure was carried out using a divinylbenzene/carboxen/ polydimethylsiloxane (DVB/CAR/PDMS) fiber (Supelco, Bellefonte, PA, USA) with 1 cm length. The vial was placed in a 50˚C water bath and stirred at 700 rpm. The VOO sample was equilibrated for 30 min. Subsequently, the needle of the SPME fiber was inserted into the vial and exposed to the headspace. After 15 min, the fiber was retracted from the vial and inserted into the gas chromatograph. The volatile compounds were analyzed using a Thermo GC-TRACE ultra, coupled with a Thermo Mass Spectrometer DSQ II (Thermo Scientific Inc., Waltham, MA, USA). The desorption conditions were as follows: GC inlet temperature of 260˚C for 3 min in the splitless mode with a 0.8 mm injector liner (SGE International Pty Ltd, Australia).
The column used was a Restek Rtx-5MS, 30 m x 0.25 mm x 0.25 μm (Restek, Bellefonte, PA, USA). Helium carrier gas flow rate was 1.0 mL/min. The column was maintained at 40˚C held for 6 min, then heated to 120˚C at a rate of 5˚C/min, then heated to 160˚C at a rate of 3˚C min, then heated to 250˚C at a rate 15˚C/min and held to 250˚C for 1 min. The conditions of mass spectrometer were: quadrupole temperature: 150˚C; source temperature: 240˚C; transfer line temperature: 290˚C; acquisition mode: electron impact 70 eV and mass range m/z: 35-650. The identification of VC was conducted by the comparison of spectral data and arithmetic index of the VC to those of the Wiley 275 mass spectra library and Adams [23]. Retention index (RI) values of VC were calculated using n-alkane (C8–C20) standards (Supelco, Bellefonte, PA, USA). Quantification of VC was accomplished by dividing the peak areas of the compounds by the peak area of the internal standard (β-ionone) and multiplying this ratio by the initial concentration of the internal standard. The peak areas were obtained from the full scan chromatograph using the total ion current.
Statistical Analysis
Prior to the performance of statistical analysis the data were standardized by the XLSTAT ver. 2020.3.1.0 software (Addinsoft Deutschland, Andernach, Germany). Shapiro-Wilk normality test, Spearman’s rho correlation coefficients and Principal Component Analysis (PCA) were accomplished utilizing the JMP software version 13.0 (SAS Institute Inc., Cary, NC, USA). The mean values and standard deviation of each parameter from the quality indices, FAs, and VCs were calculated in Microsoft Excel based on the samples of each region (n=16 for Magnesia and n=13 for Phocis).
Results
Conventional Quality Parameters
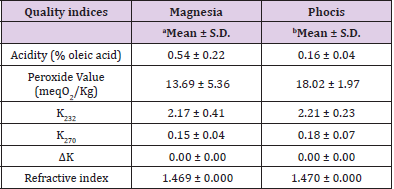
The analysis of conventional quality parameters is presented in Table 1. Free acidity of olive oil samples ranged from 0.54±0.22 to 0.16±0.04 and the peroxide values were between 13.69±5.36 to 18.02±1.97 meq O2/kg oil. K232 spectroscopic value of the samples used in this study ranged from 2.17±0.41 to 2.21±0.23, and the K270 values were between 0.15±0.04 and 0.18±0.07. ΔK was 0.00±0.00 for all samples analyzed. The refractive index of olive oil samples ranged from 1.469±0.000 to 1.470±0.000.
Table 1: Mean values and standard deviation (S.D.) of conventional quality indices of VOO samples from the Magnesia (n=16) and Phocis (n=13) regions.
Note: an= 16 samples; bn=13 samples.
Fatty Acid Composition
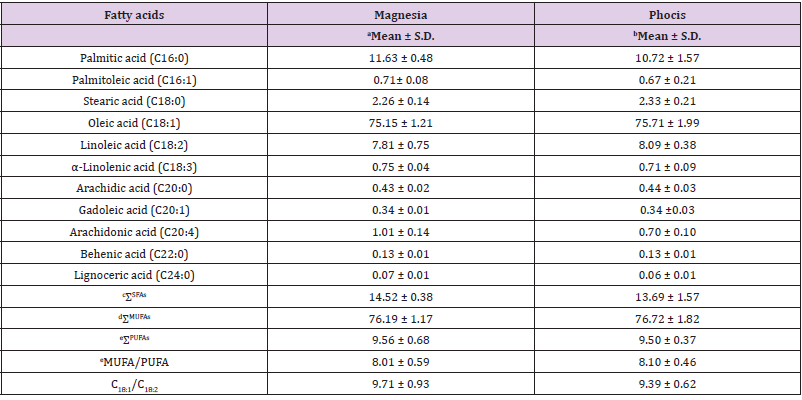
The analysis of FA composition revealed the presence of eleven FA (Table 2), with a small variance in composition as a result of the different geographical origin of VOOs. Oleic acid (C18:1) was the dominant FA for both Magnesia (75.15% ± 1.21) and Phocis (75.71% ± 1.99) regions. Slightly higher concentrations of palmitic acid (C16:0), α-linolenic acid (C18:3) and arachidonic acid (20:4) were observed in Amfissis VOO samples from the Magnesia region. The major saturated fatty acids (SFA) were palmitic acid (C16:0) determined in highest concentration in Magnesia (11.63% ± 0.48) and stearic acid (C18:0) with the highest concentration observed in the samples from the Phocis region (2.33% ± 0.21).
Table 2: Mean values and standard deviation (SD) of fatty acid composition (%) of VOO samples from the Magnesia (n=16) and Phocis (n=13) regions.
Note: an= 16 samples; bn=13 samples; cΣSFAs= Sum of Saturated Fatty Acids; dΣMUFAs = Sum of Monounsaturated Fatty Acids; eΣPUFAs: Sum of Polyunsaturated Fatty Acids; eMUFA/PUFA: Monounsaturated Fatty Acids/Polyunsaturated Fatty Acids.
Analysis of Volatile Compounds
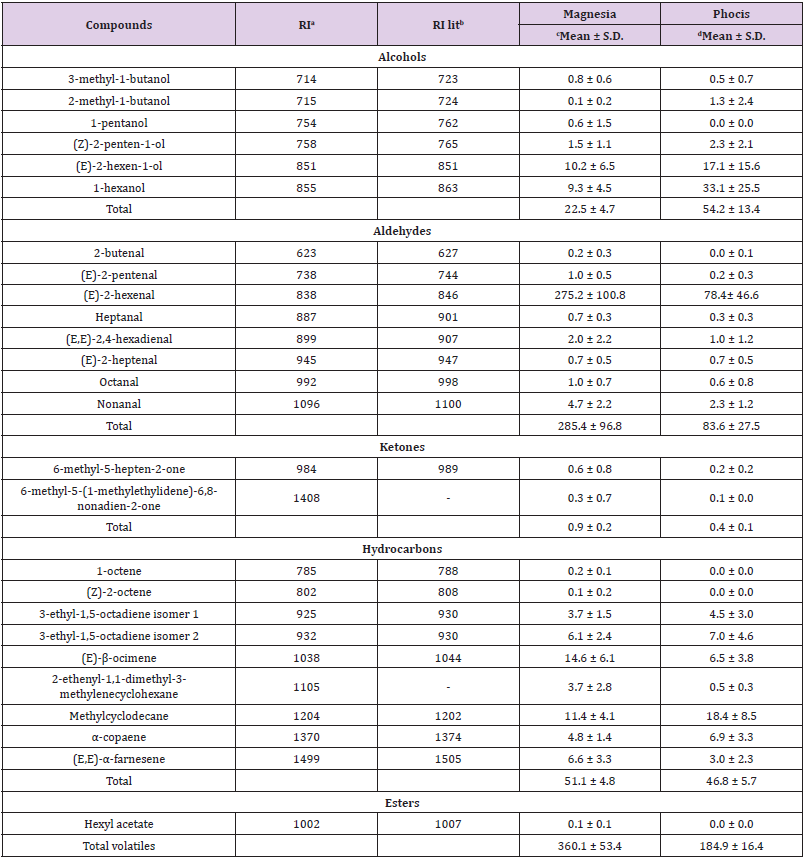
The results from the determination of volatiles is presented in Table 3. Twenty six VCs (6 alcohols, 8 aldehydes, 2 ketones, 9 hydrocarbons, 1 ester) were identified and semi-quantified using the SPME-GC-MS technique. The prominent VCs from both geographical regions (Magnesia and Phocis) were (E)-2-hexenal, (E)-2-hexen-1-ol, 1-hexanol, (E)-β-ocimene and methylcyclodecane.
Table 3: Mean values (mg kg-1) and standard deviation (S.D.) of identified volatile compounds in Amfissis VOO samples originated from the Magnesia (n=16) and Phocis (n=13) regions.
Note: aRI = tentative identification by retention index; bRI lit. = literature retention index; cn= 16 samples; dn= 13 samples
Spearman’s rho Correlation Coefficients
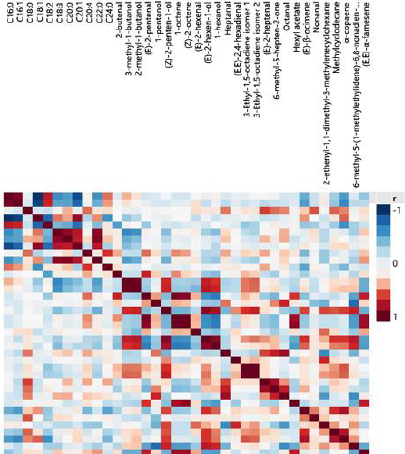
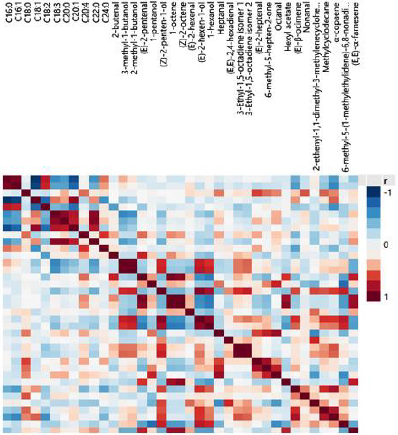
Correlations among the FA and VC concentrations from the regions of Magnesia (Figure 2) and Phocis (Figure 3) were studied using Spearman’s rho correlation coefficients in order to highlight similarities and differences between the samples. The Spearman’s rho correlation coefficients were selected over Pearson correlation coefficients as small deviations from normality were observed using the Shapiro-Wilk normality test. Strong positive (p ≤ 0.01) correlation patterns were observed for the FA arachidic acid (20:0) – α-linolenic acid (18:3) and arachidic acid (20:0) – behenic acid (22:0), whereas strong negative correlation patterns were observed between gadoleic acid (20:1) – palmitic acid (16:0) in both regions. Regarding VCs, strong positive correlation patterns were observed between the two isomers of 3-ethyl-1,5-octadiene, as well as for (E)-2-hexen-1-ol and 1-hexanol, for the VOOs from Magnesia and Phocis regions. In the VOOs from the Phocis region, strong antagonistic relationship was recorded between palmitic acid (16:0) – oleic acid (18:1) and strong positive correlations were observed for the FA, α-linolenic acid (18:3) – behenic acid (22:0) and the VCs (E)-2-pentenal – 1-octene, (E)-2-pentenal – (Z)-2-octene, hexyl acetate – 1-octene, hexyl acetate-(Z) – 2-octene, α-copaene – methylcyclodecane and (E)-2-hexen-1-ol-(Z) – 2-penten-1-ol. Differences were observed in the VOOs from the Magnesia region. Strong positive correlations were recorded among the compounds: stearic acid (18:0) – arachidic acid (20:0), stearic acid (18:0) – behenic acid (22:0), behenic acid (22:0) – 6-methyl-5-hepten-2- one, 6-methyl-5-hepten-2-one – 1-pentanol, 6-methyl-5-hepten-2- one – hexyl acetate, hexyl acetate – 1-pentanol, (E)-2-hexen-1-ol – 1-hexanol, (E)-2-hexen-1-ol – heptanal and (E)-2-hexen-1-ol – methylcyclodecane. Strong negative correlation was found between palmitic acid (16:0) and hexyl acetate.
Figure 2: Color map on correlations among fatty acids and volatile compounds from Amfissis VOOs originated from the Magnesia region.
Figure 3: map on correlations among fatty acids and volatile compounds from Amfissis VOOs originated from the Phocis region.
Principal Component Analysis
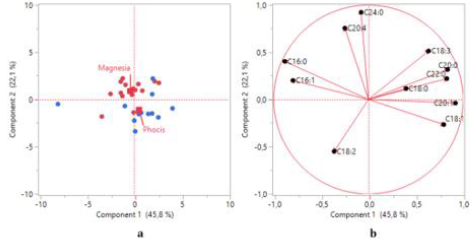
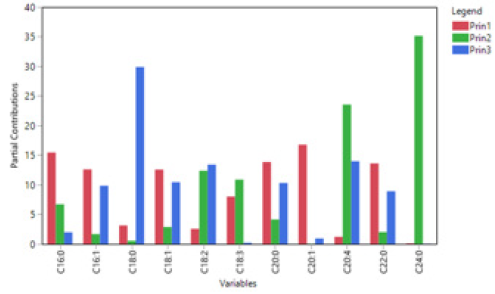
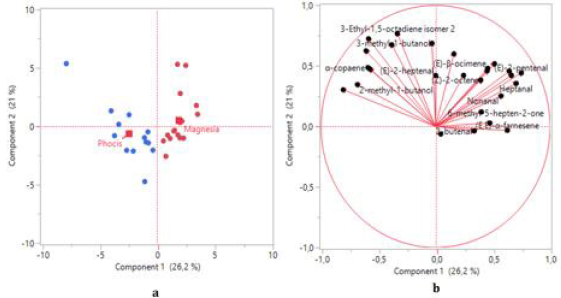
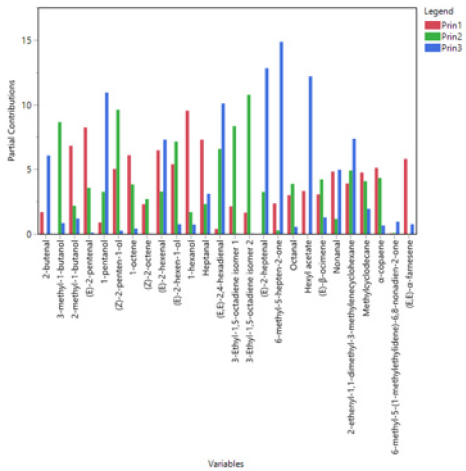
PCA was used to study possible grouping of VOO samples according to their geographical origin. Based on the data obtained from the FA composition the first two principal components (Figure 4) explained 67.9% of the total variance. According to the scores plot (Figure 4a), a separation of samples to a certain extent has been achieved, although it is evident that several VOOs from Phocis are classified in Magnesia region. The first two principal components contribute in the differentiation of samples, though the second principal component distinguishes the VOOs to a greater extent (Figure 4a). The FAs that mainly contribute in the separation of samples at the first principal component (Figures 4b & 5) are gadoleic acid (20:1), palmitic acid (16:0), behenic acid (22:0), palmitoleic acid (16:1), arachidic acid (20:0) and oleic acid (18:1). In the second principal component the most important FAs are lignoceric acid (24:0) and arachidonic acid (20:4). Strong negative correlations between palmitic acid (16:0) – oleic acid (18:1) and palmitic acid (16:0) – gadoleic acid (20:1) were observed in the loadings plot (Figure 4b), confirming the Spearman’s rho correlations reported in this study. An efficient separation was observed from the application of PCA on the concentrations of VCs (Figure 6a). The first two principal components explained the 47.2% of the total variance. From the scores plot (Figure 6b) we observed that the majority of the VCs are positively correlated which also confirms the Spearman’s rho coefficients reported previously. The first principal component is the most important for the separation of VOOs. The VCs that mainly contribute in the separation of samples are 1-hexanol, (E)-2-pentenal, heptanal, (E)- 2-hexenal and (E,E)-α-farnesene (Figures 6b & 7).
Figure 4: a) Scores plot and
b) loadings plot obtained from principal component analysis of VOO samples based on fatty acid composition.
Figure 6:
a) Scores plot and
b) loadings plot obtained from principal component analysis of VOO samples based on volatile compounds.
Discussion
Conventional Quality Parameters
The quality parameters of samples (Table 1) were within the limits described in Commission Regulation (EEC) No 2568/91 [22] for extra virgin olive oil (EVOO) and VOO. Free acidity of samples was within the limits of ≤ 0.8 and ≤ 2.0 for EVOO and VOO, respectively, while the peroxide values were in accordance with the limits of ≤ 20 meq O2/kg for EVOOs and VOOs. Limits for the spectroscopic values K232, K270, and ΔK according to EEC No 2568/91 are ≤ 2.50, ≤ 0.22, and ≤ 0.01 for the EVOO, and ≤ 2.60, ≤ 0.25, and ≤ 0.01 for VOO. Therefore the samples were classified as VOOs.
Fatty Acid Composition
The % mean values of FA of VOO samples were within the limits of the international olive oil council [24]. High levels of MUFA/ PUFA and oleic/linoleic acid (C18:1/C18:2) were observed in both regions indicating the high performance of VOOs against oxidative deterioration [25]. Limited research exists for the FA composition of olive oil from Amfissis cultivar. In a study from Andreou, et al. [26] the shelf-life of VOO extracted by non-thermal pretreatments from Amfissis, Tsounati and Manaki cultivars was evaluated. The oleic acid (18:1) and linoleic acid (18:2) levels for the olive oil samples from the Amfissis cultivar using the traditional olive oil extraction technology were 70.68% and 12.66%. In our study higher levels of oleic acid (18:1) and lower levels of linoleic acid (18:2) were observed in VOOs from both Magnesia and Phocis regions.
Analysis of Volatile Compounds
The flavor of VOO is attributed to a wide range of VC important for its quality assessment. Previous research reports indicated that the aldehydes exist in higher concentrations in olive oil compared to other flavor compounds [27]. This fact is confirmed in the current study since the total concentration of aldehydes determined in this study was 285.4 ± 96.8 mg kg-1 for Magnesia region and 83.6 ± 27.5 mg kg-1 for Phocis region, which is mainly attributed to the high levels of (E)-2-hexenal, a C6 aldehyde formed through the lipoxygenase pathway (LOX) pathway. This compound is responsible for the characteristic “green note” of olive oil [28]. The high levels of (E)-2-hexenal has been previously observed. In an earlier study of Greek olive oil it is reported that Amfissis olive oil samples had the highest concentration of (E)-2-hexenal compared to Koroneiki and Megaritiki olive oil samples [7]. However, the flavor of olive oil is not exclusively defined from the high concentrations of VCs. Other constituents, such as alcohols, ketones and esters are contributing in the flavor as well. The C6 alcohols (E)-2-hexen-1-ol and 1-hexanol were the most prominent alcohols in this study which are produced through the LOX pathway and provide the characteristic “green” aroma and astringent-sour flavor of olive oil [29]. The fruity, sweet flavor is a result of the hexyl acetate whereas the presence of 6-methyl-5-hepten-2-one, formed from the degradation of terpenic alcohols, is responsible for the pungent and fruity odor of olive oil [28,29]. High levels of the terpenes (E)-β-ocimene and (E,E)-α-farnesene were detected in VOOs from Magnesia. These compounds are biosynthesized via the mevalonic acid pathway and are highly dependent on the botanical origin [30,31].
Spearman’s rho Correlation Coefficients
The results obtained from the Spearman’s rho correlation coefficients of FA may be attributed to the variance of activity of the enzymes called fatty acid desaturases that regulate the biosynthesis of FAs during the maturation of olives. Oleic acid (18:1) and linoleic acid (18:2) are inversely connected in a way that the increase of the one FA will induce the decrease of the other. The first FA that is produced during biosynthesis of FAs is palmitic acid (16:0), which is converted to stearic acid (18:0). Subsequently, the FAs oleic acid (18:1), linoleic acid (18:2) and α-linolenic acid (18:3) are produced by the catalyzing activity of FA desaturases (stearoyl-ACP Δ9-desaturase, oleate desaturase, linoleate desaturase) [32-34]. The strong positive correlation between arachidic acid (20:0) and stearic acid (18:0) has been previously reported from Stefanoudaki, et al. [9] and Kritioti, et al. [35] who studied olive oil samples from Koroneiki, Mastoides and Cypriot cultivars.
Principal Component Analysis
PCA is a multivariate chemometric tool that is commonly used in classification problems. Gurdeniz, et al. [11] effectively applied the PCA method for the geographical separation of olive oil samples of Turkish origin, based on FA composition. The authors reported the FAs palmitoleic acid (16:1), oleic acid (18:1), linoleic acid (C18:2) and α-linolenic acid (C18:3) as the most significant for the differentiation of samples. In a study of Sicilian olive oils the PCA method was also successfully applied for the geographical differentiation and the FAs palmitoleic acid (16:1), oleic acid (18:1) and linoleic acid (C18:2) were the most influential variables for the separation of samples [10]. The high contribution of palmitoleic acid (16:1) for the geographical differentiation of samples is also confirmed in the present study. As previously mentioned, efficient separation of VOO samples from Phocis and Magnesia regions has been achieved in the current study based on the aldehydes (E)-2-pentenal, (E)-2-hexenal, and the alcohol 1-hexanol. These compounds are produced through the LOX pathway which involves the enzymes lipoxygenase and hydroperoxide lyase that oxidize and cleave, respectively, polyunsaturated fatty acids such as linoleic acid (18:2) and α-linolenic acid (C18:3) to yield aldehydes. The aldehydes are then reduced to alcohols by the enzyme alcohol dehydrogenase [36]. 1-hexanol is produced from the polyunsaturated FA linoleic acid (18:2), while the aldehydes (E)-2-pentenal and (E)-2-hexenal are produced from the oxidation of α-linolenic acid (C18:3).
Aldehydes are considered as important compounds for the authentication of olive oil. Şişik Oğraş, et al. [6] reported an effective geographical separation of olive oil samples of Turkish origin from various locations (Mediterranean, Aegean, Southeastern Anatolia, Marmara, and the Black Sea) based on volatile composition. Aldehydes, and especially (E)-2-hexenal were the most significant compounds for the separation of samples. Vichi, et al. [37] used PCA for the differentiation of VOOs from two geographical areas of Northern Italy. The authors concluded that aldehydes, including (E)-2-hexenal, exhibited a strong dependence on geographical origin of samples, therefore indicating the influence of environmental growth conditions on the activity of the enzyme alcohol dehydrogenase. The aldehyde heptanal, a product derived from the oxidation of linoleic acid (18:2) [38], was also a significant VC for the classification of VOOs. The sesquiterpene hydrocarbon (E,E)-α-farnesene is another important VC for the geographical differentiation of VOOs in the current study which is produced through the mevalonic acid pathway [31]. Terpenes can be useful markers for the authentication of geographical origin [39]. Terpenoid hydrocarbons have been effectively used for the geographical separation of extra virgin olive oils from West Liguria with the application of the PCA method [40].
Conclusion
In the present work, the analysis of the fatty acid composition
and the volatile compounds profile of VOO samples of Amfissis
cultivar originated from the Magnesia and Phocis regions was
performed and studied using chemometrics. The high levels of
MUFA (76.19% for Magnesia and 76.72% for Phocis) and MUFA/
PUFA ratio (8.01% for Magnesia and 8.10% for Phocis) indicate the
potent high oxidative stability of the VOOs from this cultivar. The
volatile compounds profile from both regions was characterized
by the high concentration of aldehydes, especially (E)-2-hexenal,
a compound that provides the characteristic “green note” of olive
oil. The determination of Spearman’s rho correlation coefficients
between fatty acids and volatile compounds was performed
separately for the two regions and eventually revealed various
differences and similarities possibly associated with the enzymes
responsible for the metabolism of fatty acids and the production
of the volatile compounds by different metabolic routes. The
application of PCA algorithm on FAs content was not very effective
for the geographical separation of samples. However, a clear
separation of VOOs was obtained based on the composition of
the volatile compounds. The aldehydes (E)-2-pentenal, heptanal,
(E)-2-hexenal, the alcohol 1-hexanol, and the sesquiterpene (E,E)-
α-farnesene had the highest contribution for the differentiation
of VOOs according to geographical origin. The present research
study highlights the unique characteristics of Greek olive oil and
promotes the endeavors for its authentication.
For more Articles on : https://biomedres01.blogspot.com/


No comments:
Post a Comment
Note: Only a member of this blog may post a comment.