Development of a Semi-Quantitative Food Frequency Questionnaire Based on a Household Nutritional Survey in Communities in North Viet Nam
Introduction
Viet Nam is located in Southeast Asia and had a population of 96.48 million in 2019, an estimated life expectancy at birth of 76 for both genders (Men 71 and women 80) in 2012 [1]. Noncommunicable disease (NCD) caused 379,000 deaths (men 203,300 and women 175,700) or 73% of 520,000 occurred deaths nationwide. About haft of NCD deaths (54.3% in men and 46.1% in women) were under 70-year-old [2]. Non-communicable disease appeared to be the major health challenge to national development in the 21st century in the country. Four types of NCD were cardiovascular diseases, cancers, diabetes, and chronic respiratory diseases and their four main modifiable risk factors were tobacco use, unhealthy diets, physical inactivity, and the harmful use of alcohol. The World Health Organization (WHO) has pointed out in 2014 that unhealthy diets caused about 1.7 million NCD deaths globally in 2009 [3]. An unhealthy diet was to be one of the major risk factors and etiologies for developing NCD [3], including cardiovascular diseases, cancer, diabetes, and other chronic diseases. Specific recommendations for a healthy diet included eating more fruit, vegetables, legumes, nuts, and grains; cutting down on salt, sugar, and fats.
It is also advisable to choose unsaturated fats, instead of saturated fats and elimination of trans-fatty acids in our foods/ recipes. To understand the underlying cause of unhealthy diets related to the development of NCD and to address the benefits of nutrients contributed by fruits, vegetables, legumes, nuts, and grains in the prevention of diseases, dietary research is essential to conduct observational studies to the prevention of cancer and NCD in each country and global. The relation of diet to cancer and NCD has been reported in 1914 as far as we have documents [4]. In addition, later in 1947, the scientist has recommended that dietary history as a tool in dietary research [5]. A dietary history provided by study participants in using a semi-quantitative food frequency questionnaire (SQFFQ) to obtain detailed information on individual long-term dietary intake of foods/recipes and nutrients was one of the best methods of dietary research [6]. To collect the dietary history, investigators will interview participants about the average use of foods during the last year, of each specified food. That is, in the prospective Health Professionals Follow-up Study and the Nurses’ Health Study in the U.S. [7-9], participants provided information about frequencies of intake (i.e. never or less than once per month, 1-3 per month; 1 per week, 2-4 per week; 5-6 per week, 1 per day, 2-3 per day, 4-5 per day, and 6+ per day).
In the other study in Japan [10], investigators have to classify into seven categories of frequencies of intake (i.e. never or seldom, 1-3 per month; 1-2 per week, 3-4 per week; 5-6 per week, 1 per day, 2 per day, and 3+ per day). We assumed that participants have three meals a day (breakfast, lunch, and dinner); the lowest frequency of intake was 24 times per year (average of 1-3 per month) or 2.2% of 1,095 (365 days x 3) meals per year. To design an SQFFQ, the development of the database and selection of foods/recipes items reflected participants’ long-term dietary intake was the primary concern. Investigators have identified foods by nutrient contribution and stepwise multiple regression analyses in developing SQFFQ [6,10-12]. This combined analysis of both nutrient contribution and stepwise multiple regression analyses were just computing work, the selected foods based on these approaches might be included some foods with a low frequency or seldom intake (less than 1-3 times per month). To overcome this limitation we proposed to present frequencies of intake by participants for each selected food item in the database to develop a feasible SQFFQ. We conducted a household nutritional survey in communities of three provinces in North Viet Nam to select foods/recipes in developing a database of SQFFQ in collecting information on individual long-term dietary intake from participants of our prospective cohort and case-control studies in Viet Nam.
Methods
Conduction of a Cross-Sectional Nutritional Survey
We conducted a cross-sectional nutritional survey, householdbased using the designed questionnaire of 24-hour recall food records. Study sites were in three communes (clusters) represented three provinces located in the Red Delta River in the North Viet Nam, named Hung Yen, Ha Nam, and Bac Ninh (in proximity to the Hanoi city). Study time was in the 4th quarter of 2017.
The Designed Questionnaire of 24-Hour Recall Food Records
Part 1, family member registration: We collected information of each family member (Name, age, sex) and registered daily for breakfast (main=1/addition=2); lunch (main=3/addition=4); dinner (main=5/addition=6); and places of intake (at home or outside) [13]. Part 2, collection of 24-hour recall food records: We reported data and information for
i) Food name and recipes including information on food/recipe name, processing, and cooking methods.
ii) Weight before eating included name of measuring unit (MU), number of MU, the weight of one MU (in gram), and wasted proportion parts.
iii) Transfer for the next meal included information of food leftover, raw/ cook, name of measuring unit (MU), number of MU, the weight of one MU (in gram), remain in gram, clean-raw equivalence.
iv) Food coded following the list of available foods/recipes in Viet Nam. The designed 24-hour recall food records included these data and information to address Vietnamese diet customs. That is, household members eat together and share dishes for breakfast, lunch, and dinner at home. The interviewers attended the trained course in both class and pilot field practices in households for completeness of registered foods/recipes items and the accuracy of collected data and information presented in the designed questionnaire of 24- hour recall food records.
Conducted 24-hour Recall Food Records
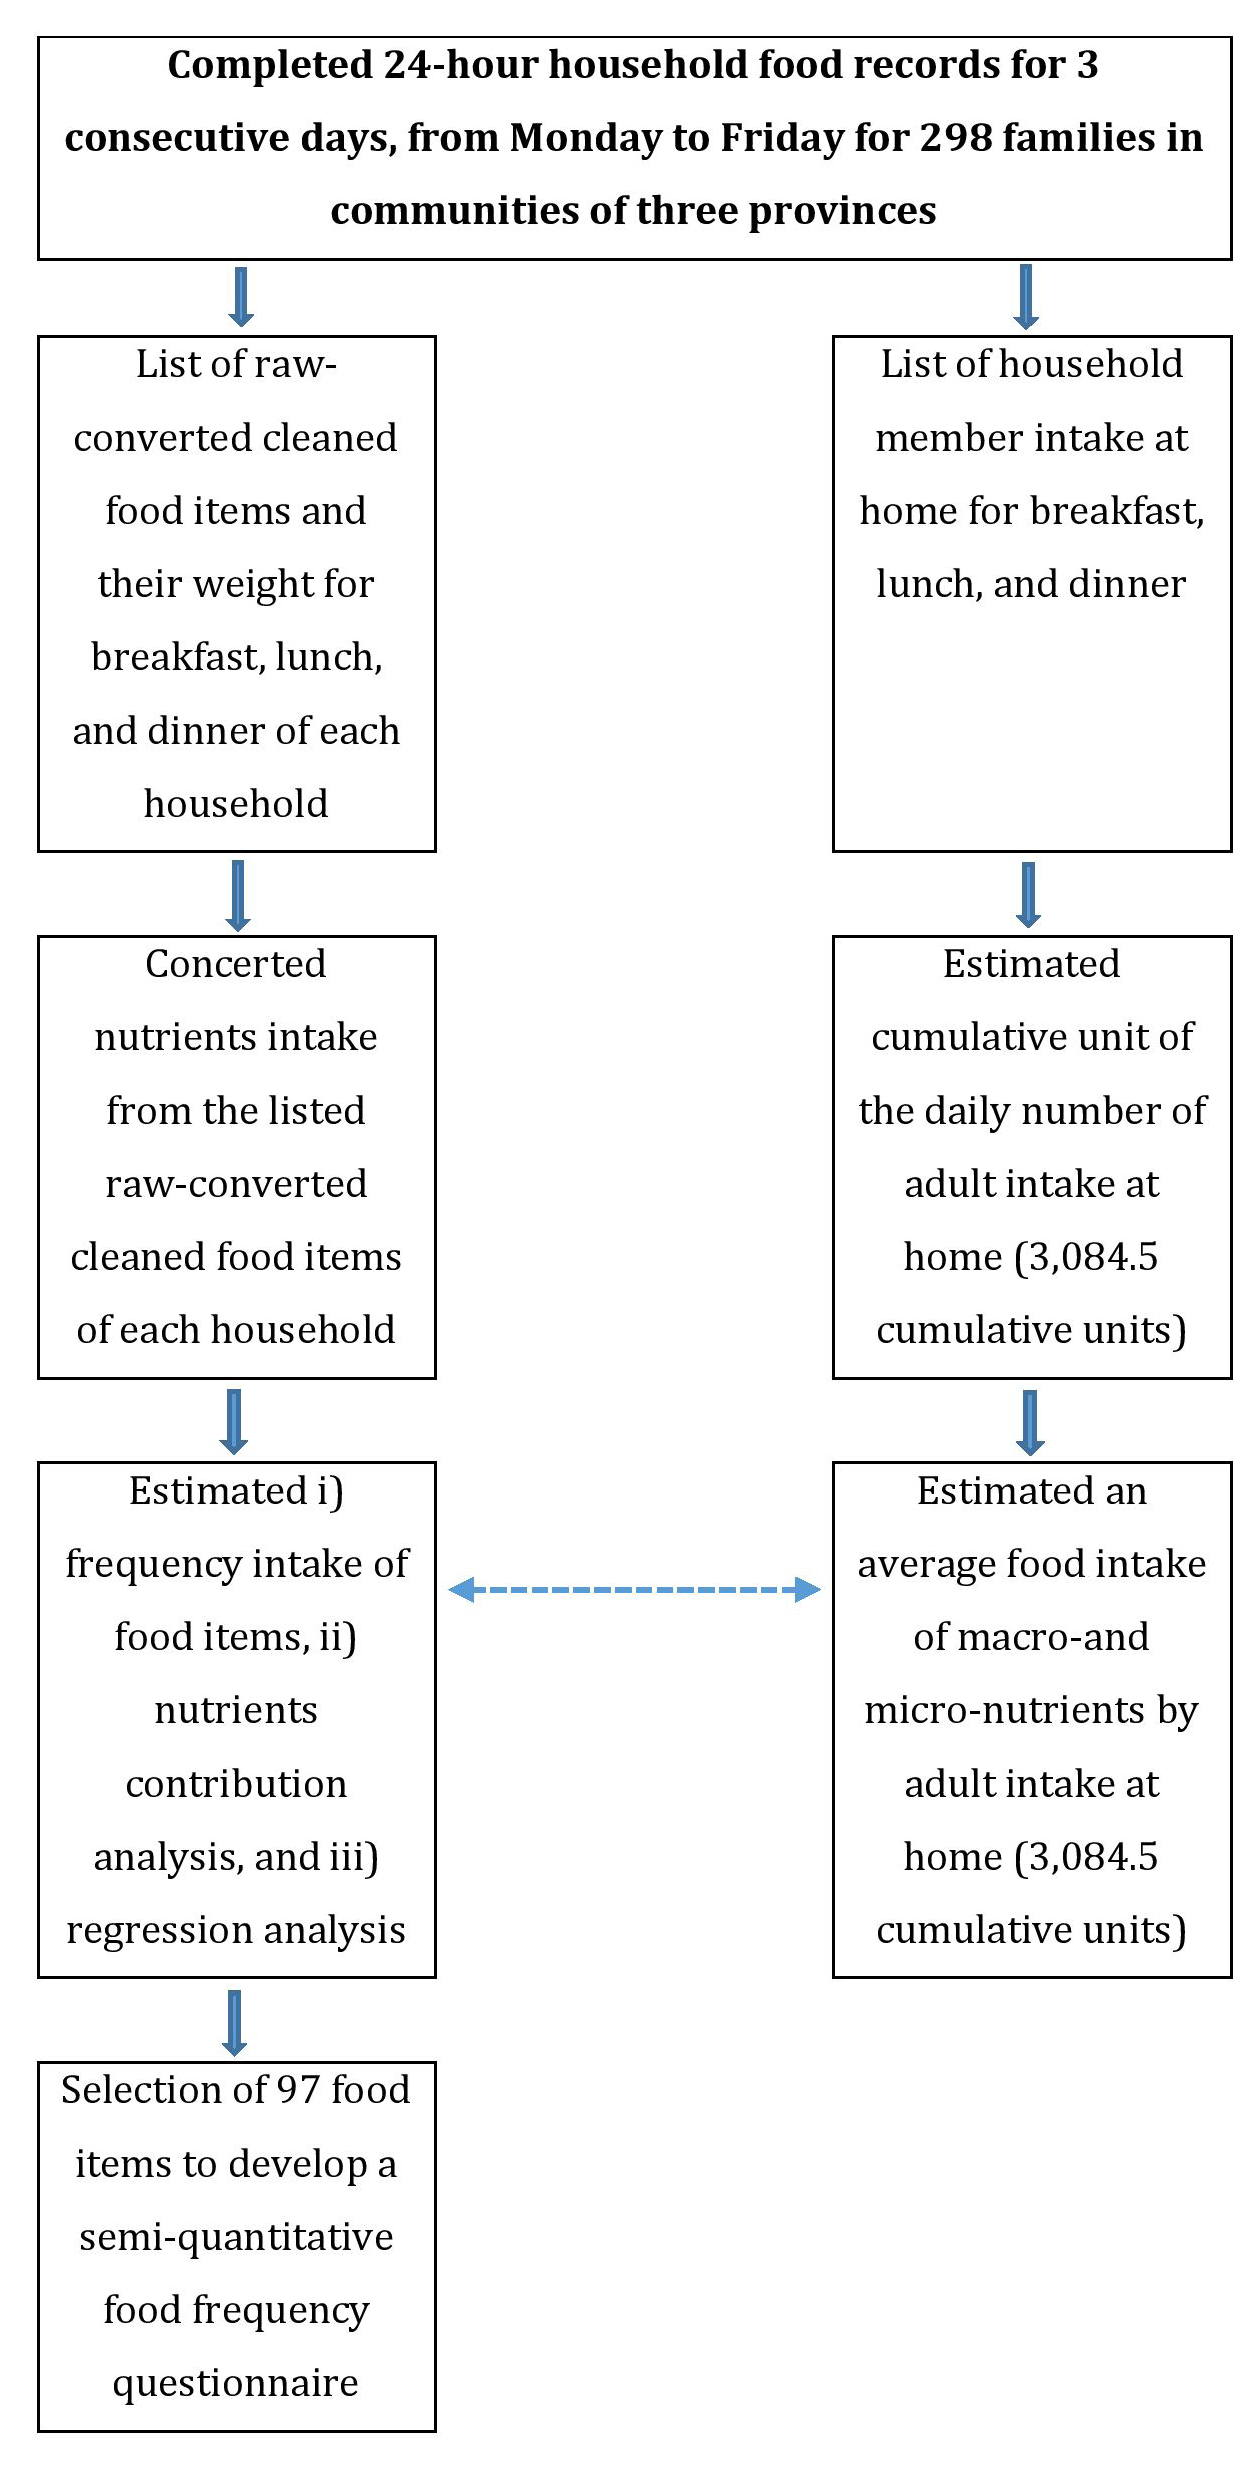
A household survey of 24-hour recall food records was conducted in 3 consecutive working days for 300 households (Figure 1) in Hung Yen (100 households), Ha Nam (100 households), and Bac Ninh (100 households) provinces by using the designed questionnaire of 24-hour recall food records from the National Nutrition Institute and its guidelines [13]. We randomly recruited the first household in each cluster, and then recruited the next household based on the door-to-door, until achieved 100 households from each cluster. Finally, we excluded two households in Hung Yen province due to some missing data and errors and there were 298 households to be eligible for the final data analyses in total. Interviews collected dietary information by a face-to-face interview in the households by the two-trained interviewers from the department of Nutrition of Hanoi Medical University. The investigators interviewed the household about all foods/recipes consumed by themselves at their house during the last 24 hours. All household’s members were registered for their breakfast (main=1/addition=2); lunch (main=3/addition=4); dinner (main=5/addition=6); places of intake were at home or outside.
The number of family members of 298 households was 1,327 (participated in the first day), 1,321 (second day), and 1,320 (third day). We calculated the number of home rations and weighted by age and sex for each family member, then sum up for total rations daily and three days. We assumed that the intake ratio of food of adult men aged 18-60 was to be 1.0. Then that was 0.4 for the age 1-3, 0.6 for the age 4-6, 0.8 for the age 7-10 and 61 or higher, 1.0 for the age 11-14 (for both boy (men) and girl (women)); 1.2 for boy and 1.1 for the girl for the age group 15-17; and 0.9 for girl (women) age 18-60 [13]. During three consecutive working days, 3,968 person-day were registered and the number of rations was to be 3,084.5 (Figure 1). We reported every food item in each meal with its estimated weight (in gram) and then converted it into a clean-raw weight (in gram). In total, the participated family members of 298 households consumed 257 food items for three days. In three cluster communities, farm markets provided the main foods/recipes as raw products. Before cooking, the clean-raw foods were prepared by excluding the wasted parts. For example, the proportion of wasted parts for some vegetables was 45% (Maize seeds, fresh, raw), 29% (Limnophila aromatic), 15% (Water spinach); and for some fruits was 35% (Pomelo), 25% (Orange), and 25% (Lemon) [14].
We converted into nutrients contributed by all clean-raw food items for every household, for daily, and for three days on average. Nutrients of interest: Based on the Viet Nam Standard Food Composition Tables (revision 2007 and updated in 2019) [14], the following 16 nutrients were selected: energy, protein, fat, carbohydrate, dietary fiber, vitamins (vitamin A, C, B1, B2, and carotene), minerals (sodium, potassium, magnesium, phosphorus, iron, and zinc). Quality management: when using the designed questionnaire of 24-hour recall food records in the participated households, we used the supported tools included a picture of selected foods/recipes with its portion size and weight of rice, fruits, vegetables, fishes in the condition of raw and cooked foods/ recipes. The experienced research nutritionists have to review and correct any errors for not only of completeness of registered foods but also the accuracy of collected data and information in the completed questionnaire of 24-hour recall food records, and family member registration who shared the foods/recipes at their home.
An Assumption of the Frequency of Intake During the Last Year of Each Specified Food in the Designed SQFFQ
Based on the prospective Health professionals Follow-up Study and the Nurses’ Health Study in the U.S. [7,8,9,15] and the other study in Japan [10], investigators have to classify the lowest frequency of intake as about 24 times per year (average of 1-3 per month). We assumed that participants in our study populations have three meals a day (breakfast, lunch, and dinner); the lowest frequency of intake was 24 times per year (average of 1-3 per month) or 2.2% of 1,095 (365 days x 3) meals per year. Our study populations comprised 298 households for three days, the total household days were 894. Therefore, we will present results for both select foods/recipes with at least 20 times of intake (2.2% of 894), and for foods/recipes with frequencies of intake less than 2.2% in the database of the current household nutritional survey.
Data analysis and Selection of Foods/Recipes
We estimated nutrients from the food by multiplying the foods/recipes intake (in grams) with nutrient content per gram of the food as listed in the Vietnamese Food Composition Table [14] (revision 2007 and updated in 2019 (in preparing)) in using an access programming. According to the contribution analysis and multiple regression analysis, we selected all foods/recipes with up to 90% cumulative contribution for these 16 nutrients. Afterward, all foods/recipes with up to 90% cumulative contributions and 0.90 cumulative multiple regression co-efficient were included in the SQFFQ. In addition, we estimated frequencies of intake (%) for each of the foods/recipes against a total of 894 household-day.
Results
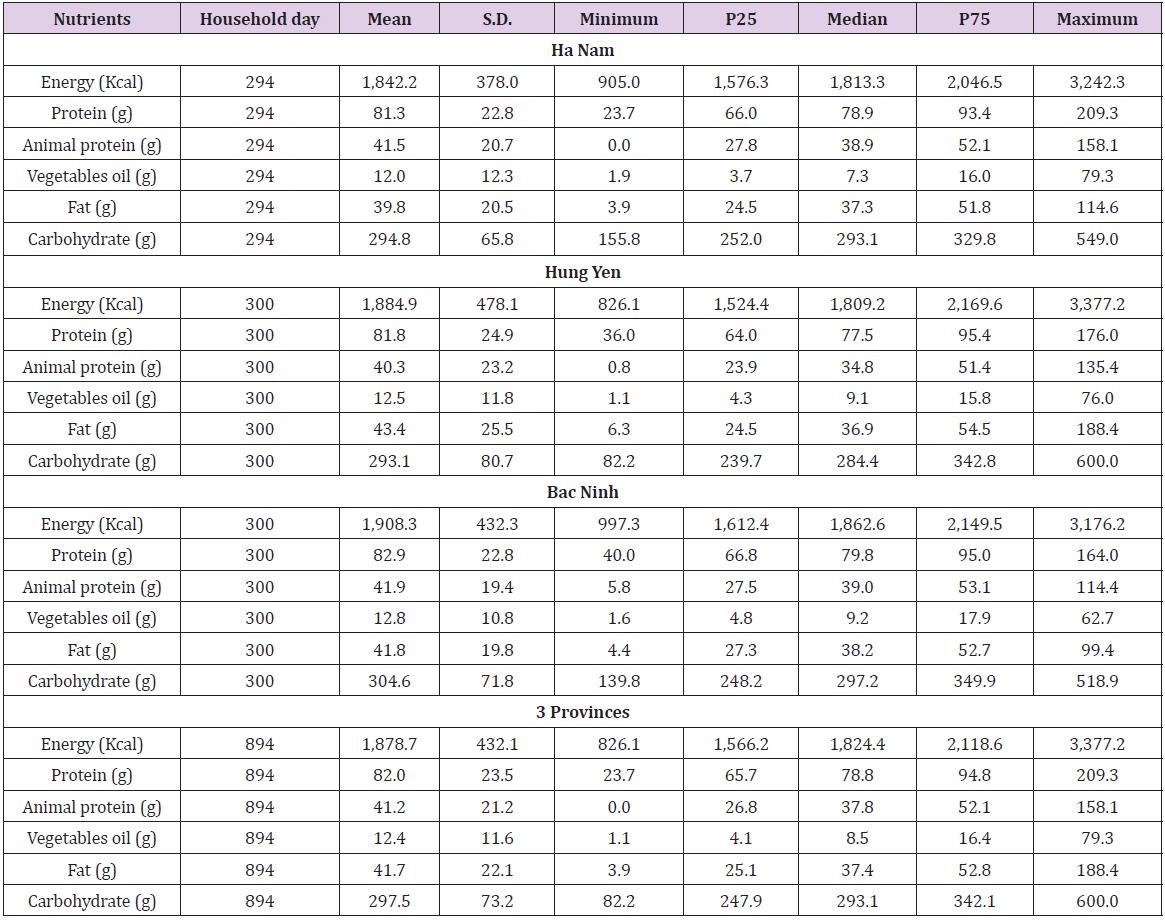
Study participants comprised of 3,968 person-day (1,947 men and 2,021 women). Over 50% of person-day aged 18-<61 in both men and women. The aged 61 or older was 11.4% (men 10.2% and women 12.6%). Enfant (Aged 1-<4) included 343 (8.6% of total person-day), children were 298 (7.5%) (Aged 4-<7), 269 (6.8%) (Aged 7-<11), 232 (5.8%) (Aged 11-<15. The estimated number of rations was 3,084.5, (Table 1). Overall, macronutrients intake by 894 household-day (mean ± standard deviation (S.D.)) was for energy (1,878 ± 432.1 kcal), protein (82.0 ± 23.5 grams), animal protein (41.2 ± 21.2 grams), vegetable oil (12.4 ± 11.6 grams), fat (41.7 ± 22.1 grams), and carbohydrate (297.5 ± 73.2 grams). The estimated median intake was 1,824.4 kcal, a minimum of 826.1 kcal, and a maximum of 3,377.2 kcal. By provinces, the mean energy intake ranked between 1,824.2 to 1,908.3 kcal. The median energy intake ranked between 1,809.2 to 1,862.6 kcal, (Table 2).
Table 1: Characteristics of study participants (in person-day) by age group and gender.
Note: By the age groups, the intake ratio of food of adult men aged 18-60 assumed 1.0. Then that was 0.4 for the age 1-3, 0.6 for the age 4-6, 0.8 for the age 7-10 and 61 or higher, 1.0 for the age 11-14 (for both boy (men) and girl (women)); 1.2 for boy and 1.1 for the girl for the age group 15-17; and 0.9 for girl (women) age 18-60. During three consecutive working days, 3,968 person-day were registered and the number of rations was 3,084.5. #Children less than 1-year-old not included in the study population because they were not shared foods/recipes with other members in households.
Table 2: Macronutrients intake by participants in three provinces for one intake ration.
Note: S.D: Standard Deviation, P25: 25th percentile, P75: 75th percentile.
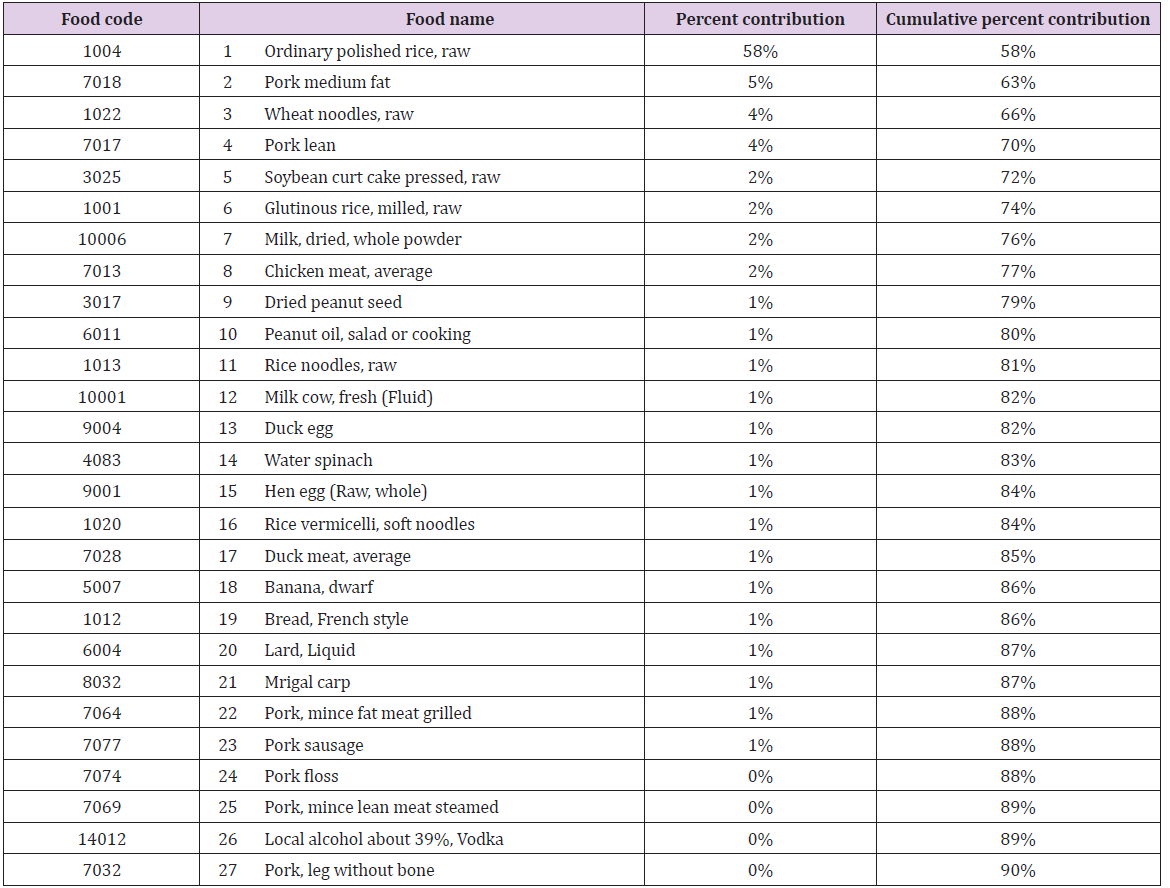
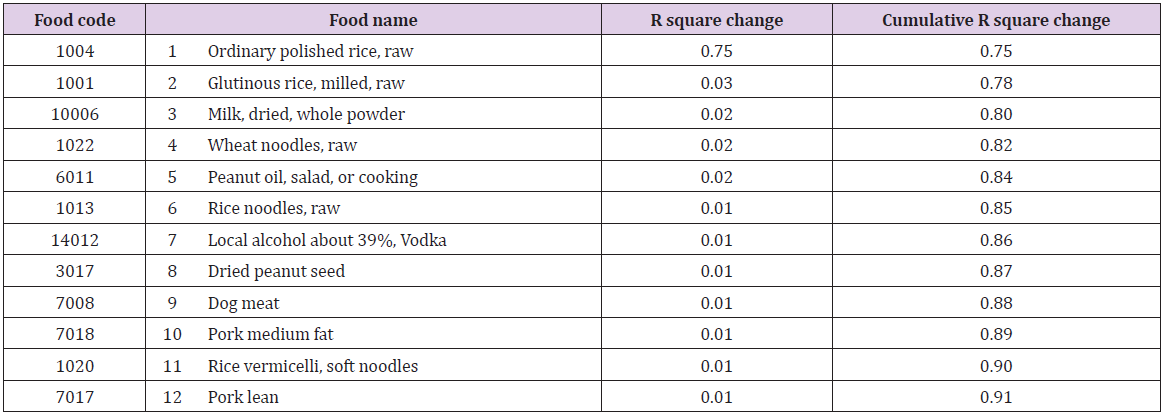
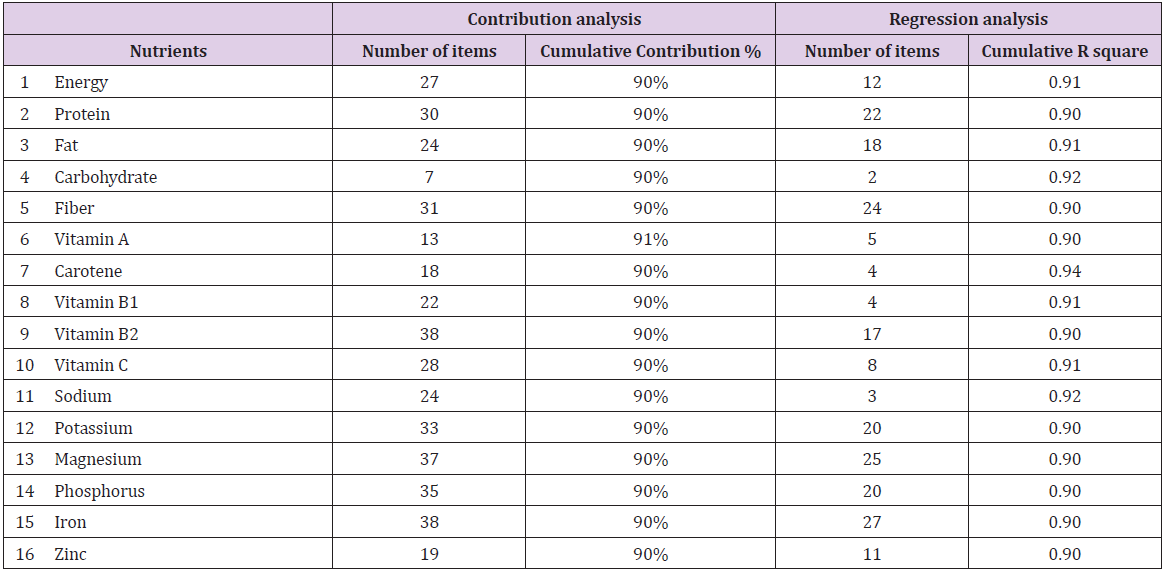
For energy contribution, there were 27 foods/recipes that contributed up to 90% and the major contribution was ordinary polished rice (58%), followed by pork medium fat (5%), wheat noodles (4%), and pork lean (4%), (Table 3). The cumulative R square change was up to 0.91 and included 12 foods/recipes. The highest R square change was ordinary polished rice (0.75), followed by glutinous rice, milled (0.03), milk, dried-whole powder (0.02), and wheat noodles (0.02), (Table 4). Overall, for 16 nutrients of energy, protein, fat, carbohydrate, dietary fiber, vitamins A, C, B1, B2 and carotene, sodium, potassium, magnesium, phosphorus, iron, and zinc, the number of foods/recipes contributed up to about 90% was 27, 30, 24, 7, 31, 13, 18, 22, 38, 28, 24, 33, 37, 35, 38, and 19, respectively. For those 16 nutrients, the number of foods/recipes with the cumulative R square up to about 90% was 12, 22, 18, 2, 24, 5, 4, 4, 17, 8, 3, 20, 25, 20, 27, and 11, respectively, (Table 5).
Table 5: Number of food contributing with up to 90% cumulative contribution and 0.90 R square by the participants for each nutrient.
In total, 97 foods/recipes were selected and they included 73 items with the frequency of intake of 20 or higher times (2.2% of 894 household-day) and the remained 24 items with the frequency of intake less than 20 times in total 894 household-day. The highest frequencies of intake were the ordinary polished rice, raw with 891 times (99.7% of 894 household-day). The estimated mean intake was 303.4 grams per day, and the percentile (P) was 249.3 grams for P25 and 362.1 grams for P75. The lowest mean intake was one for the beef tongue (0.1% of 894 household-day). For detailed selection information of contribution to 16 nutrients of energy, protein, fat, carbohydrate, dietary fiber, vitamins A, C, B1, B2 and carotene, sodium, potassium, magnesium, phosphorus, iron, and zinc by the 97 selected foods/recipes items were presented. Among these 16 nutrients, the highest contribution for 14 nutrients was the milk, dried-whole powder; followed the next contribution for 13 nutrients were 5 items of the ordinary polished rice, raw; water spinach; chicken meat, average; pork lean; and pork medium fat. For detail selection information selection by R square up to 0.90 cumulative multiple regression co-efficient for 16 nutrients, the ordinary polished rice, raw contributed to 12, followed by the pork lean to 10, and milk, dried-whole powder, pork medium-fat to 9 nutrients. (Data not shown). In total, the database comprised of 12 groups of foods/recipes that included cereals (9 items), peanuts and beans (7) vegetables (24), fruits (10), fat and oil (3), red and white meats (22), fishes (10), eggs (4), milk and its products (3), snacks (2), salt and fish sauce (2), and alcohol or vodka (1).
Discussion
The Main Findings
In total, study participants consumed 257 foods/recipes during three consecutive weekdays by 298 households. The present main findings presented the list of foods/recipes of the database of SQFFQ for dietary research in the country with a unique Vietnamese diet custom in households with the main foods/recipes provided daily from the local farm markets. Based on the nutrient contribution up to 90% and cumulative R square up to 0.90 multiple regression co-efficient for 16 nutrients, the recommended number of foods/ recipes items was 97 (included 73 items having the frequencies of intake of about 2.2% or higher and remained 24 items less than 2.2% of all 894 household-day). We collected from three provinces border with the Hanoi city with a relatively large sample size of 298 households having 1,327 members for three consecutive days that would be currently represented the local nutritional status in developing and designing SQFFQ. We divided 97 selected food items into two groups having the estimated frequencies of intake at least 2.2% and below this cutoff level for further decision in developing a specific SQFFQ for cancer, other NCD, or focus on a specific nutrient related to consumer’s health depended on the local communities. Our results provided the updated nutritional status for the Red Delta River in North Viet Nam for the macronutrients of energy, total protein, total fat, and carbohydrate intake in three communities.
Our innovative approaches were to emphasize developing a database of SQFFQ to study the association of local diet with cancer and other NCD included metabolic disorders and diabetes. Besides, we analyzed and added information on frequencies of intake by 894 household-day in connecting with data computing outcome of cumulative up to 90% contributions and 0.90 cumulative multiple regression co-efficient [6,10,11,12] for 16 nutrients. Based on the current findings, we proposed the lowest frequency of intake was 6-11 per year for each specific food/recipe. Therefore, we proposed to classify into seven categories of intake frequencies: never or seldom, 6-11 times/year, 1-3 times/month, 1-2 times/week, 3-4 times/week, 5-6 times/week, and 1-3 times/day. The final designed SQFFQ and its validation will report in the other work. Our results of the estimated 16 nutrients of energy, protein, fat, carbohydrate, dietary fiber, vitamins A, C, B1, B2 and carotene, sodium, potassium, magnesium, phosphorus, iron, and zinc have consisted with the findings from the National Nutritional Survey for the same region of the Red Delta River in 2009-2010 [13]. For internal comparison, between three clusters, the estimated amount of intake of these 16 nutrients has also consisted. The results suggested that the present database would be represented the current dietary status of participating communities to develop an SQFFQ.
Vietnamese Dietary Patterns
The ordinary polished rice was the main food that contributed up to 58% of energy with the mean intake per adult person per day of 303.4 grams. The ordinary polished rice is also rich in non-animal protein, vitamin B1, vitamin B5, carbohydrates, and several minerals [14]. The other good diet of Vietnamese is many vegetables, about one-fourth of selected food items (24 of 97 listed items), fruits (10 of 97 listed items), and fish (10 of 97 listed items). The other good diet custom is household-based in using daily fresh farm products. Vietnamese women mainly have meals of breakfast, lunch, and dinner at home and rarely tobacco smoking and alcohol drinking [1,2]. These healthy lifestyles resulted in the positive estimated life expectancy at birth in women was as high as 80 in 2012. In addition, Vietnamese women have the lower estimated cancer incidence rate of all cancers excluding non-melanoma skin cancer (114.3 per 100,000, age-standardized rate using the Segi- World population structure, ASR) than men 173.0 per 100,000, ASR), and women in Japan (185.7 per 100,000, ASR), and women in the more developed regions (239.9 per 100,000, ASR) [16]. Using the designed current SQFFQ to clarify protective factors related to foods/recipes against cancer in Viet Nam is timely needed.
Number of Selected Foods/Recipes Included in the SQFFQ
Our findings suggest that the total listed foods/recipes were 97 items, and the database comprised 12 groups. In other countries in Asia, the number of listed foods/recipes was 102 in Japan [10], 112 in Korea [17], 163 in Singapore [12], 184 in India [18], 119-125 in China [19,20]. The number of food items of the present database of SQFFQ in the North Viet Nam (97 items) was shorter than other designed SQFFQ in these countries. To address the quality of our designed SQFFQ, we will report soon the results of its validation of feasibility, practicality, and reliability.
A Possible Limitation of the Present Study
Our current study was just to select foods/recipes in the development of a database of SQFFQ and it needs to validate. The other limitation was that the obtained foods/recipes have not weighted for each item. Despite these limitations, our findings have the first development of the database of SQFFQ to collect information on individual long-term dietary intake to understand the underlying cause of unhealthy diet-induced cancer and other NCD in the country.


No comments:
Post a Comment
Note: Only a member of this blog may post a comment.