Evaluation of Myocardial Infarction in Pigs by Coronary Spectral CT Angiography
Introduction
Acute Myocardial Infarction (MI) is one of the major causes of morbidity and mortality in western countries [1]. Noninvasive imaging for MI detection, patient risk stratification and treatment monitoring is needed especially when Electrocardiography (ECG) and myocardial enzyme with no clinical clue. Multidetector CT has been used for heart morphology and coronary stenosis evaluation for many decades [2,3]. However, even mild coronary stenosis could not always exclude vessel-specific myocardial ischemia [4]. In addition, additional contrast material and radiation exposure limit the use of CT perfusion to evaluate myocardium [5]. In clinical practice, comprehensive evaluation of coronary artery stenosis and myocardial perfusion in one examination is desirable [6]. The advent of dual energy spectral CT has sparked renewed interest in clinical applications for many organs [7-10]. The strength of monochromatic energy image in improving image quality at optimal keV and increasing Contrast to Noise Ratio (CNR) at high keV was outlined; [11,12] the iodine density image was highlighted for the capability to quantify Iodine Concentration (IC) [11,13]. Consequently, our study aims to evaluate the myocardial infarction by Coronary Spectral CT Angiography (S-CCTA) based on the advantages mentioned above to discuss its strength, potential and limitations. The purpose of the current study was in three folds:
1. To investigate whether S-CCTA could assess MI
2. To define the best parameters of S-CCTA for MI delineation
3. To discuss the correlation between myocardial IC and cardiomyocyte apoptosis.
Methods
Experimental Protocol
Twelve Chinese mini pigs (5 males; weight, 20.23 ±1.23 kg; age, 6.0±0.7 months) underwent Percutaneous Coronary Intervention (PCI) to produce acute ischemia/reperfusion MI model by balloon dilatation. In compliance with the NIH guidelines for the use of laboratory animal, these mini pigs received human care. After premedication with ketamine (20 mg/kg), Xylazine Hydrochloride (1.5mg/kg) and atropine (0.02mg/kg), the pigs were intubated, anesthetized and mechanically ventilated with an admixture of 2.5%-3.5% sevoflurane and 100% oxygen. Baseline heart rate, ECG, and weight of animals were acquired before modeling. Before PCI, heparin was administered at an initial dose of 10,000IU intravenously, followed by additional 4,000IU/h to maintain anticoagulation throughout the PCI procedure [14]. The angioplasty balloon was positioned in the Left Anterior Descending Artery (LAD) just distal to the first diagonal artery. Acute MI was confirmed by ECG. After 90-minutes occlusion, the angioplasty balloon was drawn back.
Spectral CT
After 4±1 days of MI model establishment, the pigs underwent S-CCTA. Induced anesthesia was the same as above during PCI. Anesthesia was maintained by intravenous disoprofol (5mg/ kg/h). Respirator was used to help and control the breathing. All pigs underwent S-CCTA on a single-source dual energy spectral CT (Discovery CT750 HD CT Freedom Edition scanner, GE Healthcare, USA). The parameters were as following: Gemstone spectral imaging mode with fast peak tube voltage switching between 80 and 140 kVp during a single rotation, axial plane with 64 × 0.625 mm collimation, 350-msec gantry rotation time, 175-msec x-ray exposure time. All pigs received 1.5 ml/kg contrast material (Ultravist 370, Bayer Schering Pharma, Germany) followed by 30 ml saline at a flow rate of 3.0ml/s. Bolus tracking with a Region of Interest (ROI) was placed in ascending aorta and was used to synchronize the arrival of contrast material to start the image acquisition (trigger threshold of 120 HU). The radiation dose was recorded.
S-CCTA Images Processing
The monochromatic S-CCTA images were reconstructed in standard short axial plane with slice thickness of 2.00 mm. The density of infarction area (referred to the myocardium in tan or white color on TTC stain mentioned later), remote myocardium (myocardium in an unaffected coronary artery territory, usually the inferior wall) and the noise were measured. Identical ROIs on S-CCTA images of different energy were adopted by adjusting monochromatic energy from 40keV to 140 keV at a 5keV interval. The optimal keV was chosen based on the CNR, signal to noise ratio (SNR) and noise.
CNR = (HUremote – HUinfarct) / noise
SNR = HUinfarct / noise.
Where H Uremote represented the mean CT value of remote myocardium, and HUinfarct indicated the mean CT value of infarction. The noise was derived from the standard deviation of CT value in the remote myocardium.
In addition, the mean CT value of infarction area, risk area (the adjacent segments of infarction) and remote myocardium was recorded respectively to observe the density change from 40keV to 140 keV at a 5keV interval (spectral curve).
The optimal keV and iodine density images of S-CCTA were reconstructed in short axis. Thereafter, the CT value and IC were measured in the infarction region, risk area and remote myocardium of each pig. To maintain the consistency of the size, shape and position of ROIs among different CT images, the ROIs were automatically copied by the software and adjusted slightly by hand if necessary. Images were assessed in consensus by two experienced readers (A and B, with 5 and 11 years of experience in CCTA, respectively). For infarction observation, the CNR and SNR were calculated as mentioned above. Finally, objects with noreflow phenomenon at late enhancement imaging were recorded. The IC in no-reflow region (persistent hypo-enhancement on late enhancement images), infarction and remote myocardium was measured on S-CCTA.
Histopathology
At the conclusion of radiologic examinations, the animals were euthanized with overdose vecuronium bromide. The hearts were sliced into short axises of about 4mm and incubated in the triphenyl tetrazolium chloride (TTC) (1mg/100ml) at a temperature of 37℃ by water bath. Remote normal myocardium was delineated as the living tissue and is colored with red, while the infarcted tissue is colored in pale tan. With consideration of S-CCTA images and gross specimen, serial cutting sections in the no-reflow region, infarction and remote myocardium were used for immunofluorescent staining. Terminal deoxynucleotidyl transferase-mediated dUTP Nick-End Labeling (TUNEL) stain of myocardium was used to observe cardiomyocyte apoptosis. The TUNEL positive nuclei were counted by image analysis system “Image-Pro Plus Version 6.0”. The mean values of positive nuclei count/area were recorded [15].
Infarcted Segment Evaluation of S-CCTA and TTC Stain
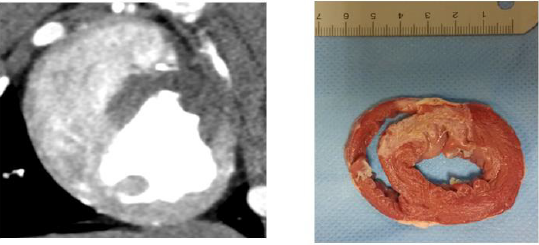
MI of all the 17 segments according to standardized myocardial segmentation was evaluated by the two points scoring systems. (15) S-CCTA image analysis was performed by using dedicate visual evaluation on optimal energy images. For S-CCTA, score 0 indicated no hypo-perfusion, score 1 represented hypo-perfusion observed. For TTC stain, myocardium in tan color was classified as infarction (score 1) and viable myocardium in red color was regard as score 0 (Figure 1) [16].
Statistical Analysis
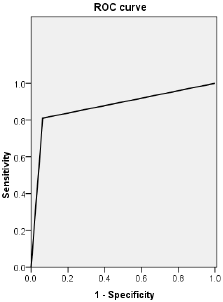
The differences among or between groups were compared by using one-way Analysis of Variance (ANOVA) and Least Significant Difference (LSD) test or t test. The spectral curve of different regions was fitted by the best regression model on curve estimation provided by PASW. Accordingly, the value of slope was derived from the preferred curve. For comparing among different regions, the value of slope underwent logarithmic transformation [17]. The categorical inter-method agreement between S-CCTA and TTC stain was calculated by using the Cohen κ [16]. Receiver Operating Characteristic (ROC) curve was used to investigate the ability of S-CCTA on differentiating infarcted myocardial segments taking the TTC stain as gold standard. The correlation between IC and cardiomyocyte apoptosis of no-reflow region, infarction and remote myocardium was tested by Pearson correlation analysis. P<0.05 was considered statistically significant.
Results
Acute MI models were performed in 12 pigs. However, 2 of them died of ventricular fibrillation soon after PCI, 1 of them died during the S-CCTA examination. Finally, 9 Chinese mini-pigs (6 females; weight, 20.17±1.35kg; age, 5.3±0.6months) were included in current study. The heart rate during S-CCTA was 87±6 per minute. The radiation dose of S-CCTA was about 18.45mGy (CTDI), 193.70- 258.27 mGy.cm (DLP).
Spectral Curve
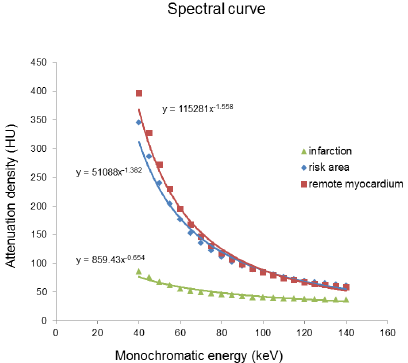
As the monochromatic energy increase from 40keV to 140keV, the CT value steadily decreased in remote myocardium, risk area and infarction (396.08~58.01HU, 61.30~344.62HU, and 86.80~36.90HU, respectively) (Figure 2). Significant differences of CT value among three regions at 40keV were observed (ps≤0.001). The exponential regression model was optimal for the spectral curve after comparison by curve estimation.16 The logarithmic transformed slopes of remote myocardium, risk area and infarct myocardium were 5.06±0.26, 4.71±0.27 and 2.78±1.03 respectively. Significant difference was detected among them (ps<0.001) (Figure 2).
Figure 2: The spectral curve of the mean attenuation density in the remote myocardium, risk area and infarction myocardium.
CT Value or IC Differences
The CT value or IC difference among infarction, risk area and remote myocardium was shown in Table 1 (ps<0.05).
Table 1: The CT Value, IC or slope of spectral curve difference among Infarction, Risk Area and Remote Myocardium.
Optimal Kev Setting for Differentiation
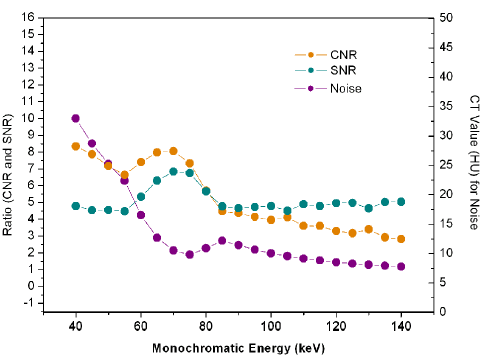
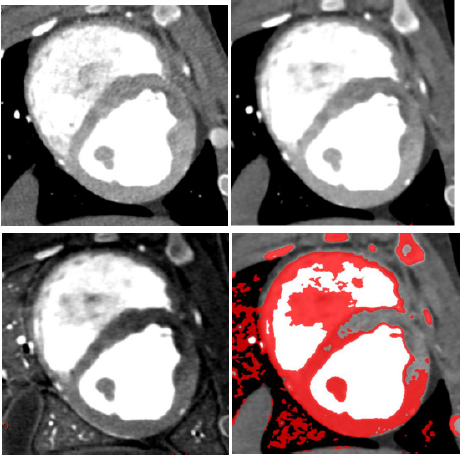
The scatterplot showed that 70keV ~75keV were the optimal monochromatic energies to observe infarction region on S-CCTA with higher CNR, SNR and lower noise (Figure 3). 70keV was chosen as the optimal monochromatic energy in our study for the following measurement and comparison. The 70 keV multiplanar reconstruction images could be overlaid with iodine density images; it could provide intuitionistic observation for the location and margin of MI (Figure 4).
Figure 4: A 7-month female pig with acute MI. The anterior and anterior septal hypo-perfusion was demonstrated in A. High voltage B. 70keV C. Iodine density D. 70keV overlay with iodine density images. D depicted the hypo-perfusion more clearly.
Diagnostic Ability of S-CCTA to Differentiate Infarct Segments
Figure 5: ROC curve of CT value obtained by S-CCTA to distinguish infarct segments from normal myocardial segments confirmed by TTC stain.
Categorical inter-method agreement between S-CCTA and TTC stain was almost perfect (κ= 0.821, 95%CI=0.729~0.913, p<0.001). 53 of 153 segments (34.64%) were considered as infarction on S-CCTA, compared with 64 segments (41.83 %) that were confirmed as infarcted on TTC stain (Table 2). ROC curve showed high diagnostic accuracy of S-CCTA to differentiate myocardial infarct segments (sensitivity, 0.813; specificity, 0.989; positive predictive value, 0.981; negative predictive value, 0.880 and accuracy, 0.901, p<0.001) (Figure 5).
Correlation Between IC and Apoptosis
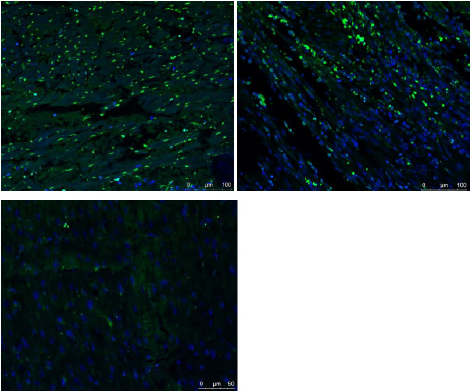
The ICs of no-reflow region, infarction and remote myocardium were (1043±282) ug/cm3, (1867±344) ug/cm3, and (3507±331) ug/cm3 respectively. There were significant differences among them (p<0.001). The mean number of apoptosis cells in no-reflow region, infarction and remote myocardium were (2661±231)/mm2, (2270±241)/mm2 and (74±41) /mm2 respectively (Figure 6). There was significant difference among them (p<0.001). A significant inverse correlation was found between IC and cardiomyocyte apoptosis (r2=0.879, p<0.001).
Figure 6: Fused images of TUNEL stain and DAPI stain.
A. There were few normal cells (blue cell: indicated cells with normal double-stranded DNA) but a lot of cardiomyocyte apoptosis in the no-reflow region
B. There were abundant of apoptosis cells and normal cells in the infarction area.
C. A large number of normal cells but few apoptosis cells were detected in the remote myocardium.
Discussion
S-CCTA for Myocardial Infarction Assessment
The spectral CT may improve its ability to differentiate myocardial infarction from remote myocardium. This may be due to three following factors: its high CNR of higher photon energy (70keV) images, its higher photon energy (140keV) images and its ability to alleviate of beam hardening artifacts [8,11]. Previous studies have similar results with our study no matter for the myocardial perfusion or delayed enhancement [18,19] The 70keV images was selected as optimal monochromatic image to evaluate acute myocardial infarction due to with high CNR, SNR and low noise. And previous study also confirmed that The CT value of 70keV monochromatic image was similar to those of 120kVp CT images with lower noise [12,20].
IC and Cardiomyocyte Apoptosis
TUNEL stain aims to detect apoptotic cell and necrotic cell [21,22]. Apoptosis, necrosis and, possibly, autophagy determined the ultimate number of viable cardiomyocytes following MI [23,24]. Persistent ischemia without reperfusion eventually causes cardiomyocytes to die by a necrotic pathway. While, following myocardial ischemia/reperfusion, apoptosis is one of the major pathways that lead to the process of cell death [25]. In the current study, we correlated the IC of myocardium with TUNEL stain to investigate the capability of spectral CT to assess MI. The results showed that both the IC calculated on S-CCTA and cardiomyocyte apoptosis measured by TUNEL stain could differentiate no-reflow region from infarction or remote myocardium. Furthermore, the myocardial IC on S-CCTA correlated with the TUNEL stain of apoptosis cell in acute MI mini-pig models. Cardiomyocyte is permanent cell, no cardiomyocyte apoptosis detected in the normal heart. Previous study confirmed this point [26]. However, few apoptotic cells were found in the remote myocardium in our study which is probably caused by the overall ischemia situation. Significant difference of the number of cardiomyocyte apoptosis in no-reflow region and infarction area was detected.
No-reflow phenomenon reflects severe reperfusion injury. Ischemia/reperfusion injury (no-reflow phenomenon) initiates a wide and complex array of inflammatory responses that aggravate local injury [27-29]. It explains why apoptotic and necrotic cells was much more prominent in no-reflow region compared with infarction area without no-reflow phenomenon. The IC calculated on S-CCTA images reflected the myocardial perfusion and distribution of blood flow. Following ischemia/reperfusion, the higher the myocardial perfusion, the fewer the apoptotic and necrotic cells induced. This may be responsible for that the IC had a negative correlation with the TUNEL stain of apoptosis cell in acute MI. The iodine quantification on S-CCTA may add valuable information for risk stratification in the future.
Limitations
There were some limitations in the current study. First, the number of pigs enrolled was relatively small and with similar habitus, further study is necessary to determine whether our results are applicable to patients with larger and various figures. Second, this model only investigates early hypo perfused myocardial infarctions and the results cannot be extrapolated to later time points of infarct healing. Finally, for the mandatory use of prospective triggering and high heart rate of the pigs, we did not conduct the analysis including coronary artery stenosis and stress myocardial perfusion assessment.
Conclusion
S-CCTA could assess MI by CT value on 70keV images, IC and spectral curve. In addition, IC calculated on S-CCTA may indirectly reflect myocardial damage which could potentially add valuable information for risk stratification in the future.



No comments:
Post a Comment
Note: Only a member of this blog may post a comment.