Human Experience Versus Rule Decision at Krones AG
Introduction
At Krones AG, the world market leader in the beverage industry, orders with very large area requirements have to be produced. Despite very high investments in suitable halls, the available area is a major bottleneck. This is also the case for other companies. Despite the use of planners, at least 21% of orders at Krones have consistently been late in recent years. Delays result in significant penalties and undermine the goal of getting every plant up and running on time. For many orders, delays were only avoided because process accelerations were made in the mostly long production processes through measures such as overtime.
Krones now wanted to know more precisely:
- How good is the actual quality of planning?
- How good is planning that (primarily) follows due dates?
Due to the improvement of planning within the production execution, the production result are not representative of the planning quality in terms of meeting due dates. Therefore, these questions should be answered by a simulation study. This article is structured as follows. In section 2, the previous planning procedure at Krones is explained and section 3 contains the relevant literature. In section 4 the self-developed simulation tool is explained. Section 5 contains an analysis of the simulation results. Finally, in section 6, a summary is given and planned further work is described.
Production and Planning at Krones Ag
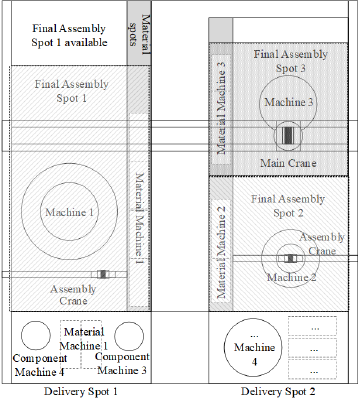
Krones AG, headquartered in Neutraubling, Germany, employs around 15,000 people worldwide. It has been producing components, lines and systems for beverages and liquid food since 1951. It is assigned to the machinery and plant engineering sector, and it is a leading manufacturer in packaging and filling technology. The company covers every step of the production process, from product and container manufacturing, through filling and packaging, to material flow and container recycling. One of the last steps is the final assembly of filling machines in plant hall 5. The following description of the assembly serves to illustrate the area requirements, which can increase and decrease over time. At the same time, it mentions technical restrictions due to which processing times are not known in advance and are constant. Only one machine at a time can enter or leave the plant hall through the plant gates. Before starting the final assembly of a machine, a final assembly station with sufficient area is determined depending on the machine size. For example, in Figure 1, three fillers are to be assembled. Such a hall allocation is representative for the entire plant. All subassembly parts and materials of all machines are delivered to the delivery spots (i.e., “delivery spot” in) (Figure 1).
Materials from different machines and assemblies can be mixed here; indicated by “Assembly” in (Figure 1). These outdoor delivery areas are limited but can be used by any type of machine and material. The sub-assemblies and materials are divided into two groups of master material types. The first group of assemblies, due to design and/or weight, can only be lifted into the factory facility with the main crane (in (Figure 1), materials with solid border lines). Mostly these parts are main machine parts. The second group of materials can be brought to their target material location by operators (in (Figure 1) materials with dashed border lines). These are assembly parts sorted in trolleys or bins. These parts can be lifted by auxiliary cranes to their final place in the machine and are assigned to a single machine in the inside material place. These indoor material spots are physically fixed according to the final assembly station and are individual for each machine with materials. Final assembly stations are physically fixed and are individual for each machine with materials. After completion of the final assembly process, the finished machine can only be transported out of the hall by the main crane. The main crane and the outrigger cranes operate at different levels so that blocking is not possible.
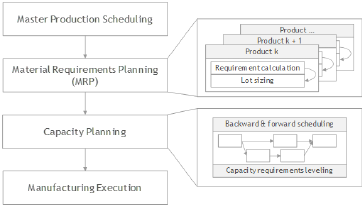
Support cranes are divided between the right and left sides of the plant and cannot pass each other on either side. Due to this area demand and the large dimensions of the assembled machines with diameters from 1.0 m to 7.2 m, plant hall 5 has an overall length of 105 m and a width of 30 m and the area usable for assembly consists of 2208 m². In 2020, 145 machines were assembled and a higher number is expected in the next few years. The processing time of the assembly orders varies between 6 weeks and 19 weeks with a mean value of 10.24 weeks and a deviation of 2.5 weeks. At the end of a week, the plants leave the hall. Planning is done, as is standard for companies, by configuring the SAP system specifically for Krones AG. Its main components are listed in (Figure 2). Its main service is ensuring the availability of materials. As analysed in the literature, e.g., [1], this planning provides insufficient results when taking into account the limited capacity. Just very simple procedures are used; which are listed in (Figure 2). As discussed in the literature, e.g., [1-5] scheduling is needed as an additional planning procedure between capacity planning and manufacturing execution.
In Principle, Scheduling of the Assembly Orders of the Hall at Krones is Currently Carried Out by Means of the Following Procedure
Planning is performed always at the beginning of a week. The worklist covers 12 weeks. This worklist is the result of the capacity planning by the SAP system, which is executed every day. At the beginning of each week, a machine can be allocated into the hall, provided that the necessary area is available, without having to reposition the machines already in the hall. A planner uses a printed layout of the plant hall in which the previously scheduled lines are drawn. The plant data, such as length, width, (customer) due date, are located in Krones’ SAP system. Due to planning by the SAP system, the worklist is already ordered. A planner schedules the machines into the hall according to this list, provided availability is assured. The SAP system provides an order list (or machine list) for each day. The SAP system does not determine a sequence between the orders of a single day. A planner orders the machines of such a day. For this, she/he prefers larger required area or processing time over smaller ones. This follows the assumption that smaller machines, in terms of space requirements and/or processing times, can be more easily planned into a partially occupied hall than larger ones.
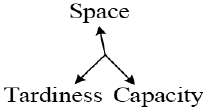
According to the literature and the experience of planner in companies, there is a conflict of objectives between minimizing the unused area, minimizing the number of workers, and minimizing the tardiness; as seen in the scheduling trilemma; see also [4]. In the literature there are numerous works on scheduling as in [4] or [5] and on layout planning as in [6] or [7]. In combinations of both problems, either scheduling or layout planning dominates. An example is project planning for ships in [8,9] where well-used spatial layout is most important. The class of problem considered here consists not of projects, but of independent individual assembly orders. The proceedings of the annual winter simulation conferences contain many articles on simulation that are relevant to this work. Particularly relevant for this research work were [10] and the description of a process simulation as part of modelling in [11]. The real application operates in dynamic environments where real time events like station failure, tool breakage, arrival of new orders with high priority, changes of due dates etc., may turn a feasible schedule into an infeasible one; examples can be found in [4,5]. A feasible schedule of jobs is achieved by a priority rule like Earliest Due Date (EDD), because a priority rule orders a queue of jobs in front of a station quasi immediately; for its description and the one of other widely used priority rules see [3]. Thus, priority rules are still analysed in many studies on scheduling; one example of a recent one is [12,2].
In addition to this facts, priority rules are also a first choice in the case of complex scheduling problems; especially in industrial practice. Thus, in [13] for a complex scheduling problem the performance of priority rules is analysed. Another example is the application of priority rules for the dispatching of AGVs in flexible job shops in [14]. It might be that in the near future several such problems will be solved by more sophisticated heuristics as genetic algorithms for example.
Simulation Tool
For the simulation study, common commercially available simulation tools such as Plant Simulation from Siemens were first evaluated against a proprietary development. The tools allow extensive visualisations of the processes. However, they cannot significantly reduce the development effort required to control the scheduling of randomly arriving customer orders in the factory hall compared to an in-house development. A tool is developed to simulate and analyse various sequences of assembling filling machines in plant hall 5. It is implemented in Excel (in VBA) and one Excel sheet represents an allocation of plant hall 5. The hall is represented in Excel by a rectangle of cells, where each cell represents an area over 1m² in the plant hall. An assignment of 0 means an unused area (over 1m²) and a 1 means an allocation by a machine; other areas, such as those of passageways, office area, etc., are coded in Excel by 80. The total area required by a filling machine is then a rectangle of 1-s in an Excel sheet. A sequence simulation creates such a sheet for each week (period) of the simulation horizon. It ends if the last machine of a set of orders, called workload, which is known at the beginning of the simulation run, has been assembled.
For a sequence of orders elaborated by a planner or by the slack rule, the machines (orders) are iteratively assigned to plant hall 5 as follows.
For an order (i.e., machine), the production area is searched from left to right and then from top to bottom until a sufficiently large free area is found. This area must also be free in the coming periods, as scheduling sequences are usually not sorted by release date. In the positive case, the allocation takes place, as far left-up as possible. In the negative case, this allocation attempt is repeated as soon as a machine is assembled and has left the hall; this could just happen at the of a week (period). After a successful simulation run, for each order its tardiness (actual completion date minus due date) and for each period the occupied area (or free area) are calculated.
Results
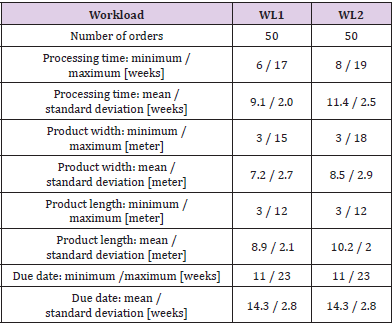
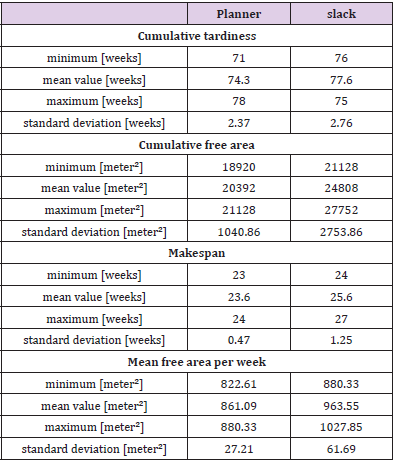
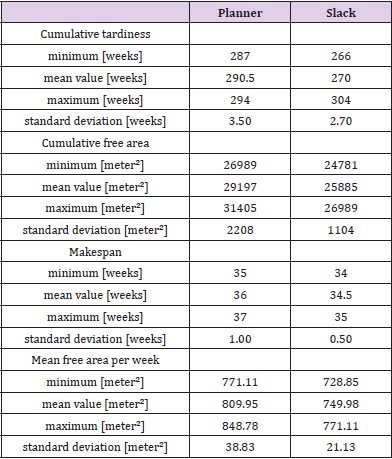
The basis for the simulation experiments is the order data in 2020. The direct use of these data resulted in a very high standard deviation of mean tardiness and other key figures named below and used in the analysis. As a result, it was not possible to identify statistically significant results. In order to obtain meaningful results, the sequence of incoming orders over all weeks was examined more closely. It shows that there are periods in which the due dates can easily be met because the time available for processing (i.e., due date minus release date) is high compared to the net processing time. In contrast, in other periods this ratio (quotient) of available time and net processing time is closer to one or even less than one (and thus critical); note: in the first case this quotient is significantly higher than 1. On the basis of this analysis, two classes of workloads were created. Each consists of a high number of sets of orders. Each of them is planned by a planner and by the slack rule. The key figures shown in (Table 1) are calculated for all sets of orders. Both workloads have the same key figures for the due dates. Therefore, higher processing times for workload 2 result in a more critical due date situation. The results achieved by the planners and the slack rule result in the key figures given in (Table 2).
As said earlier, a planner prefers larger required area or processing time over smaller ones. Meeting due dates is thus only implicitly relevant in the best case. A detailed analysis of the individual plans shows: Responsible for the differences is that a planner prefers area requirements over tardiness avoidance (Table 3). This is more likely to be the case with sets of orders causing high time pressure. Conversely, there are situations in which the planner achieves better results because she/he achieves faster processing of orders through better utilisation of plant hall 5. Note: the figures for the mean free area are based on makespan (Figure 3).
Conclusion
Scheduling in the literature mainly considers a bottleneck, such as the limited capacity of the machines. Requirements for the use of limited area for the assembly of machines is dealt with in other publications. Responsible for this are different approaches to these two problem classes. For the final assembly at Krones AG, both planning problems have to be considered simultaneously. Two experienced planners are used for this purpose. A simulation tool was developed to analyse the possibilities for improvements. The simulation experiments so far show that planners often find a good balance between using the limited area and avoiding tardiness. In situations with high time pressure, a preference for meeting due dates will already provide better results through the slack rule. The two planners are therefore encouraged to consider an allocation decision through slack. The two planners are therefore encouraged to consider an allocation decision through slack. The results so far show a significant difference in the use of free areas. Therefore, combinations of priority rules to meet due dates with rules to avoid unused areas are to be designed and simulatively investigated.
For more Articles on: https://biomedres01.blogspot.com/

No comments:
Post a Comment
Note: Only a member of this blog may post a comment.