Evaluation of Cell Lysis Due to Ice Crystals in Cell Freezing
Introduction
Cell freezing is widely used in regenerative medicine and cryosurgery, and it is important to prevent cell damage during cell freezing. Studies have indicated that in addition to osmotic stress, cell damage at low cooling rates is due to cell compression caused by the development of ice crystals that form outside the cells [2- 6]. Cells appear to be compressed in the narrow spaces between the many needle-shaped ice crystals that develop [7,8]. Therefore, the damage mechanism is thought to be the mechanical stress of compressive deformation causing cells to break down, leading to lysis. This compression can be modeled as the compression of two parallel plates on a single cell. Takamatsu, et al. [1,9] performed compression experiments by placing a cell between two parallel plates and investigated the relationship between the reduction rate of the gap between the plates and the cell viability. There have been extensive studies for deriving the mechanical properties of cells from their responses when subjected to mechanical stress [10-14]. The measurement of the mechanical properties of cells allows the mechanical modeling of the deformation of the cell membrane and cytoskeleton, and the relationships between the changes in mechanical properties and the lesion state of the cell can be investigated. In experiments where cells were compressed by parallel plates, the relationship between the force and displacement or between the stress and strain has been determined using microcantilevers [15-18].
In the present study, the compressive deformation of cells was analyzed using a method wherein microcapsules were compressively deformed by parallel plates [19]. The target cells were human prostatic adenocarcinoma cells, which had previously been subjected to plate compression experiments and their viability was measured [1]. We performed calculations corresponding to this experiment to determine the cell strain, the tension generated in the membrane, and the pressure difference between the inside and outside of the cell for the compressive force. When cells are compressed, the membrane undergoes expansion strain and shear strain, but it is shown that the expansion tension is related to cell lysis, and a relationship between the maximum value of the expansion tension and the cell viability is determined. During cell freezing, the osmotic pressure of the surrounding solution changes, along with the cell size. The surface area increases when the cells are compressed, and the relationship between the rate of increase of the surface area and the cell lysis is investigated. We show that the evaluation indices for the cell viability that are independent of the cell size are the rate of increase of the surface area and the deformation shape of the cell.
Analysis
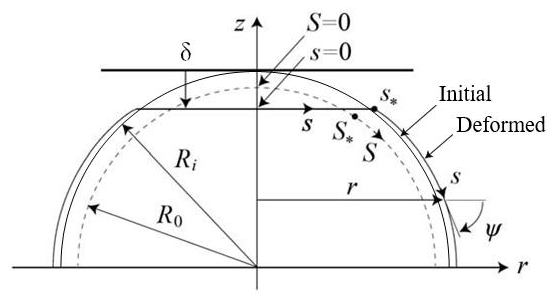
A computational model of a spherical cell compressed by two parallel plates is shown in Figure 1. The deformation is assumed to be axisymmetric, and only the upper half is treated assuming the vertical symmetry of the shape. The initial radius of the cell is denoted as Ri, and the displacement of the upper half when it is compressed by the plate is denoted as δ. The cytoskeleton consists of actin filaments, microtubules, and intermediate filaments. The actin filaments, which exist along the inner side of the cell membrane, mainly support the mechanical structure of the surface [20]. Therefore, we modeled the cell surface as an elastic membrane. In addition, the actin filaments, microtubules, and intermediate filaments inside the cell support the structure of the whole cell [17]. Therefore, we represent the actions of these components as the maintenance of the original volume of the whole cell. Cells adhere to the plates during plate compression, and in general, membrane tension is generated when cells adhere to a plate [21,22]. This tension is treated as the initial tension and modeled as follows. When there is no tension in the cell membrane, the cell is a sphere of radius R0, and the initial tension Ti is generated when the sphere expands to radius Ri. At this time, the initial stretch of the membrane is λi = Ri / R0 . The axis along the meridian of the sphere of radius R0 is denoted as S, and that along the meridian of the shape after deformation due to plate compression is denoted as s. The angle between axis s and axis r is denoted as ψ . For an axisymmetric elastic membrane, the equations of the static force balance in the tangential and normal directions in the meridian plane are given as follows [10], in which the bending stiffness of the membrane is ignored.

Here, Ts and Tφ represent the principal tensions in the meridian plane and the principal tension in the circumferential direction, respectively. κ s and κϕ represent the principal curvature in the meridian plane and the principal curvature in the orthogonal plane, respectively. ptr represents the transmural pressure, i.e., the pressure difference between the inside and outside (internal pressure – external pressure). The principal stretch in the meridian plane λs and the circumferential principal stretch λφ are given by  , where R represents the r coordinate in the initial state of the material point after deformation. The tensions Ts and Tφ are calculated using Evans and Skalak’s model [10] for biological membranes;
 , and Tφ is obtained by interchanging λs and λφ in Ts.
K(= Eh / 2(1− v)) represents the area-expansion modulus, and μ (= Eh / 2(1+ v)) represents the shear modulus. Here, E represents the Young’s modulus, h the membrane thickness, and ν the Poisson’s ratio. The isotropic tensions, i.e., the expansion tension Te, the shear tension Tsh, and the Mises tension TM, which is used to predict material failure according to the yield condition of the material, are determined using the following equations.

The Young’s modulus E and Poisson’s ratio ν are for membranes, but when determining the elastic modulus of a cell using atomic force microscopy, the Young’s modulus E’ of the entire cell is often determined using the relationship between the force and displacement for the entire cell. Therefore, the approximate relationship ' i Eh = E R for ν = 0.5 was used to obtain the Eh from E’ and Ri. The above equations were solved under the condition that the volume inside the cell does not change and the symmetry conditions of the shape at z = 0 (i.e.ψ = π /2) to determine the strain of the cell, deformation shape, tension distribution, and pressure difference for the compressive force. The calculation method was described in detail in [19].
Results and Discussion
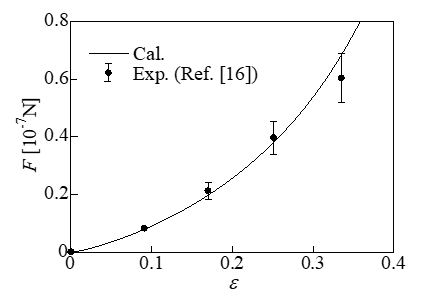
To validate the computational model, a comparison with experimental results (16) was performed. In this experiment, a single endothelial cell was subjected to a compression test using parallel plates, and the relationship between the force F and the compressive strain ε (= δ / Ri) was determined, as shown in Figure 2. In the calculation, the cell diameter was assumed to be 17.4μm, according to the experimental images. The Young’s modulus E’ of the whole cell was set as 1220Pa according to the Young’s modulus of the cytoplasm (1000Pa), the Young’s modulus of the nucleus (2500Pa), and the estimated volume ratio of the nucleus to the cytoplasm (0.17). Fitting to the experimental results was performed with the initial stretch set as λi = 1.12. The calculation results are indicated by the solid line in Figure 2. They agreed well with the experimental results with reasonable errors. According to the calculation, the initial tension determined from the initial stretch of the membrane was 2.7mN/m. According to measurements of HeLa cells (15-25μm in diameter) attached to a substrate, the membrane tension ranged from 2.73 to 3.62mN/m [22]. The results of the present calculations are close to these values.
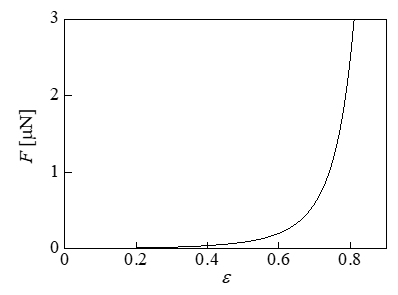
When cells are frozen at a low temperature drop rate, ice crystals develop in a needle-like shape on the outside of the cells over time, and the cells appear to be compressed in the narrow spaces between the crystals [7,8]. Therefore, Takamatsu, et al. [1] hypothesized that the mechanical stress of compression is a major cause of cell damage during cell freezing, and as a model experiment, they performed compression tests on cells using parallel plates and investigated the relationship between the compression rate and the cell viability. The target cells were human prostatic adenocarcinoma cells. In the experiment, the change in the cell size caused by the change in the external osmotic pressure generated during cell freezing was considered; i.e., compression testing was performed on these cells by changing the concentration of an extracellular NaCl aqueous solution, which changed the cell diameter to 15.4, 17.8, and 20.5μm. Table 1 presents the relationship between the compressive strain ε and the cell viability, which were averaged for the three kind of cells. The data were taken from Figure 6 in Ref. [1]. For the cell with diameter d (= 2Ri) = 17.8μm, calculations were performed for compression due to parallel plates. The Young’s modulus of the membrane E of prostate cancer was calculated using the measured Young’s modulus of a whole cell, i.e., E’ = 452Pa [23]. The initial stretch was set as λi = 1.12, which was used in the calculation shown in Figure 2. The calculation results for the relationship between the compressive force F and the strain ε are presented in Figure 3. When the strain was larger than ε = 0.7, the force F increased rapidly; thus, the viability decreased significantly, as shown in Table 1.
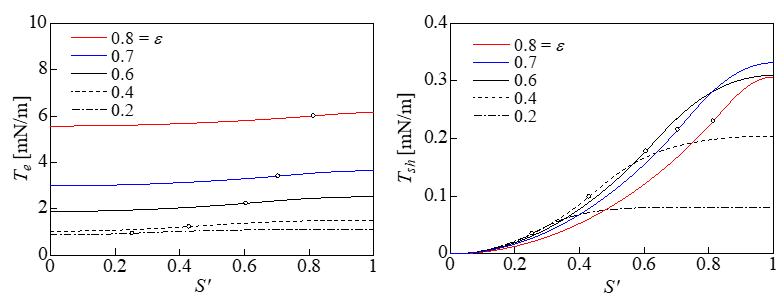
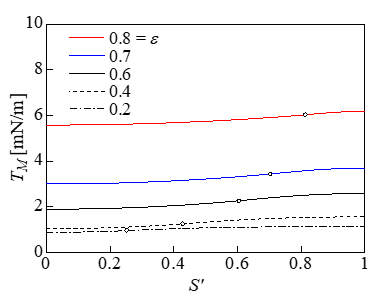
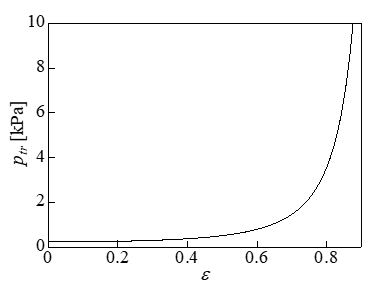
Figure 4 shows the variations in the expansion tension Te and shear tension Tsh with respect to the dimensionless S ' (= 2S /π R0 ) when the strain ε was varied. The white circles in the figure indicate the points corresponding to S*. The contact area with the plate is shown on the left of the white circles, and the non-contact area with the plate is shown on the right. Te was approximately uniform on the membrane and was maximized at S’ = 1 ; i.e., at z = 0. In addition, Te increased with the strain ε. The shear tension Tsh increased with S’ and was maximized at z = 0. However, Tsh was approximately one order of magnitude lower than Te. Figure 5 shows that the distribution of the Mises tension TM was almost identical to Te in Figure 4, indicating that the expansion tension caused cell lysis. Figure 6 shows the relationship between the strain and the pressure difference. When a cell lyses, the pressure difference is thought to decrease to zero from the pressure difference immediately before the lysis. The volume loss during compression is derived from dV = ALp ptrdt , where Lp is the water permeability of the cell membrane. The value for the erythrocyte membrane Lp = 0.92 × 10- 12m/sPa [24] was used as Lp, the surface area of a spherical cell of diameter 17.8μm was used as the surface area A, and dt represents the time (10min) that the cell was under compression [1]. The rates of volume loss were 19% and 37% at ptr = 1 and 2 kPa, respectively. In this cell model, the cytoskeleton inside the cell works to keep the volume of the whole cell constant, and the water permeability of the membrane is ignored.
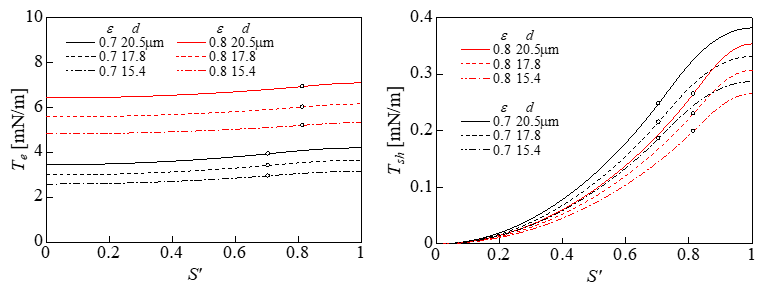
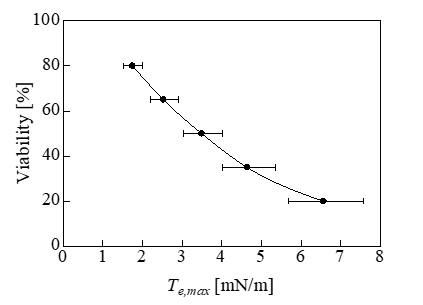
To investigate the effect of the change in the cell diameter on the tension, we performed calculations for cells with diameters of 15.4, 17.8, and 20.5μm with ε = 0.7 and 0.8. The calculation results for Te and Tsh are shown in Figure 7. Te and Tsh both increased with the diameter. Therefore, it was expected that a larger diameter would correspond to lower cell viability, similar to the results of a previous experiment [1]. Figure 8 shows the relationship between the maximum value of Te, i.e., Te,max, and the viability of cells with a diameter of 17.8μm. The error bars in Figure 8 indicate the changes in Te,max when the diameter changed from 15.4 to 20.5μm. The causal factor triggering the cell lysis was thought to be the Te,max in Figure 8. The positions of Te,max are indicated by the black dots in Figure 11. The cytoskeletal structure of erythrocytes is mainly composed of spectrin on the inner side of the cell membrane, which differs from the cytoskeletal structure of prostatic adenocarcinoma cells. The expansion tension at which erythrocytes undergo hemolysis is Th = 15mN/m [25], which exceeds the maximum value (Te,max) in Figure 8. The radius of the erythrocyte when it was expanded to a sphere without changing the surface area from its initial value of 138μm2 [26] was assumed to be rh. The pressure difference ptr at this time was ptr = 9.1 kPa calculated by the Laplace equation ptr = 2Th / rh . This was the pressure difference that causes hemolysis of erythrocytes. By comparing this value with the results shown in Figure 6, the compressive strain was determined to be 0. 87.
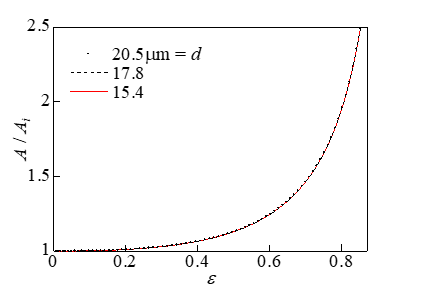
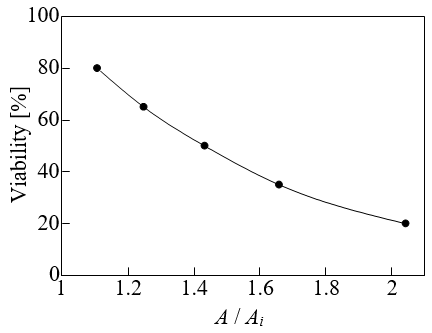
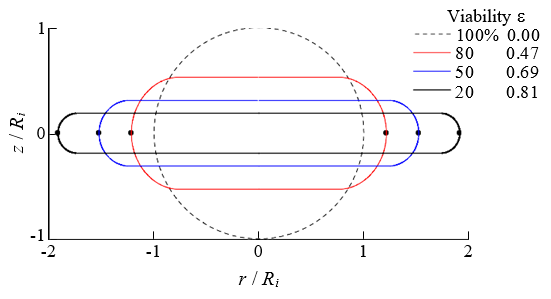
The surface area increases when cells are compressed. The results of the effect of the change in the cell diameter on the rate of increase of the surface area A/Ai during compression are presented in Figure 9. Here, Ai (=π d 2 / 2) represents the surface area in the initial state. As shown in Figure 9, the effect of the change in the cell diameter on A/Ai was negligible. Therefore, the rate of increase of the surface area was independent of the cell size and was used as an evaluation index for the cell viability. Figure 10 shows the relationship between A/Ai and the viability. The results shown in Figures 9 & 10 are almost the same as those in Ref. [1]. Figure 11 shows the deformed shape of the cell resulting from compression. Here, ε = 0, 0.47, 0.69 and 0.81 correspond to the initial state and the compression states at 80%, 50%, and 20% viability, respectively. Because the deformation shape was independent of the cell diameter, a dimensionless representation with the initial radius Ri as the representative length is presented in Figure 11. Thus, the deformation shape was independent of the cell size and was used as an evaluation index for the cell viability. The black circle indicates the position where the expansion tension reached its maximum value Te,max.
Figure 11: Relationship between the dimensionless deformation shape resulting from compression and the cell viability.
Conclusion
We performed calculations to model the process of cells being compressed by the development of external ice crystals in cell freezing under a slow temperature drop and obtained the following results.
1) The cause of cell lysis was expansion tension in the membrane of cortical actin filaments, and the effect of shear tension was negligible.
2) When the cell size increased owing to external osmotic pressure, the expansion tension due to the compression increased. Therefore, larger cells had lower viability under compression.
3) For prostatic adenocarcinoma cells with a diameter of 17.8μm, the expansion tensions that resulted in 50% and 20% viability were 3.5 and 6.6mN/m, respectively, and the rates of increase in the surface area were 1.4 and 2.0, respectively. 4) The rate of increase of the surface area under compression and the deformation shape are indices of the cell viability, because they are independent of the cell size in the range from d =15.4 to 20.5μm.
For more Articles on: https://biomedres01.blogspot.com/


No comments:
Post a Comment
Note: Only a member of this blog may post a comment.