Effect of Monosodium Glutamate Substitutes on Physiochemical, Microbiological and Sensory Properties of Fried Chicken Breast Strips
Introduction
Several major manufacturers have announced to move away from using artificial ingredients and flavors in their products. Monosodium glutamate (MSG) is one such ingredient that has been controversial for decades. It is one of the ingredients that some companies have committed to remove from products (Nguyen Thuy, et al. [1]) MSG is a flavor enhancer commonly added to processed food products like chicken to boost the palatability. Its remarkable effects on the sensory appeal have been proven in various studies (Baryłko Pikielna, et al. [2,3]) Removal of this ingredient is very likely to cause reduced consumer acceptability. Using MSG substitute is a promising approach to compensate for the sensory satisfaction loss caused by MSG elimination. The flavor enhancement effect of MSG is mainly from glutamate which contributes to umami or savory taste sensation. Besides glutamate, there are several other umami eliciting components such as aspartate and 5’-ribonicleotides.
Among nucleotides, inosinate (IMP) and guanylate (GMP) significantly contribute to flavor and taste enhancement (Wang et al. [4]) Theoretically, substances that are naturally rich in umami components have the potential to replace MSG in food products. Consumers preferred natural extracts such as yeast extract, mushroom extract, and tomato extract as MSG substitute in chicken products (Adhikari, et al. [5]). Sugars may also contribute to umami taste characters in the form of glutamate glycoconjugates (Hui, et al. [6]) Furthermore, salts of potassium are also responsible to enhance umami taste strength. However, during boiling process, significant levels of potassium leach out from potatoes (Bethke, et al. [7,8]). Sodium chloride is an important ingredient added to most of foods which contributes to flavor enhancement and food preservation (Chun, et al. [9]). MSG is a flavor enhancer that is found in some processed foods and Chinese cuisine. To avoid this sodium product there are some potential substitutes can be used as substitutes for MSG. Use 1:1 ratio mixture of sugar and salt as a substitute ingredient to your recipe instead of MSG.
This is safer to use, especially if you have children at home. MSG is a food additive used as a flavor enhancer The advantage of MSG goes to those who easily lose their appetite. This is a very common ingredient in fast foods and food seasonings. MSG is actually harmless but too much consumption would cause headaches and this is not good for people who have vertigo (a sensation of spinning) (Maluly, et al. [10]) Currently, there is limited research comparing the enhancement effects of MSG with these natural extracts in food products. Given the capability of salty taste enhancement, MSG substitute may also be able to increase the sensory appeal of meat products with reduced salt content. Previous study indicated that used of yeast extract successfully enhanced the taste of fermented sausage (Campagnol, et al. [11]) Ground mushroom has also been reported to improve the flavor of taco blend (Myrdal Miller, et al. [12]). To replace MSG, it is necessary to conduct more research to compare the performance between MSG and its alternatives in salt-reduced food matrix. The aim of the current study was to investigated the effect of replacement MSG with 1:1 ratio mixture of sugar and salt on physiochemical, microbiological and sensory properties deep fat fried chicken breast strips during frozen storage (-18°C).
Materials and Methods
Materials
Fresh boneless skinless chicken breast strips 74.33% moisture 20.72% protein, 2.26% fat, 1.18% carbohydrate, 1.18 Ash and pH 5.09, were obtained after 8 h of slaughtering from Cairo Poultry Processing Company, Sharkia, Egypt. The samples were transferred under cooling conditions to Food Technology Department Laboratory (Zagazig University, Egypt) and saved in freezer at -18°C for 3 months until processing.
Methods
Preparation of Chicken Breast Strips: After preparation of chicken breast strips as described (Tables 1 & 2), samples divided into two groups: control group containing MSG (C) and the other containing MSG substitution (T).
Table 1: Marinade formula of chicken breast strips.
Note: *Monosodium glutamate substitution (T): mixtures consist of table salt and sugar by ratio of 1:1.
Spices (onion powder 9gm., garlic powder 9gm., Celery powder 2.25gm., Ginger powder 2.7 gm.
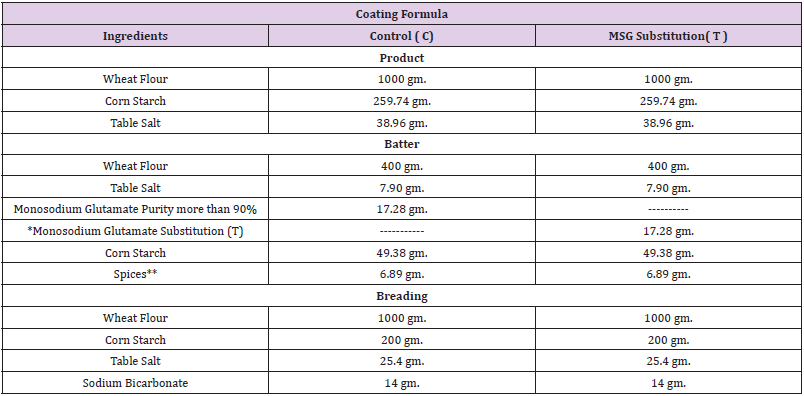
Table 2: Coating formula of chicken breast strips.
Note: *Monosodium glutamate substitution (S) mixture consist of table salt and table sugar by ratio of 1:1 .
** Batter spices consist of (garlic powder 2.46 gm., Ginger powder 1.97 gm. And Black pepper powder 2.46 gm.
Preparation of Marinade Solution: The amount of water below5 °C was placed in a bag of high density polyethylene, after that the amount of food grade sodium tripolyphosphate (STPP) was dissolved in it, followed by dissolving the table salt and MSG in the case of control or MSG substitution (a mixture of table salt and table sugar in a ratio of 1: 1) in the case of treatment and then add spices, antioxidant, and stirring to homogenize the marinade solution. The amount of raw chicken fillet strips was added to previous brine after thawing it for 24 h in the refrigerator and reaching a temperature of 1- 4 °C. Finally the bags were closed and flipped for five minutes and placed in the refrigerator on a temperature of 1 – 4 °C. After 24 h, the bags were opened and the chicken breast strips were removed from the soaking solution and put on a stainless steel net for 5 min to drain excess brine solution, then the increase in the weight of the chicken breast strips acquired from the marinade solution was calculated according to the following formula (Smith, et al. [13]).

Deep Frying of Marinade Chicken Breast Strips: 1.5 liters of a mixture of sunflower and soybean oil 1: 1 were placed in an electric fryer and the oil temperature was raised to 186: 188 °C, then the marinated and covered chicken breast slices were placed in the oil at a rate of 4 pieces each time and the weight of the piece was approximately 40 g .When the temperature of the chicken breasts reached 74 - 76 °C, they were removed from the oil and placed on a stainless steel mesh to get rid of the excess oil from the throwing process in the control sample. In the treatment sample (without MSG), the same previous steps were repeated after getting rid of the frying oil used in the control sample and replacing it with a new oil of the same type of oil. Samples were preserved by freezing at -18 °C until the completion of the tests (Park, et al. [14]).
Chemical Analysis
Moisture, ash, crude protein, and crude lipids (%) were determined according to the methods recommended by (AOAC [15]) while total carbohydrate content was measured by difference.
Microbiological Examination
Preparation of Samples for Microbiological Examination
Ten g of each sample were homogenized with 90 mL of sterile saline solution (9 g NaCl/ L distilled water). The suspension was shocked by shaker for 5 min to give 0.1 dilutions. Then different dilutions (1: 10-1 to 1: 10-6) were prepared to be used for microbiological examination.
Aerobic Plate Count (APC)
The aerobic plate count (APC) was performed as described in (APHA [16]).
Molds and Yeasts
Potato dextrose agar was used for yeast and mold enumeration. Plates were incubated at 25°C for 5 days, according to (APHA [16]).
Total Coliform Bacteria Count
Violet red bile agar was used for the enumeration of coliforms. Plates were incubated at 37°C for 24 h, according to (APHA [16]).
Staphylococcus Aureus
Staphylococcus aureus test was performed as described in ISO, (ISO [17]).
Salmonella SPP
Salmonella SPP test was performed as described in ISO, (ISO [18]).
Freshness Tests
PH Value ( EOS [19])
In astomacher, approximately 10 g of the examined sample were homogenized with 25 mL of neutral distilled water, and left to stand for 10 min at room temperature with continuous shaking and filtered. The pH was determined by using electrical pH meter (ACTWA-AD1200-1034678) calibration of pH meter by using two buffer solutions of exactly known pH (alkaline pH 7.01, acidic pH 4.01). Therefore, pH electrode was washed with neutralized water and then introduced into the homogenate.
Determination of Total Volatile Basic Nitrogen (TVB/ N)”mg” % ( EOS [20])
Ten g of sample were minced in a stomacher for 1-2 min until homogenization. Then in a distillation flask add 2 g of magnesium oxide and 300 mL distilled water to the minced sample. Make distillation and receive 100 mL distillate within 30 min in a beaker contain 25 mL of 2% boric acid. Then titrate against H2SO4 0.1M until faint pink color.
Where R is the volume of H2SO4 exhausted in titration.
Determination of Thiobarbituric Acid (TBA)”mg/Kg” ( EOS [21])
TBA number is expressed as milligrams of malondialdehyde equivalents per kilogram of sample. Ten g of sample were blended with 48 mLof distilled water, to which 2 mL of 4% of ammonium chloride (to bring’s the pH to 1.5) were added in astomacher for 2 min and left at room temperature for 10 min. The mixture was quantitatively transferred into Kjeldahl flasks by washing with additional 50 mL distilled water, followed by an anti-foaming preparation and few glass beads. The Kjeldahl distillation apparatus were assembled and the flask was heated to 50°C. 50 mL distillate was collected in 10 min from the time of boiling commences. The distillate was mixed, and then 5mL was pipette into a glassstoppard tube. 5mL of TBA reagent (0.2883g/100mL of 90% glacial acetic acid) were added. The tube was stoppered, shacked and immersed in boiling water bath for 35 min. A blank was similarly prepared using 5mL distilled water with 5ml TBA reagent and treated like the sample. After heating, the tube was cooled under tape water for 10 min. A portion was transferred to a curette and the optical density (D) of the sample was read against the blank by means of spectrophotometer (Perkin Elmer, 2380, USA) at a wave length of 538nm.
TBA value (mg malondialdehyde / kg of sample) = D×7.8
D: the read of sample against blank.
Physical Tests
Water Holding Capacity (WHC) and Plasticity
Water holding capacity (WHC) and plasticity were measured according to the method described by (Soloviev [22]). A weight of 0.3 g of ground meat was placed under ash less filter paper (Whatman, No. 41) between tow glass plates (20x20 cm) and pressed for 10 min., using 1 Kg weight. Two zones were measured using the planimeter, the water holding capacity was calculating by subtracting, the area of the internal zone from that of the outer zone. The internal zone represented the plasticity. Results were presented in cm2 per 0.3 g of raw sample.
Cooking Loss
Samples weighing 25-30 g (W1) were packed in plastic tubes. The tubes were then heated at 95°C, until the internal temperature of the samples reaches 75°C. The temperature was checked using thermocouples inserted in the center of the sample. The samples were considered cooked when the internal temperature reached 75°C after cooking, the meat was weighed again (W2) to determine the loss in weight during cooking as described by (Mamaghani [23]).
Sensory Evaluation
Ten experienced panelists made a sensory evaluation of full fried chicken strips.For the following attributes, each panelist was invited to give a numerical value from 0 to 10. Scores extended from 1 to 10 which illustrate dislike extremely to the like extremely. The sensory characteristics assessed were texture, color, odor and crispness (Ramadan, et al. [24]).
Statistical Analysis
All data of the present study were subjected to analyses of variance (AVOVA) using software (SAS institute [25]) Differences between means were collected by the least significant differences (LSD) at p< 0.05.All measurements were carried out in triplicate.
Results and Discussion
Physicochemical and Microbiological Properties of Raw Chicken Breast Strips
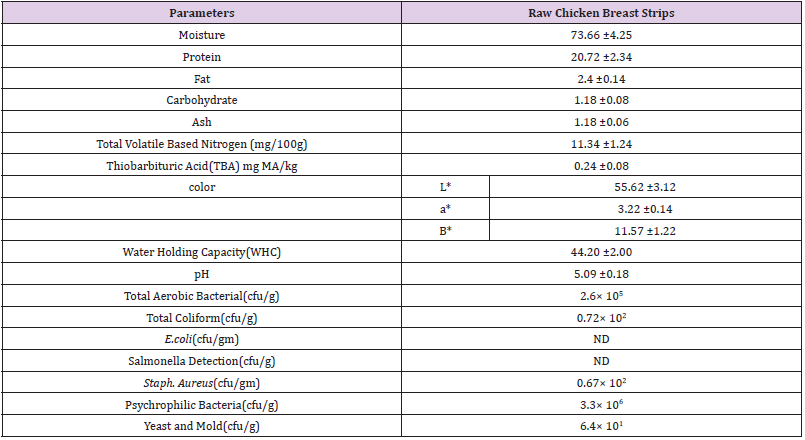
The chemical composition of raw chicken breast strips is presented in (Table 3) .Moisture, protein, fat, carbohydrate and ash contents of raw chicken breast strips were (73.66, 20.72, 2.4, 1.18 and 1.18 g/100g respectively. These results are in agreement with the data obtained by (Petracci, et al. [26]) who found that moisture, protein, fat and ash contents of raw chicken breast meat were 75.10, 22.90, 0. 78, and 1.30 g/100g respectively. Total volatile based nitrogen (TVBV) (mg/100g) and thiobarbituric acid milligrams of malonaldehyde (TBA) mg / kg of raw chicken breast strips were (11.34 mg/100g and 0.24 (MA) / kg), respectively. These results are in agreement with the data obtained by (Kim, et al. [27]). Data presented in (Table 3) showed that the color values (L*, a*, and b*) of raw chicken strips were 55.6, 3.2 and11.5 respectively. Whilewater holding capacity (WHC) and pH values of raw chicken strips were 44.2 and 5.09 respectively. These results are in agreement with the data obtained by (Qiao, et al. [13,28]). Total aerobic bacterial, coliform, E. coli, salmonella, staph. Positive coagulase psychrophilic bacteria and yeast and mold counts of raw chicken breast strips were presented in (Table 3). Total aerobic bacterial, coliform, salmonella, staph. aureus, psychrophilic bacteria and yeast and mold counts were 2.6× 10⁵, 0.72× 10² , ND, ND, 0.67× 10² , 3.3× 10⁶ and 6.4× 101 respectively. These results are in agreement with the data obtained by (Eglezo et al. [29-31]).
Chemical Composition of Deep Fat Fried Chicken Breast Strips During Frozen Storage (-18±1°c)
Chicken breast strips samples werechemically analyzed to determine the gross chemical composition and physical properties. The obtained data are shown in (Table 4). It could be noticed that moisture loss of deep fat fried chicken breast stripssignificantly decreased as a function of storage time for both samples. The control samples had statistically higher moisture contents than the treated fried samples. This could be due to water loss during frying. All coatings provided a beneficial barrier for moisture and preserved samples from moisture loss during storage. The lower water loss for the coated deep fat fried chicken breast stripsmight be due to controlling the loss of water and reducing dehydration. Similar results were observed by (Hwang, et al. [32] and Prejsnar, et al [33]). The crude protein content of deep fat fried chicken breast stripsdecreased by replacing MSG with a mixture of 1:1 sugar and salt this may be due to containing of MSG on amino acids. The crude protein content of all treatments slightly increased as storage period progresses.
Freezing storage has been shown to induce protein carboxylation, and the formation of Schiff bases in chicken meat (Utrera, et al. [34]) Freezing storage has impacts on the activities of endogenous proteolytic enzymes responsible for the degradation of meat protein as well as the relaxation of meat tissue structures (Farouk, et al. [35]) Study conducted by (Smiecinska, et al. [36]) revealed increased content of both total and soluble protein in breast meat after 6 weeks of freezing storage. Similar results were observed by (Hwang, et al. [32] and Prejsnar, et al. [33]) With regard to fat content of chicken breast strips died not affecting by replacing. Control samples had the highest fat content than treated samples. The fat content of all treatments slightly decreased as storage period progressed. This decrease of fat content may be explained by the autolysis of lipid (El-Nashi, et al. [37]). Carbohydrate and ash content were higher in sample containing sugar and salt mixture as alternative for MSG. The observed reduction in ash content was probably due to increased meat leakage during the fried process, hence the subsequent increased loss of mineral salts. (Chwastowska, et al. [38]) Also demonstrated the impact of thawing (in atmospheric air and microwave) methods on the ash content of pork meat.
Table 4: Effect of replacing monosodium glutamate with mix of sugar and salt in ratio of 1:1 on chemical composition of deep fat fried chicken breast strips during frozen storage (-18°C).
Note: Values (means ±SD) with different superscript letters are statistically significantly different (p≤ 0.05).
Physiochemical Quality of Deep Fat Fried Chicken Breast Strips During Frozen Storage (-18±1°c)
From data presented in (Table 5). It could be noticed that the pH value of deep fat fried chicken breast strips during frozen storage of both treatments increased as storage period progressed. Treatment contains mix of sugar and salt in ratio of 1:1 as MSD alternative had the higher pH values than treatment containing MSG (control sample). These results are in agreement with those obtained by (Hwang, et al. [32,33]). The slight increase in pH during storage may be due to inhibition of bacterial activity during frozen storage as (Bouacida, et al. [39]). The TVBN of both treatments increased as storage period progressed. Treatment containing mix of sugar and salt in ratio of 1:1 as MSD alternative had the lower TVBN values than treatment containing MSG (control sample) .The increasing in TVBN value due to the breakdown of nitrogenous substances by microbial activity as reported by (Prejsnar, et al. [33]). On the other hand, the TBA values of both treatments increased as storage period progressed. Treatment contains mix of sugar and salt in ratio of 1:1 as MSD alternative had the lower TBA values than treatment containing MSG control sample.
Table 5: Effect of replacing MSG with mix of sugar and salt in ratio of 1:1 on physiochemical quality of deep fat fried chicken breast strips during frozen storage (-18°C).
Note: Values (means ±SD) with different superscript letters are statistically significantly different (p≤ 0.05).
These results are in agreement with those obtained by (Hwang, et al. [32,33]) The increasing of TBA value taken place due to lipid oxidation as reported by (El Gharably, et al. [40]). However, a high degree of poly unsaturation accelerates oxidative processes leading to deterioration in meat flavor, color, texture and nutritional value (Mielnick, et al. [41]). Water holding capacity (WHC) of deep fat fried chicken breast strips during frozen storage of both treatments decreased as storage period progressed. Treatment contains mix of sugar and salt in ratio of 1:1 as MSD alternative had the higher WHC values than treatment containing MSG (control sample). These results are in agreement with those obtained by (Prejsnar, et al [33,39]) The cooking loss of deep fat fried chicken breast strips increased significantly as storage period progressed for all samples. Treatments containing MSG had the higher cooking loss percentage values than control sample. These results are in agreement with those obtained by (Aksu et al. [42-44,32,33])
Microbiological Examinations of Deep Fat Fried Chicken Breast Strips During Frozen Storage (-18°C)
The microbiology examinations of deep fat fried chicken breast strips during frozen storage (-18°C) were examined to determine some microbiological quality and shelf life validity throughout frozen storage. Microbial growth in meat and meat products can result in slime formation, structural components degradation, decrease in water holding capacity, off odors, and texture and appearance changes which reduce their quality, nutritional value and reduce the shelf life (Doulgeraki, et al [45]).
Total Bacterial Count
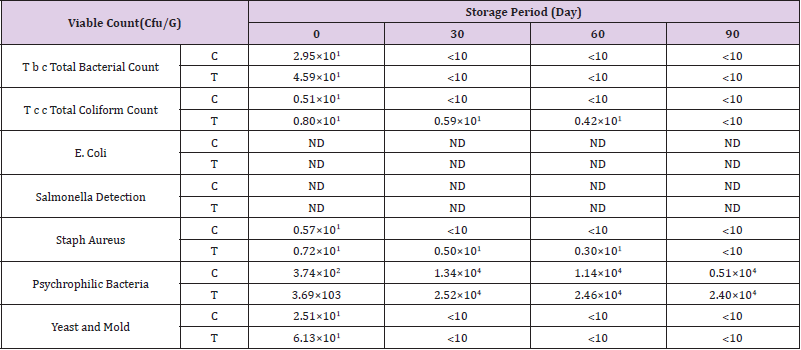
(Table 6) shows that there were significant differences in viable bacterial count between the control chicken breast strips and other chicken breast strips sample. The results indicated that total bacterial count decreased gradually throughout the storage period until the end of storage period. The obtained results also showed that control chicken breast strips had the highest counts of total bacterial count than other treatment. This might due to the antimicrobial activity of salt or sugar (Shee, et al [46]). Similar results were reported by (Aksu, et al. [42,47,32,33,39]).
Total Coliform Count
(Table 6) shows the differences in coliform counts. The results indicated that total coliform count decreased gradually throughout the storage period until the end of storage period. The obtained results also showed that control chicken breast strips had the lowest counts of total coliform count than other treatment. Similar results were reported by (Hwang, et al. [32,33,39,44]).
Table 6: Effect of replacing MSG with mix of sugar and salt in ratio of 1:1 on microbiological quality of deep fat fried chicken breast strips during frozen storage (-18°C).
E. Coli Count
The results presented in (Table 6) indicated that total E. coli count did not detect in both treatments until the end of storage period. Similar results were reported by (Hwang, et al. [32,33,39,44]).
Salmonella Count
The results presented in (Table 6) indicated that Salmonella did not detect in both treatments until the end of storage period. Similar results were reported by (Hwang, et al. [32,33,39,44]).
Staph. Aureus Count
(Table 6) shows the differences in Staph coagulase counts. The results indicated that total Staph aureus count decreased gradually throughout the storage period until the end of storage period. The obtained results also showed that control chicken breast strips had the lowest counts of total Staph coagulase count than other treatments. Similar results were reported by (Hwang, et al. [32,33,39,44]).
Psychrophilic Bacteria Count
(Table 6) shows the differences in psychrophilic bacteria counts. The results indicated that total psychrophilic bacteria count increased gradually throughout the storage period until the end of storage period. The obtained results also showed that control chicken breast strips had the lowest counts of total psychrophilic bacteria than other treatment.Similar results were reported by (Hwang, et al. [32,33,39,44]).
Yeast and Mold Count
The differences in yeast and mold counts of deep fat fried chicken breast strips during frozen storage are shown in (Table 6). The results indicated that total yeast and mold count decreased gradually as the storage period progressed until the end of storage period. The obtained results also showed that control chicken breast strips had the lowest counts of total yeast and mold than other treatment. Similar results were reported by (Hwang, et al. [32,33,39,44]).
Sensory Evaluation of Deep Fat Fried Chicken Breast Strips During Frozen Storage (-18°C)
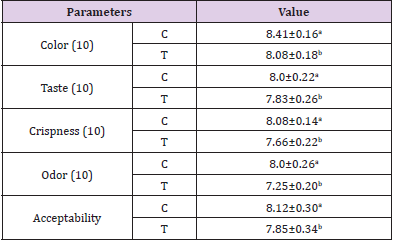
Poultry meat is a nutritious food and it is consumed all over the world because of its relatively low cost and low fat content. However, it is highly perishable with a relatively short shelf life even when it is kept under refrigeration. Thus, developing more appropriate technologies for its preservation could be highly useful, in order to increase the shelf life of meat products (Mantilla, et al. [48]). Statistical analysis appears a significant difference in sensory evaluation between both samples. Treatment containing MSG (control) had the higher sensory proprieties (color,taste, crispness,odor and acceptability) than that treatment containing mix of sugar and salt as MSG replacer (Table 7). The overall acceptability of deep fat fried chicken breast strips during frozen storage (-18±1°c) were significantly higher in (C), while it was significantly lower in the sample treated with mix of sugar and salt as MSG replacer . Statistical analysis appears a significant difference in overall acceptability between both samples. These results are in agreement with those obtained by (Hwang, et al. [32,33,39,44,49- 51]).
Table 7: Effect of replacing MSG with mix of sugar and salt in ratio of 1:1 on sensory evaluation of deep fat fried chicken breast strips during frozen storage (-18°C).


No comments:
Post a Comment
Note: Only a member of this blog may post a comment.