Thursday, September 3, 2020

Review of Literature Update Index, A New Index For Peer Reviewed Articles

Review of Literature Update Index, A New Index For Peer Reviewed Articles

Introduction

Designing the future system, by which we evaluate papers and decide which ones deserve broad attention and deep reading, is a great challenge of our time. The reviewer’ job as a journal advisor is to make sure that the best possible research appears in print. The purpose of peer review is to ensure

a. High standard, checking that no mistakes in procedure or logic have been made;

b. That the results presented support the conclusion drawn;

c. That no mistakes in citations to previous work have been made;

d. That all human and animal protocols conducted follow proper review and approval by appropriate Institutional Review Committees; and, very importantly,

e. That the work is original and relevant [1].

History

Since the first prototype professional peer-review process was started in the ninth century in the Ethics of the Physician written by Ishaq bin Ali al-Rahwi (854-931). His work indicates that a visiting physician must make duplicate notes of a patient’s condition on every visit. When the patient healed or had died, the notes of the physician were examined by a local medical council of other physicians, who would decide whether the treatment had met the required standards of medical service [2]. Peer review is the evaluation of work by one or more people of similar proficiency to the producers of the work (peers). It constitutes a form of self-organization by qualified members of a profession within the relevant field. Peer review methods are employed to maintain high levels of quality, improve processing, and provide reliability. In academia peer review is often used to rule out an academic paper’s appropriateness for publication.

Problem

As peer reviews process has many merits, it has also, some limitations. Yoshitaka Fujii currently holds the record for the most fraudulent articles of the scientific community. The Japanese anesthesiologist, who faked 172 papers, was dismissed by the University of Toho for lacking proper ethical approval for clinical studies in several of his papers. It later emerged that there was no evidence Fujii had collected any of the data published in his later retracted articles. Like many cases of fraud, this scenario raises questions about how misconduct went undetected for so long. In a world of peer review and hard data, how can fraudulent cases of such epic proportion be possible? And potential fraud is not the only concern; peer review is supposedly a central pillar of modern science, but a growing number of scientists are speaking out about what they regard to be unacceptable flaws in the system [2,3]. One of the major problems that confront the process of reviewing articles is to keep it as quality-control system for published articles and concurrent to be far apart from being a subjective process of evaluation that have bias and errors [4].

Unless universal standards are formulated, manuscript reviews remain subjective, imperfect and inconsistent at best. The time has come to reconsider the parameters of this system. This article aims to set a standard criterion in evaluation of Review of literature updates that help reviewers in the assessment of the reviewed articles by a numerical scoring system that indicates the overall originality and latest in cutting edge research of the paper submitted. The date of the reference is very important. Some topics, such as those in the health-related sciences, require contemporary information. Other subjects, such as Geology, value older material as well as current. However, Knowing the time n frame of the topic and examine the timeliness of the article is totally subjective and rating such; up-to-date, out-of-date, or timeless cannot help the reviewer to achieve a proper evaluation.

Charkawi Updates Index CUI

This Index will target peer review of research manuscripts submitted to scientific journals, but many of the elements of peer review can be applied to other areas, such as grants and books. The review section should include up to date references and be based on as wide and thorough a search of sources as possible. This simple score depend on counting the references included in the published article within the last five years from the publication acceptance date. Not only have that but included also, the evaluation of updated references in the discussion section and it shows to the reviewers how much the authors validated their results according to the most updated knowledge in the field examined.

If the total count of the references published in the last five years was

a. 100% this equal to score 10/10

b. 75% this equal to score 9/10

c. 50% this equal to score 8/10

d. 25% this equal to score 7/10

e. 15% this equal to score 6/10

f. 10% this equal to score 5/10

g. 5% this equal to score 4/10

h. Less than 5% this equal to score 2/10

A slight modification could be made especially in review papers that are considered millstones and bench mark in literature review and as it should cover the history and origin of the tested idea. This is achieved by counting references that were published in the last 10 years back from appearance of the article:

a. 100% this equal to score 9/10

b. 75% this equal to score 8/10

c. 50% this equal to score 7/10

d. 25% this equal to score 6/10

e. 15% this equal to score 5/10

f. 10% this equal to score 4/10

g. 5% this equal to score 3/10

h. Less than 5% this equal to score 1/10

This numerical system was based on that usually any article could have only few updated references and almost never happened that an article was 100% updated. An article could be rated updated if it is more than 50% and moderately updated if it is more than 25% and poorly updated if less than 15%. This Index (CUI) could be applied to review papers, case reports and even research projects. The Impact Factor (IF) which is a measure reflecting the average number of citations to recent articles published in the journal. However, all journals have a profusion of citations, and even the best have some deceitful papers and some miserably defective ones. So, it is ludicrous to judge an individual paper solely on the IF of the journal in which it is published [5]. The Eigenfactor (EF), on the other hand scores are measures of a journal’s importance and overall value provided by all of the articles published in a given journal in a year. It is apparent that no single guide sufficiently quantifies the creativeness of an article [5]. Both IF and EF can be used in combination with CUI-index to evaluate the work of individual This article in the discussion section and to detect any weak logic or irrelevant evidence.

Benefits

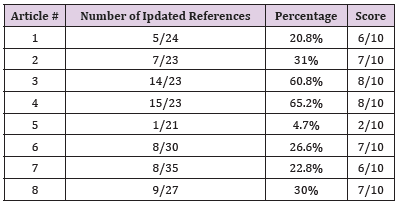
There is a strong consensus that the peer review process should include written reviews and numerical ratings. These classic fundamentals of peer review continue to be useful. The CUI index has many advantages. It gives the reviewers a numerical tool that helps them in assessment of the originality of the paper submitted, review coverage to all aspects of the subject and meanwhile to evaluate objectively the validity of the research to the current knowledge in the field. However, it helps reviewers to avoid largely speculative criticisms not supported by specific data or literature; or lack of evidence that the criticisms are actually relevant to the specific data in the paper [6-8]. It also, reflects high ethical standards for both the reviewer and the author/s. This index helps the reviewer to detect fraud as well as any weak and unsupported logic especially in the discussion section. A true example of weak evidences just occurred. I was reviewing an article that is supposed to appear in January 2014 about hollow implants. The author usedas an evidence to support his logic for using the hollow implant- an article that was published in 1988. The author did not recognize that during this last 26 years, the hollow implant is no longer in use, and showed many problems such as bone saucerization, implant mobility or continuous pain in the implant area. Histology in many cases indicated a progressive bone resorption that extended down to the hollow basket area of the implant [9].

This implant does not even manufactured anymore! Because I have applied the CUI-index in this particular case, I was able to identify why the logic that the author depending on is completely irrelevant, unjustified and unacceptable. In the last eight articles that I have reviewed, it was found that CUI index was as follow (Table 1). In the other hand, CUI-index encourages authors to review the recent research papers in their domain and incorporated them in their articles. It provides a strong incentive for authors to heed the advice and to improve the paper [8]. As a reviewer to many scientific journals, I have implemented this index for many years during the process of reviewing articles and generated this numerical score that helped the overall evaluation process. I have found that this index is beneficial and decrease the amount of subjectivity in the judgment process. Kriegeskorte et al. [8] emphasized that the most important traits for a reviewer to have are courtesy, fairness, and punctuality [8]. However, this index arguably may also, provide a definitive signal of a paper’s de-facto importance.

Table 1: OCUI index.

biomedres-openaccess-journal-bjstr

Limitations

The proposed index although indicative; it is still cover only single facet of the peer review process. However, further attempts in transferring the peer review process to an objective qualitycontrol method should be given ways to appear.

Conclusion

The CUI- index proposed in this article that depends on counting the references cited in a certain article in the last five year before publication provided a simple, yet efficient and accurate way in assessment of how original and timely the article being reviewed.

Social Networks Stimuli: A Double Dekker Semi-Partialling Multiple Regression Quadratic Assigment Procedure (Mrqap) Approach: Case of Small-Scale Farmers in Kenya-https://biomedres01.blogspot.com/2020/09/social-networks-stimuli-double-dekker.html

More BJSTR Articles : https://biomedres01.blogspot.com

Wednesday, September 2, 2020

Social Networks Stimuli: A Double Dekker Semi-Partialling Multiple Regression Quadratic Assigment Procedure (Mrqap) Approach: Case of Small-Scale Farmers in Kenya

Social Networks Stimuli: A Double Dekker Semi-Partialling Multiple Regression Quadratic Assigment Procedure (Mrqap) Approach: Case of Small-Scale Farmers in Kenya

Introduction

Due to market imperfections, sourcing of hybrid and quality planting materials as well as market information for farm products in the country involves a high level of transaction costs. The government has tried to bridge these imperfections by providing extension services to the farmers. According to Odongo [1], the ratio of extension officers to farmer in Kenya is 1:1093 against the recommended 1:400. It is due to this ratio that farmers have designed other means to which they can supplement the services offered by agricultural extension officers. Human beings in nature are interactive creatures. These interactions among individuals in a given society enriches the human capital among the actors. Social network is therefore an important platform through which valuable information can circulate with ease among the actors. Owing to this, Cassi et al. argues that social networks can therefore be used as avenues by which farmers in developing countries can use to commercialize their productions.

A network is formed when a finite number of nodes/actors are interconnected by edges or ties. Actors in the net represent entities such as individual farmers and traders. These nodes represent different and distinct levels of centralities in the net. The ties represents the relationship between a pair of actors. Ties can either be friendship ties, informational ties, advice ties, and trading ties. According to Renard and Guo [2], social network is a major social capital embedded in personal relationships among actors. This therefore means that an actor in a network can easily disseminate his knowledge across the actors with ease. This therefore means that a resourceful network has prospects to improve the productivity as well as the welfare of households and the overall society. This study conceptualized the unit of analysis as the relationship between the variables and an n+n matrix for those farmers who rely on other sources other than government extension officers. In social network analysis, actors can be connected on the basis of similarities, group memberships, social interactions and social relations [3].

It’s therefore on this basis that these farmers’ network conceptualized households as often participating in networks that reduces market barriers and the ease to acquire quality inputs therefore enhancing the probability of banana commercialization. Social network data are dyadic in nature in the sense that they refer to the relations between pairs of actors. Since the unit of analysis is a dyadic in nature, Krackhardt [4] argues that network observations are independent of one another and therefore makes the standard regression tech¬niques not viable for analysis of this kind of data. To examine the extent to which small holder farmers are embedded to social networks, Double Dekker Semi-Partialling Multiple Regression Quadratic Assignment Procedure (MRQAP) approach in UCINET was used [5]. The farmers’ n+n matrix was regressed against the network variables. According to Tsai [6] interpretation of the results from such an analysis is interpreted as if it was an Ordinary Linear Regression. The advantage of MRQAP is that it’s effective in the analysis of the correlation between network and non-network data.

Study Area and Sampling Technique

The sample unit for this study consisted of smallholder banana farmers drawn from Kahuro Sub-County in Murang’a. County which were purposively selected. This was due to the intensity of banana farming in the area.

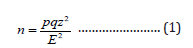
The required sample size was determined by proportionate to size sampling methodology (Anderson et al., 2007) [7].

Where n = sample size, p = proportion of the population under banana farming, q = 1-p, z = confidence level (α = 0.05), E = acceptable/allowable error. Since the proportion of the population was not known, p=0.5, q = 1-0.5= 0.5, Z = 1.96 and E = 0.075. This resulted to a sample size of 171 Households. These households were randomly selected among small scale banana farmers in the sub-county.

Results and Discussions

The basic linear model for square matrix data considered in this study was:

Where Z is an n × n matrix for farmers who rely on fellow farmers, β, γ and n are scalars, X, Y and N are an n × n matrices that captures the stimulators to networking. The diagonals of the matrices were ignored since they capture an actor’s relation with him/herself. The null hypothesis was Ho∶ β,γ,n =0. The matrices X, Y and N are not assumed to be independent.

Stimulators to Social Networking Among Banana Farmers

In this section, the MRQAP has been used to test the hypothesis that networking among banana farmers has no relationship with gender, friendship, neighborhood, fellow farmers, farmers who are also market traders, education, and similarity in group membership; henceforth referred to as informal sources in the context of this study. An n by n matrix of the farmers who rely the informal sources form the dependent variable. In this procedure, Ucinet software was used to analyze the extent to which informal sources act as stimuli towards sourcing of information and inputs by the farmers in the study area.

Double Dekker Semi-Partialling MRQAP Results

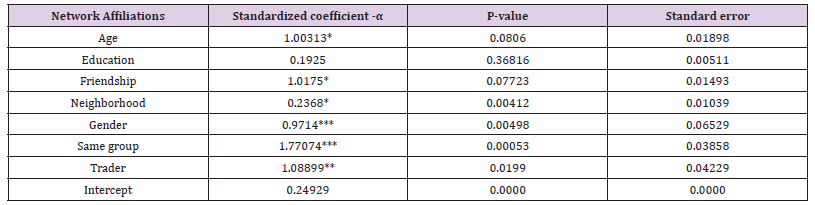
The point of focus in this section is the p-values which meets the QAP threshold of statistical significance; i.e. farmers who considered their age mates, neighbors, farmers of their gender, those whom they are in the same membership groups and farmers who are banana traders as the sources of information and planting materials. The dependent variable is only the farmers who rely on ‘informal sources’ of information as conceptualized in this paper. The regression coefficients in the Table 1 shows a positive relationship between farmers in the same age group and the ease to have social ties. Friendship among the actors in the network has proven to have a positive relationship with social ties. (α-1.175 p-0.0772) Farmers in the same physical neighborhood share resource and information 0.24times more often than those people who are not neighbors with a probability 0.412% that this will occur by chance. On the other hand, banana farmers get information from farmers who are also banana traders 1.089 times more often with non-traders with a probability of 1.99% that this is by chance. Banana farmers network among the same gender 0.974 times more often with a probability of 0.5% that this is by chance. Finally, farmers in the same group/membership network 1.77 times among themselves with a probability of 0% that this is by chance.

Table 1: Coefficients of MRQAP regression.

biomedres-openaccess-journal-bjstr

Note: Pseudo R2= 0.57; ***, **, * significant at 1%, 5% and 10% respectively.

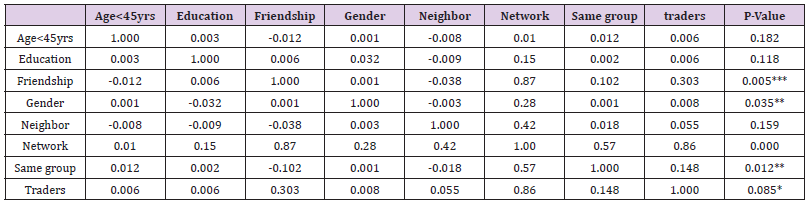
To ascertain that the above output were not merely by chance, QAP correlation test for significance on the same data was performed to permit more discussion. In QAP correlation, each variable was measured using a different matrix in which all matrices feature the same node but have different relations in the cells representing a different idea about how the nodes could possibly relate to each other. This study analyses how networking among banana farmers is correlated with the independent variables. Essentially, it tries to capture whether similarities in various aspects breeds or acts as a pull factor towards networking. What it does is trying to explain how farmers of the same gender, same education level, same group, traders, friendship, age mates and neighborhood breed connections. The horizontal variables are a copy of the vertical ones (Table 2).

Table 2: QAP Correlation.

biomedres-openaccess-journal-bjstr

There is a strong positive correlation (0.87) between friendship and networking. The correlation coefficient has a p-value of 0.005 which far meets the QAP correlation test of significance. This shows that it is not by chance alone that banana farmers in Kahuro division considered network partners as friends. In the network alliance, friendship is a reciprocal variable and therefore all farmers in their particular networks considered each partner in their networks as friends and this is a critical component in the process of sharing resources and information among participants in a network. These findings are relevant for understanding the role of friendships in a given society. It is undeniable that people select and influence each other; thus, social networks are powerful tools for disseminating information especially when the central actors in the net are information banks [8,9]. The study considered a heterogeneous sample selection in terms of gender composition. The correlation coefficient between networking and gender is 0.28. This is a weak positive correlation which is statistically significant at 0.035. Male farmers tend to network with male farmers while female farmers tend to network with their female counterparts. This is induced homophile where birds of the same feathers flock together. However, there is a slight diversity of gender composition in the network as indicated by the size of the correlation coefficient. This ensures that there is a perfect mix in terms of information generation. Diversity in any institution is critical to ensure that there is a resource mix in the network and therefore ensuring a complete informational cycle within the net since male and female are endowed differently.

Previous studies have attributed group membership as a proxy for social capital where members of a group take advantage of group formation to increase their bargaining power. In this study, a group is defined as any form of informal organization among actors. In other words, actors who are members to any group were considered in this study. There is a positive correlation of 0.57 (0.012). The argument in this is that people in the same group enjoy similarity in resources and information and therefore members of a common group tend to network with non-similar others as much as they interact with themselves. Fundamentally, this means that banana farmers enjoy diversity of information and resources and therefore chances of an alter in this network lacking the information or resources that an ego farmer needs is very low. Banana farmers tend to network with trader (farmers who are also traders) more often in search of information. This is indicate by the strong correlation coefficient of 0.86(0.085). This means that as much as the farmers rely on each other to share resources, a credible number rely on traders to get information. This concurs with the findings by Fafchamps et al. [10] who concluded that farmer relationships with other traders will, among other things; helps economize and reduce on transactions costs. Relationships and social networks may thus enable agents to economize on transactions costs even though they would probably fail to achieve the same level of aggregate efficiency as perfect markets. Of course, there may exist yet other omitted unobservable that may bias the results. In the absence of panel data, these effects can unfortunately not be controlled for.

Conclusion and Recommendations

To identify motivations towards farmers networking, gender, group membership and friendship were found to be influential in dependence on farmers’ network. This ensures that there is a perfect mix in terms of information generation. Farmers who were relying on fellow farmers for information were found to possess a high degree of commercialization. This is attributed to the fact that networking among the farmers is a form of human capital on its own and is able to minimize transaction costs involved in farming and marketing which has always been identified as a barrier to agricultural commercialization. It’s clear that the gap of farmers to extension officers is widening each and every day as the government embarks on food security. It’s therefore paramount that the governments in developing economies become cognizant on the role played by social networks in supplementing the services offered by extension officers. The most central actors in a network should be identified and equipped with modern technologies to ease the dissemination of modern farming technologies.

Early Nano Detection of Liver Toxicity and Injury-https://biomedres01.blogspot.com/2020/09/early-nano-detection-of-liver-toxicity.html

More BJSTR Articles : https://biomedres01.blogspot.com

Tuesday, September 1, 2020

Early Nano Detection of Liver Toxicity and Injury

Early Nano Detection of Liver Toxicity and Injury

Introduction

The exposure to toxic pollutants and its accumulation in the tissues increases the potential risk of health-related issues such as liver toxicity. In addition, many drug metabolites in the liver make it a vulnerable organ for potential toxicity and hepatocyte injury. Though direct exposure of most toxic organs to nanomaterials via the bloodstream is rare unless in medical route, and the liver is one of the most important targets. How to establish an efficient method for early detection of liver toxicity and prevent irreversible damage is the major topic in recent years. The inherent relationship between human liver architecture and its drug-induced injury was emphasized in earlier published literature [1].

Various liver toxicity tests have been proposed based on the latest progress in human microfluidic tissue culture devices [2-5]. Chip-based human liver equivalents are envisaged to identify liver toxic agents regularly undiscovered by current test procedures at industrial throughput. Microfluidic microscale liver equivalents, appraising them against the level of architectural and, consequently, functional identity with their human counterpart in vivo has been well experimented in recent years. The structural and functional integrity of the epithelial layer which forms the protective barrier for skin is vital to prevent exposure and damage from external toxic factors. In recent era, conventional chop-stick electrodes are used to monitor the change of epithelial layer integrity. Once the barrier of the epithelial is compromised, the Trans-Epithelial Electrical Resistance (TER) decreases significantly. TER can change from 3,000 to 500 cm2 in 40 mins for Mature Kidney Epithelial Cells (MDCK) [6-8]. Microfluidic chips are the small platforms comprising channel systems connected to the liquid reservoirs on the chip. The general size of these channels is in the range of a few hundred micrometers to several millimeters. Specific channel design and integrated tools such as electrodes or a specific surface pattern, even of many operational steps, can be incorporated successively together on the same chip. Such miniaturization can expand the capability of existing bioassays. Many microfluidic systems have successfully incorporated various types of cells into chip designs [9-11].

An increased TER of the cells in culture is an indication of cell monolayer health and confluence. MDCK-E cells are most suitable medium for the TER measurement. In recent studies, the TER measurements were made using a Millicell ERS-2 device (Millipore) and chopstick-style electrodes [12-14]. Cytotoxicity assays rely on measuring one or more cytotoxic indicators, including loss of membrane integrity (LDH release) and Metabolic Activity (MTT assay). MTT assay is a common method to evaluate a liver injury caused by hepatic toxins by measuring the metabolic activity of the cells. Plasma membrane damage can be the consequence of various cytotoxic effects. Plasma membrane damage releases LDH into the cell culture media. Extracellular LDH in the media can be quantified by LDH assay. The level of LDH release is indicative of cytotoxicity. MTT assay and LDH release assay in C3A cells are relatively insensitive to human hepatotoxic drugs, which take 48~72 hours and 16~24 hours to detect cells toxicity, respectively [15].

Recent advances in nanotechnology have greatly increased the biological applications of nanomaterials, especially in the field of nanomedicine. Graphene consists of bi-dimensional sheets of carbon atoms arranged in hexagonal rings. Its highly oxidized form was the so-called Graphene Oxide (GO), which was characterized by the presence of oxygen-containing moieties, such as epoxy, hydroxyl, carbonyl and carboxyl groups, on the basal plane and edges of the sheets [16-20] Graphene-based nanomaterials have been used in a range of biological applications, including biosensors because of their preferential interactions with single strand DNA, bioimaging tools because of their intrinsic fluorescence and/ or facile functionalization with fluorophores, carrier of genes for cellular transfection, delivery of small molecules of drugs for cancer treatment, and scaffolds for mammalian cell proliferation and differentiation [21-23].

In this study, we aimed to present the concept of using TER and Light Addressable Potentiometric Sensor (LAPS) technical platform with acetaminophen or graphene as hepatocyte detecting chips to measure liver toxicity.

Materials and Method

Cell Cultures

MDCK-E (canine kidney cells) and C3A (Human Hepatoblastoma) cell lines obtained from Bioresource Collection and Research Center were cultured in Eagle’s Minimum Essential Medium (MEM) supplemented with 10% Fetal Bovine Serum (FBS), 100 units/ml penicillin, and 100 units/ml streptomycin, 0.1mM non-essential amino acids and 1.0 mM sodium pyruvate. Cells were maintained under standard conditions at 37°C in a humidified atmosphere of 5% CO2/95% air in a water jacket CO2 Incubator.

MTT Assay

Thecolorimetric3-(4,5-dimethylthiazol-2-yl)-2,5-diphenyltetrazolium bromide (MTT) test was performed to assess the metabolic activity of the cell. The assay was based on the ability of the Mitochondrial Dehydrogenase (MDH) to convert dissolved MTT to an insoluble purple formazan. This water insoluble formazan was solubilized using either isopropanol or other solvents and the dissolved material was measured absorbance by spectrophotometry. The metabolic activity of the cell can be derived from the color density formed. Briefly, C3A cells were seeded at 96-well plate at density of 10,000 cells /well and cultured for overnight. Subsequently, cells are exposed to increasing concentrations of the toxins for 24h or 48h. Control groups for this study were the cells in media (minus toxin) which were processed identically and incubated simultaneously as the treated groups. In final two hours of incubation, 10% culture volume MTT solution (5 mg/ml in MEM) was added to each well. At the end of the incubation period, the medium was removed, and the converted dye was then solubilized with 100ul solvent (DMSO: isopropanol / 1:1). Absorbance of converted dye was measured at a wavelength of 570 nm with background subtraction at 630–690 nm.

LDH Cytotoxicity Assay

Lactate dehydrogenase (LDH) was a cytosolic enzyme present in many different cell types and gets released into the circulation after plasma membrane damage. Extracellular LDH in the media was quantified by a coupled enzymatic reaction in which a red formazan product was measured at 490nm spectrum. The level of formazan formation was directly proportional to the amount of LDH released into the medium, which was indicative of cytotoxicity. Briefly, C3A cells were seeded at 96-well plate at density 50000 cells/well and cultured for overnight. Subsequently, cells were exposed to increasing concentrations of the toxins for 4~8h, 24h and 48h. Control groups comprised of cells in media (minus toxin) which were processed and incubated simultaneously as the treated groups. In the end of incubation, supernatants were collected for LDH release assay. The LDH released into the medium was transferred to a new plate and mixed with reaction mixture. After an incubation period of 30 minutes at room temperature, the reactions were stopped by adding a stop solution. Absorbance at 490nm and 680nm spectra was measured using a plate-reading spectrophotometer to determine LDH activity.

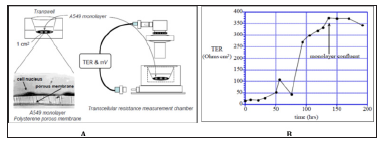
Figure 1: Airway epithelial cells in air-liquid interface and measuring device were shown in A for them physiological properties. TER (Ω.cm2) across a monolayer of human pulmonary A549 cells grown on polyester membrane support was shown in B.
biomedres-openaccess-journal-bjstr

TER

Measurement of cells connection (like tight junction) in cultivation of endothelial or epithelial cells on permeable membrane supports was used. Figure 1 Endothelial and epithelial cells had tightly connection, which formed a flat barrier. TER could measure the electrical resistance of barrier, which was positive-correlative with the barrier integrity and cells mortality. C3A cells (~5×10⁵) were seeded in clear polyester membrane inserts with a diameter of 12mm (Costar) and were grown to confluence. The inserts were monitored each day for confluence and TER measurements were performed using a Millicel-ERS ohm voltmeter (Millipore). In addition, the epithelium expressed both glucocorticoid receptors (GR1 and GR2) and a Mineralocorticoid Receptor (MR), and cortisol treatment significantly increased TER. Hydrocortisone was given for elevating TER.

LAPS

Laser to induce PV-V and detect the hydrogen ion (PH) changing on the surface of sensitive inductor was used, which could give a quick and real-time monitor for the multiple walls in the same time, and there was a sterile space without contamination, make process of early cell toxicity detection realizable. We used MDCK-E cell combined with hepatocyte for a TER assay. One of the cell lines used to study hepatotoxicity in vitro was C3A, which was a subclone of human hepatocellular carcinoma HepG2. Acetaminophen was the hepatotoxic drug used as test compound because it was a well-known hepatotoxic drug. The MTT cell viability test and LDH cytotoxicity assay was also taken in the experiment to make sure if our methods really take less time in detection of cell toxicity. By above tests, we could develop a platform to detect early toxicity of hepatocyte. The second toxin was graphene nanoplatelets, which have been used in a range of biological applications, including biosensors, bioimaging, drug delivery, and nanomedicine.

Results

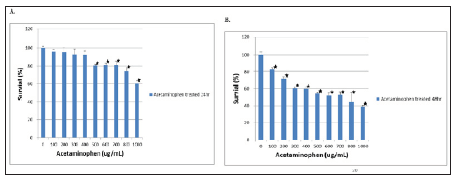
The viability of the C3A cell exposed to acetaminophen was evaluated using the MTT assay. The C3A cells treated for 24 hours and 48 hours with acetaminophen at high concentrations showed significantly lowered viability. Figure 2 we did not observe any significant differences in viability after 24 hours of exposure to acetaminophen at lower concentrations (< 400 ug/ml) as the Figure 2a. After 48 hours of exposure to acetaminophen, we observed that the cells appeared to be decreased viability in a dosedependent manner. Specifically, the cells treated with 500ug/ml acetaminophen loss about 45% of viability and the cells exposed to 1,000 ug/ml acetaminophen loss about 60% of viability Figure 2b.

Figure 2: MTT assay - The viability of C3A cells incubated with different concentrations of acetaminophen, from 100 ug/ml to 1,000 ug/ml were treated for 24 hours (A) and 48 hours (B), : p < 0.05 vs no addition of acetaminophen.
biomedres-openaccess-journal-bjstr

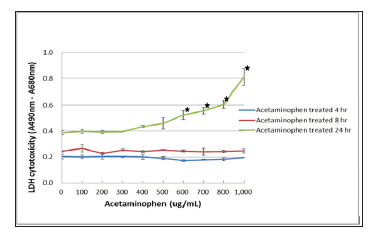
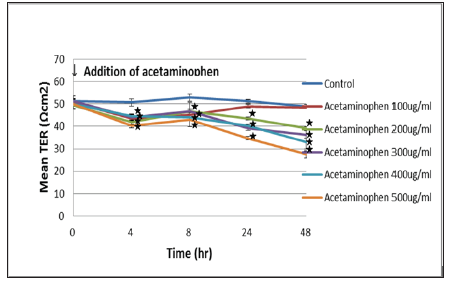
Quantification of the cellular cytotoxicity was done by measuring extracellular LDH activity. After 4 to 8 hours of exposure with the acetaminophen, no LDH leakage could be observed in C3A cells culture even at concentrations as high as 1,000 ug/ml. Figure 3 after a 24 hours of exposure, we observed that the higher concentrations of acetaminophen (> 600 ug/mL) significantly increased LDH release which is indicative of the cytotoxicity. The decrease in TER correlated with acetaminophen concentration after 4 hours of exposure proved the positive correlation between TER measurement and cells toxicity in a very short time (Figure 4). In principal TER has been shown to correlate with a multitude of cellular features, such as intercellular connectivity and cell morphology. In this study, we evaluated that TER could be used to draw the conclusions on mortality and cytotoxicity of hepatocytes.

Figure 3: Determination of LDH cytotoxicity of acetaminophen in C3A cells was shown in C3A cells were incubated with different concentrations of acetaminophen treatment for 4, 8 and 24 hours. LDH cytotoxicity was measured using the Pierce LDH Cytotoxicity Assay Kit. The LDH cytotoxicity significantly elevated when acetaminophen concentration increased to 600 ug/ml and treated for 24 hours : p < 0.05 vs no addition of acetaminophen.
biomedres-openaccess-journal-bjstr

Figure 4: Effect of acetaminophen on the TER value of the C3A cells was shown. C3A cells were seeded in clear polyester membrane inserts and exposed to increasing concentrations of acetaminophen. TER measurements were performed using a Millicel-ERS ohm voltmeter (Millipore). The TER values significantly decreased after 4 hours of addition. : p < 0.05 vs initial addition of acetaminophen.
biomedres-openaccess-journal-bjstr

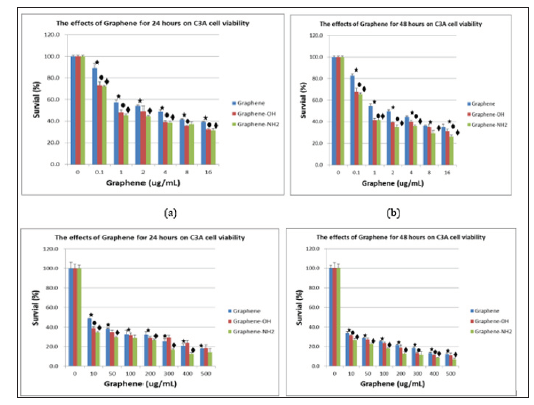
The cytotoxicity of two derivatives of graphene, graphene-OH and graphene- NH2 was compared in human hepatoma C3A cells (Figure 5). The MTT assay was used to measure the metabolic activity of the cells. Exposure of C3A cells to graphene, graphene- OH and graphene- NH2 for 24 hours resulted in a dose-dependent decrease in absorbance values that indicated a reduced metabolic activity of these cells. At a concentration of 0.1 ug/ml, the cells lost 11%, 27%, and 28% of viability over 24 hours of treatment, and 18%, 35%, and 37% of viability for next 48 hours of treatment (Figure 5a & 5b). At a higher concentration of 10 ug/ml, the sequential cell viability loss was 55%, 62%, and 66% for initial 24 hours of treatment, and 65%, 70% and 75% of viability loss for next 48 hours of treatment (Figure 5c & 5d). The MTT assay results indicated that the order of cytotoxicity was graphene < graphene -OH < graphene- NH2.

Figure 5: MTT assay - The viability of C3A cells incubated with different concentrations of graphene nanoplatelets. A (treated 24 hours) and B (treated 48 hours) were low concentration (0.1~16 < ug/ml), while C (treated 24 hours) and D (treated 48 hours) were high concentrations (10~500 ug/ml). : p < 0.05 vs no addition of graphene, and : p < 0.05 vs graphene of different concentration.
biomedres-openaccess-journal-bjstr

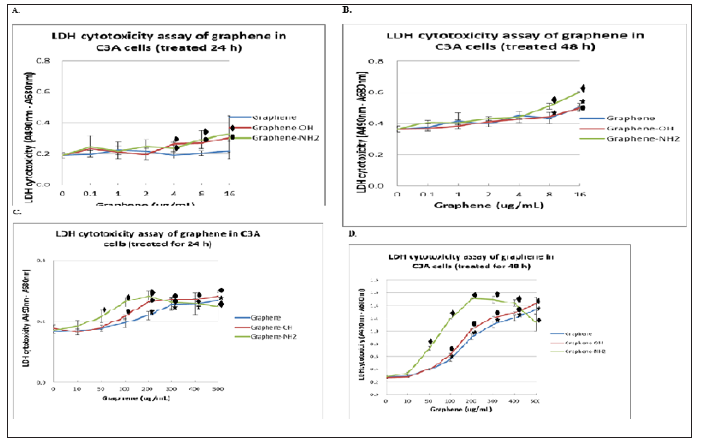
The LDH assay was used for evaluated cellular cytotoxicity by measuring cell membrane integrity. The LDH assay results indicated that the three graphene nanoplatelets caused dose- and time-dependent cytotoxicity in C3A cells with plasma membrane damage. Figure 6 after a 6 hours of exposure, we observed that the concentrations ≥ 50 ug/ml of graphene- NH2 and ≥ 100 ug/ ml of graphene and graphene-OH significantly increased LDH release. The order of cytotoxicity was graphene < graphene -OH < graphene- NH2 based on the LDH assay result. The three graphene nanoplatelets caused an increase in LDH leakage only at the higher exposure concentration (≥ 50 μg/ml) treated for 48 hours (Figure 6D). Therefore, the LDH assay might not be the most appropriate one to assess the cytotoxicity of graphene nanomaterials.

Figure 6: Determination of LDH cytotoxicity of grapheme nanoplatelets in C3A cells was shown. C3A cells were incubated with different concentrations of grapheme nanoplatelets. LDH cytotoxicity was measured using the Pierce LDH Cytotoxicity Assay Kit. A (treated 24 hours) and B (treated 48 hours) were low concentration (0.1~16 < ug/ml), while C (treated 6 hours) and D (treated 24 hours) were high concentrations (10~500 ug/ml). : p < 0.05 vs 2ug/ml of graphene in A and B, and 10 ug/ml in D. and : p < 0.05 vs graphene of different concentration.
biomedres-openaccess-journal-bjstr

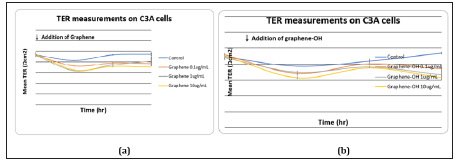
The effect of graphene nanoplatelets on the TER value of the C3A cell monolayer is shown in (Figure 7). Although the LDH release induced by graphene nanoplatelets at 10ug/ml was not distinctive, the TER value of the C3A cell monolayer was significantly decreased by incubating with this concentration of graphene nanoplatelets. After 6 hours of exposure, the TER reduction was apparent. Incubating with only 0.1ug/ml graphene nanoplatelets also caused the TER value to decrease.

Figure 7: Effect of graphene nanoplatelets on the TER value of the C3A cells was shown. C3A cells were seeded in clear polyester membrane inserts and exposed to different concentrations of graphene nanoplatelets.TER measurements were performed using a Millicel-ERS ohmvoltmeter (Millipore).(A) graphene (B) graphene-OH (C) graphene-NH2. , , and : p < 0.05 vs control
biomedres-openaccess-journal-bjstr

Discussion

The advancement of technologies in biomedical research for toxicology, and particularly in in-vitro experimental models, has increased the possibilities of applications of such advances in diagnosis more complex disease processes. New mechanistically based methods could be established from all these approaches, which, once validated, can be applied to clinical practice [23- 25]. TER is a widely accepted quantitative technique to measure the integrity of tight junction dynamics in cell culture models of endothelial and epithelial monolayers. Their values are strong indicators of the integrity of the cellular barriers before they are evaluated for transport of drugs or chemicals. TER measurements can be performed in real-time without cell damage and generally are based on measuring ohmic resistance or measuring impedance across a wide spectrum of frequencies [26].

Nanoparticles have been shown to translocate to the blood stream following inhalation and ingestion, and the liver is an important organ to accumulate [27,28] Graphene represents a valuable platform for the development of nanocomposites, allowing the combination of nanomaterials with different properties to give novel materials with improved or new functionalities. Specifically, GO is an important platform for the attachment of silver nanoparticles. The high surface area of GO sheets serves as a support for growth and stabilization of nanoparticles, which prevents them from aggregating. These silver-based nanocomposites have excellent antimicrobial properties, they represent an alternative to the inefficacies of long-used antibiotics.

Our previous results as in (Figure 1) showed that monolayer confluent MDCK-E cell culture achieved the highest TER up to 3,750 Ωcm2 on day 6, and TER was positive-correlated with culture time during day 1to day 6. It can be a reference for liver cell culture and TER measurement. In the C3A cells culture results, the TER showed nearly 30 Ωcm2, which was almost one-hundredth of MDCK-E cell, may be easily interfered by noise. And there were no related between TER and culture time. The results showed that C3A cell could not be a well measurement by TER, which could blame it on C3A cell did not grow well and form a loose membrane. Without tightly connecting between cells, TER decreased to a lower status. This phenomenon also had been observed by microscope. Then we tried to add acetaminophen for toxicity test. C3A cultured with different concentration acetaminophen was given on day 5, and result showed no significant change, unless giving higher dose of acetaminophen. In low dose of acetaminophen, TER decreased in a tiny and irregular way. As the result of addition of acetaminophen, TER could not perfect expressing the toxicity of C3A cells, which might due to the same problem that lose membrane could not be measured by TER correctly. How to culture liver cell and elevate TER should be the first priority to be resolved.

To increase TER in C3A cell culture, hydrocortisone was given. Compared with experiment group (hydrocortisone) and control group (non-hydrocortisone), C3A cell cultured with hydrocortisone presented a higher TER than before, nearly double time of control group. And in the toxicity experiment, acetaminophen added in C3A cell with hydrocortisone showed that higher TER decreasing rate correlated with culture time, which made TER measurement become more meaningful than toxicity experiment without hydrocortisone. Although TER measurement could detect C3A cells toxicity, the major part of toxicity measurement in the experiment was about shorter detecting time. Theoretically, TER measurement should have powerful ability to detect toxicity in a short time after toxin added. We managed an experiment to identify that. C3A cells were exposed to increasing concentrations of the toxins, and checked TER on 4 hours, 8 hours, and 24 hours after toxin adding. The result showed that TER decrease significantly with different dose of toxins on 4 hours and 24 hours. On 8 hours, the decreasing of TER seen to be more irregular, which might due to TER was too small to be detected, or the cell toxicity was overwhelming.

To assure TER measurement is faster than LDH cytotoxicity assay, which is the most quickly liver toxicity measurement in recent years. We tried to perform LDH cytotoxicity assay in C3A cells and checked LDH release on 4~8 hours and 24 hours after toxins adding. The result showed that on 4 hours there was no elevation of LDH release. On 24 hours, LDH release elevated significantly and proportional to concentration of toxins. It proved that LDH cytotoxicity assay can detect toxicity less than 24 hours but more than 4 hours, just like the previous papers presented. We have proven that TER measurement has faster detection of cell toxicity, yet we still couldn’t culture liver cell to form a high TER layer just like MDCK cell dose. Mixture of different cell types to make a compensation of primary culture hepatocyte and liver cell lines provided with tumor characteristic will be the future step.
Precise Information on Anisometropia-https://biomedres01.blogspot.com/2020/08/precise-information-on-anisometropia.html

More BJSTR Articles : https://biomedres01.blogspot.com

Antimalarial Aloe Compounds

  Antimalarial Aloe Compounds Introduction Among the most prevalent diseases caused by protozoan parasites, malaria is caused by parasites o...