Methylene Blue Adsorption onto Surface Modified Beli (Aegle Marmelos) Fruit Shell Biochar
Introduction
As the demand of humans for more comfort life in health, food, transportation continues to increase, the technological advancement results in environmental degradation in water, soil and air. Aquatic systems are, therefore, heavily polluted by various toxicants including heavy metals, organic dyes, pesticides etc. The removal of these toxicants from contaminated waters is of critical importance as they pose serious health issues in living organisms. Over the past years, various methods have been employed and developed for the decontamination of polluted water based on chemical precipitation, ion exchange and membrane filtration methods [1,2]. High reagent requirement, complexity and high cost being the major drawback of these methods, therefore, the removal of toxicants in water based on adsorption on readily available natural materials has become popular due to its simplicity, low cost and efficiency. In this context, various adsorbents such as activated carbon, activated alumina, silica gel, magnetic grapheme oxide have been extensively reviewed.
Activated carbon is a proven adsorbent for an efficient removal of a range of organic dyes and toxic heavy metals due to huge surface area and the network of submicroscopic pores where adsorption takes place [3-5]. Since commercially available activated carbon is more expensive, alternative cheap carbon-based materials from heat and chemically treated leaves, bark or fruits shell of variety of plants collectively known as biochar are attractive adsorbents for water purification in recent years. Biochar derived from rice straw, Neem leaves, oak, pine, Coconut tree sawdust etc. have shown promising sorption abilities toward heavy metals such as Pb, As, Cu, Cr and organic dyes like methylene blue [6-8]. Biochar is a carbon rich, solid product resulting from the pyrolysis of carbonaceous biomass under inert atmospheric and low temperature conditions. Pore size and distribution, acidic functional groups such as carboxy, lactone, and phenolic hydroxy groups are the key sites directly responsible for sorption process. In order to develop these surface functionalities which in turn enhance the absorptive properties, biochar undergoes for various chemical treatment methods such as nitric acid and ammonium persulfate, H2SO4/HNO3 oxidation, KOH activation, ZnCl2 and H3PO4 activation prior to use as an absorbent [9-15].
Herein we describe our investigations to check the feasibility of biochar derived from Beli fruit (Aegle marmelos) shell as an efficient adsorbent for methylene blue sorption. Beli trees are widely grown in hillside area of Sri Lanka and other Asian countries and plant parts have more derivatives with medicinal properties and used for making traditional ayurvedic drugs and foods [16]. Adsorption experiments were carried by batch type mode by using methylene blue dye. The batch contact time experiments were used to determine the adsorption rate. All kinetic parameters were then estimated. The results will be valuable for future eco-friendly application of BFBC in color removal from waste water.
Experimental
Materials
Phosphoric acid was purchased from Fisher scientific UK. Methylene Blue was obtained from Cangzhou Xincheng Weiye Chemical Co., Ltd, China in 70% purity.
Table 1: Preparation variables of activated bio chart.

Preparations
Matured Beli was collected from the western province in Sri Lanka. Cornel of the fruit was removed and the shells were cut into small pieces and washed several times with distilled water and soap flexed to remove adhered contaminations from its surface. After ultrasonically washing with distill water to remove excess chemicals, finally dried at 80oC in the muffle furnace for 5h. Before pyrolysis, the raw shells were ball milled at 450 - 500 rpm for 05 minutes and the micro level particles were treated with 1.5 M H3PO4 for 15 minutes at 360oC. Heating rate of 10oC min-1 was maintained under nitrogen atmosphere and allowed to cool down to room temperature followed by washing thoroughly with distilled water and dried in the muffle oven at 105oC for 1 hour (BFBC). Other biochar products were also prepared under the prescribed conditions given in the Table 1. In order to determine the activity level of the each Beli activated carbon samples, iodine number was determined according to the standard test method ASTM D 4607.
Characterization
Proximate analysis of adsorbent, properties such as moisture content, ash content, volatile content, thermogravimetric measurements were recorded on TGA Q-500 analyzer (TA Instruments, Inc., New Castle, DE, USA). Thermogravimetric (TG) profiles were recorded from 25 to 800oC under nitrogen atmosphere with a heating rate of 10oC / min using a high-resolution mode. The weight of each analyzed sample was typically in 10-20 mg range. Iodine number was determined using ASTM D 4607standard test methods. Nitrogen adsorption isotherms were measured at -196oC on an ASAP 2010 volumetric analyzer (Micromeritics, Inc., Norcross, GA, USA). Prior to adsorption measurements, all samples were out gassed under vacuum at 200oC for 2 h. BET surface area was also determined by an ASAP 2010 volumetric analyzer (Micromeritics, Inc., Norcross, GA, USA) and the morphological and surface chemistry features of the activated carbon were observed with the Scanning Electron Microscope (SEM) and Fourier Transform Infra-Red (FTIR) (Shimatzu IR affinity- 01) spectroscopy analysis. Elementary analysis of active carbon was done by EDX (ZEISS EVO LS 15 SEM with Oxford EDX-electron diffractive X ray.). Adsorption studies were carried out batch wise and adsorption measurements were obtained by UV-spectrophoto meter (Shimadzu1800, Japan) at 645nm.
Specific surface area and porosity calculations. The single-point pore volume (Vsp) was estimated from the amount adsorbed at a relative pressure (p/po) of ~ 0.98. The Brunauer-Emmett-Teller specific surface areas (SBET) was calculated from the N2 adsorption isotherms in the relative pressure range of 0.05-0.20 using a cross sectional area of 0.162 nm2 per nitrogen molecule. Pore Size Distributions (PSD) were calculated from adsorption branches of nitrogen adsorption–desorption isotherms using the 2DNLDFT Heterogeneous Surface model for carbon materials implemented in SAIEUS program provided by Micromeritics [17,18] The cumulative pore volume of micropores, (pores below 2 nm) was calculated on the basis of the PSD curves obtained by the DFT software.
Preparation of methylene blue solution. For adsorption characteristics of methylene blue ( C16H18ClN3S) on biochar, a mass of 0.008 g of methylene blue (molar mass = 337.87 g) was dissolved in deionized water and finally volume up to 1000 mL. Batch adsorption experiment. Aqueous solutions of methylene blue with initial concentrations (8 mg/L) were prepared. 0.3 g of BFBC was added into the flask containing 50 mL of the prepared methylene blue solutions and stirred at 27 ± 1oC at the rate of 700 rpm. One mL from the solution was withdrawn at regular time intervals and biochar from the solution was separated immediately by using the micro centrifuge operating at 6000 rpm for 10 min. The final concentration of MB in the solution was determined by UV- Visible spectrophotometric analysis and the adsorption capacity of MB on BFBC was determined.
Result and Discussion
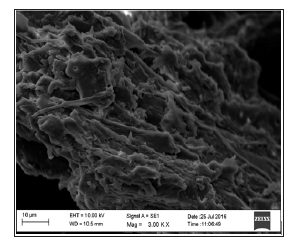
Textural characterization by Scanning Electron Microscopy (SEM) analysis. Scanning Electron Microscopy (SEM) was used to observe the morphology of raw Beli fruit shells, activated carbon produced by phosphoric acid activation. EDX results were used for elemental analysis of Beli fruit activation steps. SEM micrographs of raw Beli shells indicate its surface heterogeneity (Figure 1). roughness and hidden porous structure before chemical treatment. Due to formation of carbonized product as an intermediate in the char activation experiments, the structural changes in the surface morphology of char was seen. After carbonization at 360oC, formation or waves and pits occurred on the surface of the material. Figures 2a & 2b shows the development of porosity and swelling the surface because of the removal of the tarry substances from the internal structure. Also, it gives the acidic nature to the surface [10]. Therefore, the pyrolysis step, followed by suitable washing process removed the excess contaminants from BFAC surface and sponge-like porous surface morphology was seen in Figure 2c. The significant of this activation compared to other methods is due to low-temperature profile and shorter time duration. The EDX results confirm the release of volatile material remarkably from carbon. Micrographs belong to the activated carbon produced by char activation method with phosphoric acid yielded BET surface area of 517 m2/g. Such a high porous nature of BF activated carbon claims as an efficient adsorbent towards pollutants.
Figure 1: SEM Micrograph of Raw Beli powder.
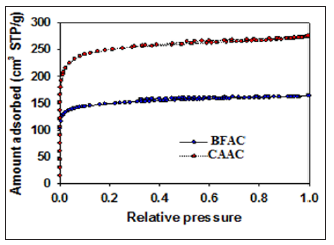
The molecular nature of the BF activated carbon surface was analyzed by FTIR spectroscopy (Figure 3). Since activated BF carbon is composed of silicon, the FTIR spectral data should show absorption due to Si-O-Si bonding and these peaks are located at the wavelength around ~499.56 cm-1 [19]. The polysaccharide cellulose which fundamentally comprises of several D-glucose units showed prominent characteristic peaks of O-H, C-O, and glycosidic linkages. The peaks at 2890 cm-1and 3372 cm-1 could be attributed to the C-H and O-H stretching, respectively [20]. Absorption at 1672cm-1 is the result of vibration of carbonyls (C=O) in the amide bond. Thermogravimetry (TG) and differential thermogravimetry (DTG)studies. Thermal stability of the activated carbon samples was analyzed by using high-resolution Thermogravimetry (TG) and Differential Thermogravimetry (DTG) profiles (Figure 4) in the temperature window of 25 to 800oC under nitrogen atmosphere. Two thermal events were observed on the DTG profile at 20- 150oC and 390-550oC. The insignificant first peak of AC samples is responsible for evaporation of physically adsorbed water. Peak observed at 390-550oC pertains to the decomposition of cellulose groups [21-23]. However, decomposition N2 adsorption analysis. Nitrogen adsorption-desorption isotherms was measured at -196oC (77K) for PFAC, CSAC, BFAC, and CAAC samples. PFAC and CSAC do not show significant adsorption isotherms (not shown here) and hence surface properties are significantly lower (Table 2). Adsorption-desorption isotherms measured for BFAC, and CAAC samples are shown in Figure 5.
Figure 2: SEM Micrographs for (a) raw fiber treated with H3PO4 (b) unwashed BFAC (c) BFAC after washing.
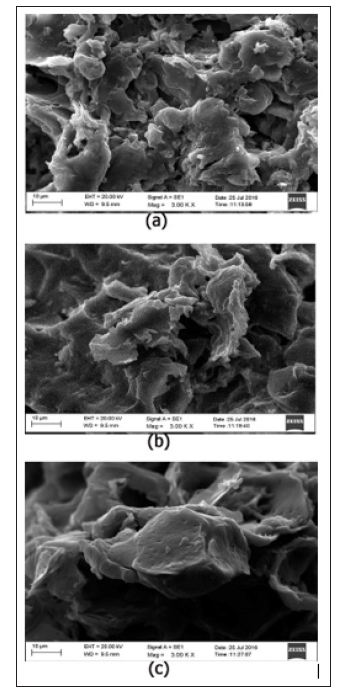
Figure 3: FTIR Spectrum for BFBC.
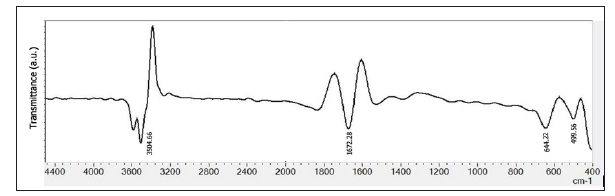
Figure 4: TG (left) and DTG (right) profiles for the PFAC, CSAC, BFAC, and CAAC samples temperature of BFAC sample has shifted to higher temperature range (400-600oC). Weight change (%) was calculated based on the decomposition peak observed in TG profile for AC samples in their corresponding temperature range. Residue percentage was also calculated for those samples at 800oC. Those results were tabulated in Table 2. It is interesting to observe that all samples are decomposed more than 90 % during the temperature range of 390-550oC and small amount of sample was left at 800oC.
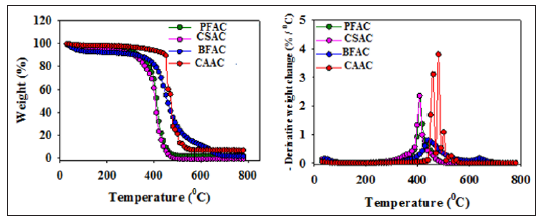
Table 2: Weight change (%) and Residue (%) calculated for PFAC, CSAC, BFAC, and CAAC samples.
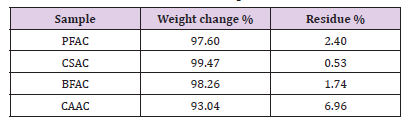
Figure 5: Nitrogen adsorption-desorption isotherm curves for BFAC and CAAC samples.
Nitrogen adsorption isotherm for the BFAC, and CAAC samples display a type I isotherm with significant amount of N2 adsorption at low relative pressure region (< 0.01) with plateau at high relative pressure region characteristic for microporous materials. However, absence of distinct hysteresis loop for these two isotherms indicate the nonexistence of mesoporous. Adsorption parameters such as the single Point Pore Volume (Vsp), Specific Surface Area (SBET), Micropores Volume (Vmi), Total Pore Volume (Vt), and Monolayer Capacity (MLC) were calculated using nitrogen adsorptiondesorption isotherms and listed in Table 3. As can be seen from the Table 3, PFAC and CSAC samples show significantly lower adsorption properties as compared with BFAC and CAAC samples. For instance, PFAC sample displays micropores volume and surface area of 0.006 cm3/g and 6 m2/g, respectively, and these values are increased to 0.16 cm3/g and 517 m2/g for BFAC sample.
Table 3: Structural parameters and adsorption values obtained for the PFAC, CSAC, BFAC, and CAAC samples.
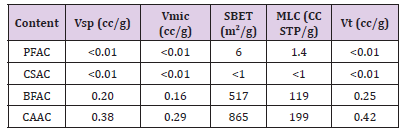
Note: Vsp-single point pore volume calculated at the relative pressure of 0.98; Vmic -volume of fine pores (micropores< 2 nm) calculated by integration of the PSD curve up to 2 nm obtained DFT method; SBET -specific surface area calculated from adsorption data in relative pressure range of 0.05-0.20; MLCmonolayer capacity; Vt–total pore volume (micropores and small mesopores below 10 nm) calculated by integration of the PSD curve up to 10 nm.
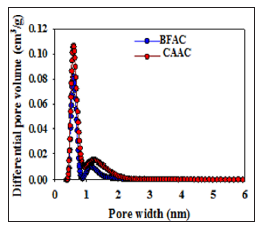
Significant N2 adsorption isotherm for the materials PFAC and CSAC could not be achieved due to its extremely low porous nature. Enlargement of surface properties was observed from BFAC sample to CAAC sample. For instance, the BFAC sample exhibits the micropore volume, total pore volume, and surface area of 0.16 cm3/g, 0.42 cm3/g, and 517 m2/g, respectively, and these values are increased to 0.29 cm3/g, 0.42 cm3/g, and 865 m2/g CAAC sample. The nitrogen uptake for CAAC is increased at low pressure region, indicating an increase in the volume of micropores as compared to BFAC sample. Density Functional Theory (DFT) software was used to calculate the pore size distributions for BFAC and CAAC. Figure 6 displays the Pore Size Distribution (PSD) curves for the BFAC and CAAC samples studied. As can be seen from the Figure 6, The PSD curve for BFAC and CAAC clearly indicate the presence of large amount of micro porosity (< 2nm) as compared with that for PFAC and CSAC samples.
Figure 6: PSD curves for BFAC and CAAC samples.
Potential of zero charge measurement. The Potential of zero charge of Beli Fruit Shell Charcoal (BFAC)was determined by a surface titration technique with an Auto titrator at room temperature. The measurements were performed with 0.05 g of BFAC dispersed in 0.1 M NaCl solution and adjusting the initial pH to 10.0 by 0.1 M NaOH followed by a titration with 0.1M HCl until the pH reaches to 2.0 . Titration was repeated for 0.01M and 0.001 M NaCl solutions. The net surface proton charge density σ for each titration was calculated by the following equation [24]:

where σ is the surface charge density, CA and CB are the equivalent acid and base added during titration; [H+] and [OH-] are the concentrations of H+ and OH- in the bulk solution; F is the Faraday constant; A is the surface area; and b is the solid concentration in grams per liter. It was found graphically in the plot of σ vs pH, that pH is 3.35 at which the net charge on the surface is zero which suggests that surface is negatively charged above pH 3.35.
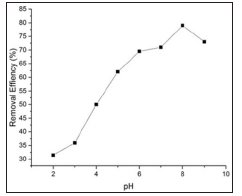
Effect of adsorbent dose. The Effect of adsorbent dose on the removal of the dye from aqueous solution was studied using an absorbent dose of BFAC 20-100 mg. Adsorbent dosage Vs methylene blue (Figure 7) removal efficiency is shown in Figure 8. It clearly shows that removal efficiency enhanced as the dose increased from 20-60mg. As the activated carbon dose increases, surface area and more available adsoption sites are increased in the solution [16]. Further increased in dose into solution did not significantly change the removal efficiency. Because all adsorption sites have been reached to an equilibrium level. Therefore, 30mg/L adsorbent dose was selected for the subsequent experiments. Effect of pH the effect of solution pH on the adsorption of dye is shown in Figure 9 for BFAC. The amount of adsorption increases when the pH increased. Higher pH was found to be favorable for maximum removal efficacy and consistent with the results obtained for surface charged measurement. The negatively charged carbon surface functional groups at pH greater than 3.35 could electrostatically interact with methylene blue cations.
Figure 7: Structure of methylene blue cation.
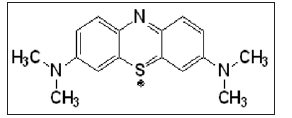
Figure 8: Effect of adsorbent dose on methylene blue removal.
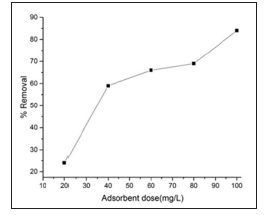
Figure 9:Dependance of removal efficency at different pH. (rpm= 700; concentration=10.5mg/l; time=30 min; temperature=27oC; volume= 50ml).
Adsorption Isotherm
Equilibrium adsorption measurements for dye. Several solutions of dye with different initial concentration (10.8 mg/L, 3.8 mg/L, 2.65 mg/L, and 1.05 mg/L) were prepared for the study of equilibrium adsorption. 50 mL of dye solution with 0.3 g (V/ m=500/3) of the BFAC were placed under stirring (700 rpm, 27oC, pH=7) for 30 minutes. The amount of adsorbed dye per unit mass of the solid (Beli powder) at equilibrium, (qe), was calculated by the following equation:

Where C0 (mg/L) is the initial concentration of dye, V (mL) the volume of dye solution and m (g) of the adsorbent mass. Ce (mg/L) is the dye concentration at equilibrium.
Kinetic Adsorption Experiments for Dye
Kinetic adsorption experiments were carried out using the initial dye concentration of 10.5 mg/L of the modified BFAC were placed under similar experimental conditions as those used in equilibrium measurements (700 rpm stirring, 27oC, pH=7). 0.5 mL of solution was withdrawn before mixing the adsorbent and dye ion solution (t=0) and at pre- determined intervals (t=2 min to t=30 minutes). The amount of adsorbed dye per unit mass of the substrate at time t, (qt), was calculated by the following equation:

where Ct (mg/L) is the concentration of dye at a given time, and other symbols have the same meaning as above.
Equilibrium Adsorption Data Analysis
Langmuir isotherm equation can be used to analyze equilibrium adsorption data. `Following assumptions were basically used in Langmuir adsorption model 1) all sites are identical and energetically equivalent 2) no lateral interactions, and 3) adsorption is limited to the formation of monolayer only.25 Based on the Langmuir model, adsorption of dye on the BFAC substrate can be expressed as;

where Kl is the Langmuir constant, Ce is the equilibrium concentration, qm and qe are the maximum and equilibrium adsorbed quantities, respectively. Experimental data were fitted to the Langmuir equation using non-linear regression to obtain the values of Kl and qm. The linear form of the above Langmuir equation can be expressed as follows:

By plotting Ce/qe verses Ce, it is possible to calculate the aforementioned qm and Kl parameters and validate the curve fitting value (R2).
Adsorption isotherm is used to calculate the theoretical adsorption capacity for a given adsorbent. The Langmuir and Freundlich isotherm models used for this work are the common models that are applied for liquid phase applications [18,26].
Normally organic or heavy metal substance is bound onto activated carbon surface by physisorption or chemisorption. The concentration of adsorbate remaining in the effluent at the equilibrium depends on the type of activated carbon. Figure 10 display the nonlinear Langmuir regression curve.
Figure 10: Adsorption isotherms for Methylene Blue on BFAC.
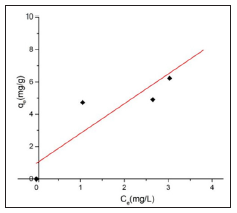
Figures 11 & 12 show the Langmuir and Freundlich adsorption models for BFAC respectively. Data of Langmuir and Freundlich isotherm parameters for adsorption of MB on carbon samples clearly show that all the chemically prepared activated carbon showed higher regression coefficient value in the Langmuir isotherm compared to Freundlich isotherm (Table 4). But activated carbon was best fitted to Langmuir isotherm with the highest regression coefficient (R2=0.91663) (Table 4).
Figure 11: Adsorption isotherms for Methylene Blue on BFAC.
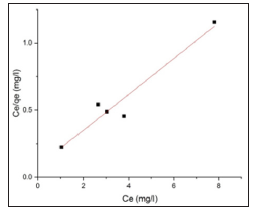
Figure 12: Freundlich plots for the adsorption of MB dye on BFAC
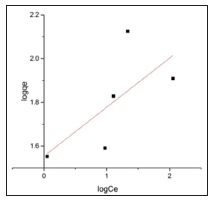
Table 4: Regression coefficients values determined for Langmuir and Freundlich models.

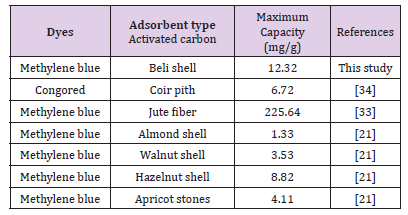
The Langmuir maximum monolayer capacity value achieved in this study was compared with other results reported in the literature (Table 5). As can be seen from Table 5, activated carbon produced from Beli-shell show significantly higher MB adsorption. It adsorbed 12.32 mg of MB per gram of activated carbon (produced from Beli-shell) which is comparably higher than that of values reported in literature.
Table 5: Comparison of Maximum mono layer capacity of MB dye onto different activated carbon samples.
Adsorption Kinetics
Models used to Analyze Adsorption Kinetics Data: Adsorption kinetics data were fitted and analyzed by using two most popular models. The first order adsorption kinetics model proposed by Lagergren27and developed by Krishnan [28] described as follows:

Where qe and qt are the amount of adsorbed metal ions at the equilibrium and time t, respectively. K1 is the rate constant of the first order adsorption reaction. Integration of the above equation at time=0 and time=t gives:

Plotting log(qe-qt) verses t can be used to find K1. The pseudo second order kinetic model suggested by Ho and Mckay29 can be stated by following equation:

Where K2 is the pseudo second order rate constant of adsorption (g mg-1 min-1). The integrated linear form of the above equation is:

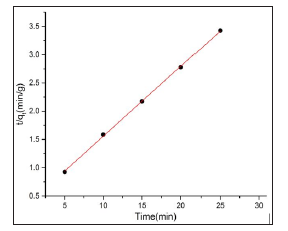
K2 and qe can be easily found from the slope and intercept of the plot t/q1 verses t.
Adsorption Kinetics Data Analysis
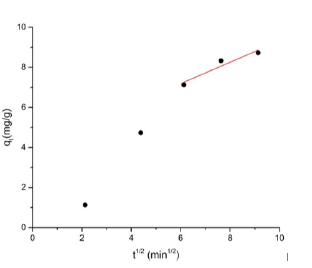
The study of the adsorption kinetics is important to evaluate the mechanism and efficiency of effluents adsorption method [30]. The kinetics of adsorption of MB by BFAC were analyzed using pseudo-first-order pseudo-second -order kinetic models and intraparticle diffusion (Figures 13- 15). It was revealed that the adsorption of BFAC was best fitted to pseudo-second –order kinetic model as indicated by the R2 value of 0.99901 (Figure 14) compared to pseudo-first –order kinetic models (R2=0.987147 ). The confirmation of pseudo-second –order kinetic models suggest that adsorption of MB on BFAC is due to chemisorption.24 Pseudosecond- order model rate constant for BFAC was calculated to be 0.12284 min-1 at 30oC. The chemisorption process involved a sharing electron between MB and the surface of activated carbon. Although it might be followed by the supplementary layer of physically adsorbed dye molecules, it is controlled to just one of dye molecule on the surface in chemisorption. Similar adsorption kinetics have been obtained from adsorption of MB by different low-cost precursor [31-33].
Figure 13: Pseudo-first-order kinetics model plots for the adsorption of MB dye on BFAC: ( pH=7 rpm=700 concentration=8mg/l time=30 min temperature=27oC, volume= 50ml).
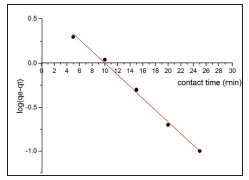
Figure 14: Pseudo- second- order kinetics model plots for the adsorption of MB dye on Beli activated carbon:( pH=7 rpm=700 concentration=10.5 mg/l time =30 min temperature=27oC, volume= 50ml).
Adsorption process related the transport of carbon matter from the bulk solution to the interior surface of the pore, rate of adsorption control by solution stirrer parameter such as speed, contact time etc.
Intra-particle diffusion for dye determined using the following equation
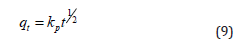
Where kp is the intraparticle diffusion rate constant. The plot (Figure 15) clearly consists of two main portions, which is initial portion and the linear portion. But the linear portion of the curve reviles intraparticle diffusion. All adsorption process is controlled by Intra-particle diffusion. According to calculation of this system intraparticle diffusion rate is 0.3333 mg/g min1/2.
Figure 15: Inter particle diffusion rate kinetics plots for the adsorption of MB dye on BFAC: pH=7 rpm=700 concentration=10.5 mg/l time=30 mn temperature=27oC, volume= 50 ml).
Conclusion
The present study shows that the biobent beli shell activated carbon can be remarkably used as an adsorbent for the removal of methylene blue from textiles effluents. The kinetic data were well fitted by second order kinetics model .the equilibrium dye uptake (mg/g) was found to decrease with increase in BFAC entering biosorption process was found to be surface controlled. Best fit of isotherm data in Langmuir model relation confirm the monolayer sorption of MB on BFAC.