Wednesday, January 5, 2022

Autism Prevalence in New Jersey Correlates with Low Sulfate in Tap Water

Autism Prevalence in New Jersey Correlates with Low Sulfate in Tap Water

Introduction

Autism Spectrum Disorders (ASD) affect social interaction, communication, behavior and the senses. As of 2016, the prevalence was 1 in 54 for the full United States based on data from the Centers for Disease Control and Prevention (CDC). Prevalence in the state of New Jersey was even stronger at 1 in 32, giving New Jersey the highest rate of autism in the country [1]. It is not well understood why this should be true. Reported reasons mention New Jersey’s reputation for good diagnostic services along with a population characterized by high risk factors, including advanced maternal age, elevated premature rates and low birth weights [2]. It is the purpose of our study to introduce another factor, sulfate deficiency during pregnancy and infancy. Toward this end, we calculate sulfate concentrations in local tap water using the New Jersey Drinking Water Watch database. We determine the sulfate content of private well water using Geological Survey Reports and the New Jersey Private Well Water Testing Program. Then, we compare this data with autism prevalence rates for the birth year 2006 from the New Jersey Autism Registry, seeking the strength of correlation. A strong correlation would suggest that ingested sulfate may be a significant factor in the distribution of autism throughout New Jersey. If the correlation is also inverse and sulfate can be shown to be essential for brain development, it would suggest that increasing the sulfate from food and water may reduce the incidence of autism in New Jersey and elsewhere.

Our focus is sulfate, based on our previous study of mothers of children with autism [3]. In that study, 86 mothers were recruited on Facebook and asked to sample the tap water consumed during their pregnancy, which we later analyzed for sulfate. They provided estimates of the types and amounts of tap water, bottled water and beverages they drank while pregnant. Based on US Department of Education public funding records, ASD prevalence rates were calculated for every state. On average, mothers from states with high prevalence submitted tap water with sulfate concentrations measuring much less than from states with low prevalence (28% sulfate, n=45, p=0.059). Considering both water and beverages, daily consumption of sulfate was compared to estimates of autism severity. Linear regression revealed a mild, but clear, inverse correlation between sulfate and severity (correlation r=-0.32, n=86, p<0.01). These results suggest that sulfate may be helpful in reducing both the incidence and severity of autism throughout the United States. And this led to the present investigation of New Jersey, which publishes a wealth of information on autism and public water.

New Jersey Autism Registry

In 2009, New Jersey created the Autism Registry to better serve the needs of children with autism and their families [2]. All children up to 21 years of age, diagnosed with autism and living in New Jersey are required to be registered. Once registered, families are linked to Case Management Services to provide guidance, resources and support. As of the year 2020, over 32,000 children had been included, making this registry the largest in the country. The Autism Registry provides data to the New Jersey Department of Health, enabling a better understanding of ASD [2]. In particular, a graphic is available on their website which presents a map of New Jersey with counties color coded to show relative prevalence. A similar graphic is presented in Figure 1 derived from the New Jersey data. The map strategy focuses on eight-year-old children born in 2006 to best represent a meaningful comparison between counties. New Jersey’s 21 counties are grouped into 5 prevalence ranges which we designate as Zones 1 through 5. Zone 1 includes counties with the lowest prevalence while Zone 5 includes counties with the highest rates of autism. Table 1 tabulates autism prevalence by zone, rate and county, matching that presented graphically in Figure 1. These prevalence rates were obtained from the NJ Autism Registry and are somewhat lower than CDC estimates. This simply reflects a difference in data collection criteria. In our study, we use the NJ Registry percentages to group counties into zones. The populations shown are from the 2010 census to better reflect the 2006 birth year. Throughout our report, we refer to all municipalities as towns, whether or not they are legally incorporated as towns, cities, townships, boroughs, or villages.
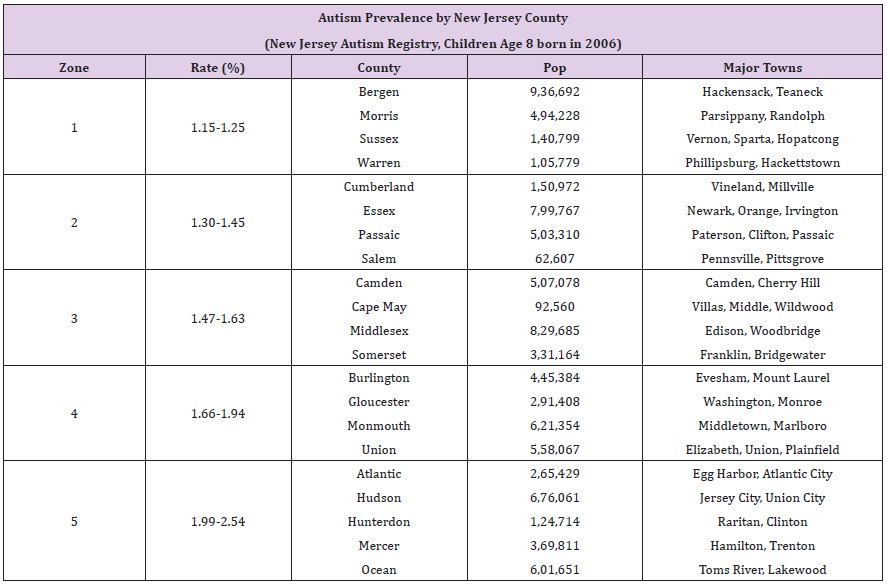
Table 1: Autism Prevalence in New Jersey for Birth Year 2006.
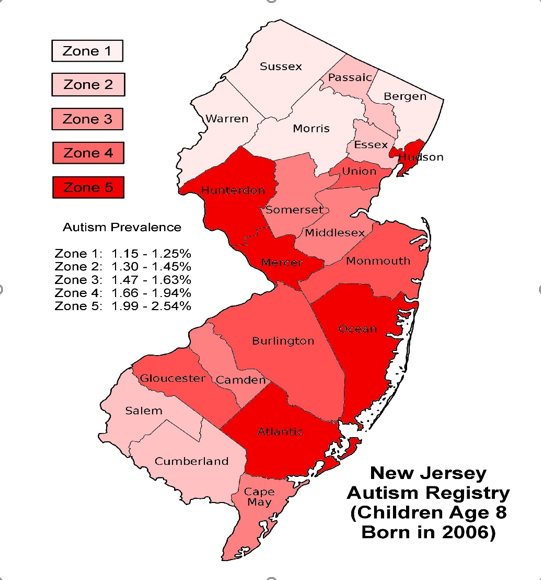
Figure 1: Distribution of Autism in New Jersey for Birth Year 2006.

Public Tap Water

Approximately 87% of New Jersey households are connected to public water systems [4]. There are over 600 such systems in New Jersey and they publish Consumer Confidence Reports (CCR) every year, most available online. Since we are interested in the sulfate concentrations of such water, it would seem these reports would be an invaluable resource. However, sulfate is not considered a serious contaminant and most CCR reports do not include such data. When sulfate is included, it is usually reported as a maximum value at the highest of all system test points. Since our study is more concerned with average values, isolated maximums are not very helpful. In a more general sense, CCR water quality reports do provide a valuable overview of water systems and can offer insight into systems that rely on multiple water sources. This typically occurs when a community buys surface water to supplement local wells. For detailed data on sulfate, the Drinking Water Watch database is a better resource [5]. It is available on the website of the New Jersey Department of Environmental Protection under the heading of the Division of Water Supply and Geoscience. The Drinking Water Watch main page allows one to enter the Public Water System Identification Number (PWSID) of any water source in the state. The PWSID is a seven digit number preceded by the letters NJ for New Jersey. For instance, the Atlantic City PWSID is NJ0102001 and when accessed, the database returns an Atlantic City index page with resource tabs and the following information: source water type is primarily surface water and the population served is 39,415. Using Atlantic City as an example, a better understanding of the water system can be obtained by clicking the Water Watch index tab System Facilities, then All Facilities. The resulting page describes the system in terms of treatment plant test points (TP) which may monitor any of the following: surface water inputs (IN), well lines (WL), interconnection columns (CC) and the distribution system (DS). For Atlantic City, there is 1 surface water intake and 15 well lines, all monitored by TP001005. To obtain sulfate test data, click the index tab Chemical Results, then By Contaminant Name and choose Sulfate from a list of nearly 200 chemicals. For TP001005, sulfate test info is presented twice yearly for the last 26 years. This is a convenient result since only TP001005 need be considered. In the more general case, 16 different test points may have resulted and data may have been reported less regularly.

Private Well Water

For the 13% of New Jersey households connected to private wells, other sources of information are required. To obtain an estimate of typical sulfate concentrations for wells, we access Geological Survey well reports from the NJ Department of Environmental Protection. In particular, we use GSR 19 for Northern Coastal Plain wells, GSR 35 for the Newark Basin and GSR 39 for the Highlands, Valley & Ridge regions [6]. For counties not included in these reports, we use the Drinking Water Watch database to search small water systems exclusively using wells. From these sources, a sulfate concentration average for wells in each county can be calculated. For instance, Bergen county data was collected from 15 wells included in GSR 35 covering the Newark Basin. The resulting mean sulfate concentration was 35.3mg/L with a standard deviation of +10.3mg/L.

There are approximately 1,143,000 New Jersey residents served by about 400,000 private wells across the state. To estimate the number of private wells per county, we relied on the Private Well Testing Act Program, which requires all property sold in New Jersey since 2002 to file well information [7]. Knowing the number of wells sold in each county allows for the calculation of percentages of New Jersey state totals. Continuing with Bergen county as an example, as of 2014, there have been 2,195 Bergen well properties sold out of 86,765 for the entire state of New Jersey. The Bergen percentage is then 2.53%, indicating approximately 28,918 Bergen residents have access to private well water. Of course, this analysis assumes that private well sales uniformly reflect the underlying inventory of property across the state.

Methods

This study’s most challenging task was the determination of sulfate concentrations in tap water for all of New Jersey, which includes over 600 water systems in 21 counties and 565 towns. As discussed in the Introduction, we obtained information from the Water Watch database, CCR and GSR reports along with the Private Well Testing Act Program. To organize data collection, we created 21 spreadsheets, one for each county. Then using Wikipedia, a list of towns in order of population was generated for each county spreadsheet. Where possible, towns were associated with one or more PWSID water systems and the number of residents served by each was noted. A simplified spreadsheet layout is presented in Table 2 displaying data from Passaic County. Complete spreadsheets for all 21 counties are included in the Supplementary Materials. For the paragraphs that follow, key spreadsheet columns are italicized and the fields are described.

Typically for a single Community System, the Town Population would be larger than the number of residents served by a water system, which we label the System Population. For instance, a town may be served by more than a single water system or split between several sources, such as purchased surface water and local wells. To account for such variations, we include the spreadsheet fields labeled Percent (%) and Users, to identify the number of people receiving a particular source of water. In a simple system serving just one town, Users would likely represent 100% of the System Population.

The sample spreadsheet in Table 2, continues with a Tpoint field for the treatment plant test point that monitors sulfate levels. If the Tpoint is without parentheses, the referenced system has just one test point or a single point that is a good representative of a group. If the Tpoint is enclosed in parentheses, there are several test points to be considered, typically described by spreadsheet notes. Most commonly, several points must be averaged to account for data from several wells. Notice that a simple average assumes the flowrates are approximately the same for all wells. This may or may not be entirely accurate, but there is no practical way to obtain a better estimate.
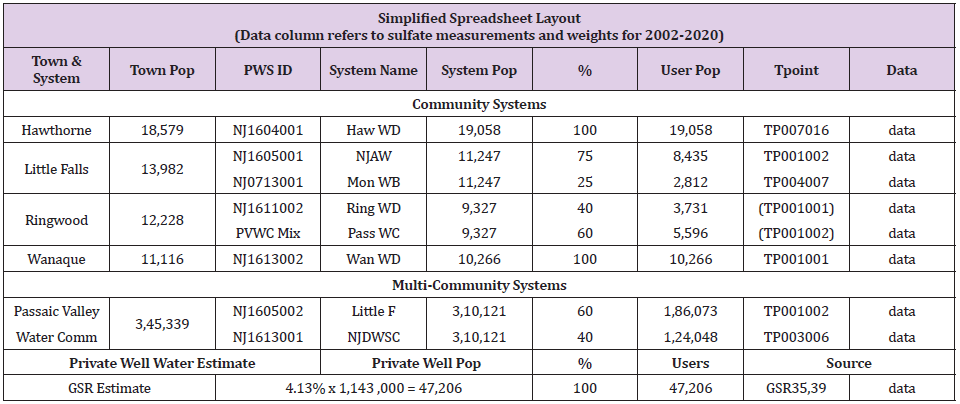
Table 2: Simplified Spreadsheet Layout (Passaic County Data).

Finally, seven Data fields contain sulfate measurements (in units of mg/L) for the years 2002, 2005, 2008, 2011, 2014, 2017 and 2020. Only major systems report sulfate data every year, while most systems usually skip years with a 3 year interval being the most common. Each measurement field is paired with a Weight field, where sulfate concentration is multiplied by the number of Users for that spreadsheet row. When the Weights for all towns are summed and then divided by the total number of Users in the county, a population weighted mean results. This is the sulfate concentration for a typical resident.

Very large systems are included by adding spreadsheet rows for Multi-Community Systems. The Western System owned by New Jersey American Water (NJAW) is an example, providing water to 264,586 residents of 35 towns in Burlington and Camden counties. To determine the allocation of water to each county, we calculate percentages of the populations served in any county to that served by all counties of concern. Then we apply these Percentages to the System Population to obtain the User Population for a given county. Like single towns, these large systems can be characterized by multiple sources of water, each with its unique PWSID. In some cases, it is necessary to break down the system into sub-systems with differing mixtures of water. A good example of this is the NJAW Short Hills System, which serves 217,230 residents of Essex, Morris, Somerset and Union counties, fragmenting into no less than 9 sub-systems.

Private wells are included by adding a single row called Private Well Water Estimate at the bottom of the spreadsheet. For this row, the average sulfate level determined from either Geological Survey Reports or the Water Watch database is entered as a constant value for all years. The Private Well Population is taken from a calculation derived from the Private Well Testing Act Program as previously described. For most counties, the Percentage (which can limit the number of private well Users) is set to 100%. When the sum of all Users in the county exceeds the total county population, Percentage is reduced to prevent a population overflow. It may seem arbitrary to limit the influence of private wells, but well properties may be connected to both wells and public water. In such a situation, one might suspect that the public system is the more likely source for drinking water, reducing the impact of well water for our purposes.

Statistical Analyses

We examine sulfate levels in New Jersey counties and compare against autism prevalence for children born in 2006. County data is reported as the population weighted mean of sulfate concentrations in mg/L. For prevalence zones which aggregate county data, both simple means and population weighted means are considered. All collected data was stored in an Open Office spreadsheet version 4.1.5 by Apache Software. Statistical calculations were performed by the functions AVERAGE, MEDIAN, STDEV, VAR, TTEST, CORREL and FORECAST. Linear regression lines, Pearson correlation coefficients and null hypothesis probabilities are presented throughout the paper. Graphs were created manually within the Open Office word processor.

In addition to the statistical quality of the data, several issues may affect this analysis. The Autism Registry reports prevalence for eight-year-old children in their county of residence. For families that have moved, this may not match their birthplace. Also, tap water represents available sulfate, not necessarily sulfate actually ingested by the mother or infant. It is quite common in today’s world to replace some tap water with bottled water. And sulfate from other sources, such as beverages and food, are not considered. Hopefully, such factors are reasonably uniform across counties, making comparisons appropriate. A strong correlation between sulfate and autism is suggestive of a causative relationship but not sufficient to prove it. Such proof must arise from independent evidence showing sulfate to be directly involved and capable of causation. This issue is examined in the Discussion with reference to published medical literature, detailing dysfunctional sulfur metabolism within autism and the consequences of sulfate restriction.

Results

Sulfate measurements from water systems in the Water Watch database form the basis of spreadsheets for the 21 counties of New Jersey. The results are summarized by prevalence zone, county and year in Table 3. Per the New Jersey Autism Registry, Zone 1 counties have the lowest prevalence of autism for the birth year 2006. Each yearly estimate of sulfate is the weighted mean of measurements of tap water for all towns within a county with populations typically exceeding 1% of the county population. For any given town, sulfate reporting may be from a single test point or the average of many points. And the measurement frequency ranges from once every 3 years to several samples per year. As such, these results are informed estimates rather than samples from a uniform data set.

To examine the correlation between autism prevalence and tap water sulfate, linear regression analysis is applied to this data. The years 2005 and 2008 are chosen to best represent the drinking water available to mothers during pregnancy and to children during early infancy for the birth year 2006. Two regressions are considered, simple means and population weighted means as shown in Table 4. For simple means, there are 42 data points, one for each of 21 counties in years 2005 and 2008. This highlights how well each county fits into the 5 prevalence groupings. The results show a mild inverse correlation of r=-0.32 for the data set of n=42. The null probability that such a relationship is a fluke of pure chance is estimated at p<0.03, meaning less than 3%. Looking at the data more closely, the four counties Cumberland, Cape May, Hunterdon and Mercer seem to be somewhat out of step with the full group, which lowers the correlation to mild.
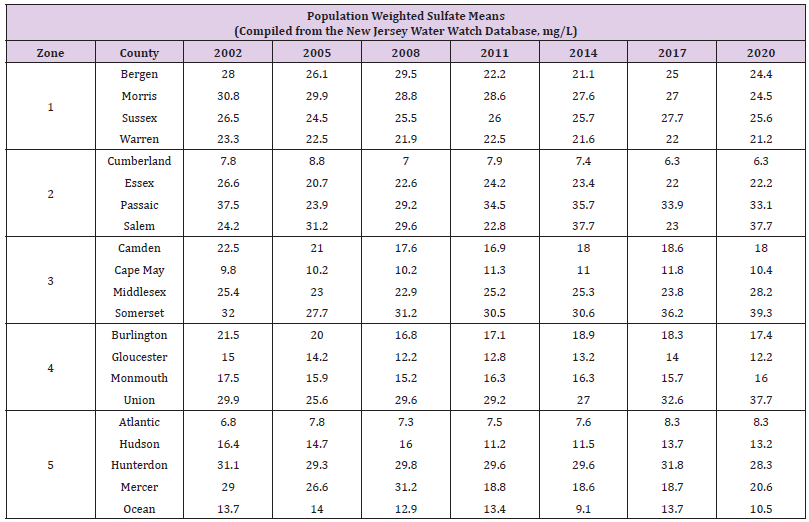
Table 3: Population Weighted Sulfate Means by Year.
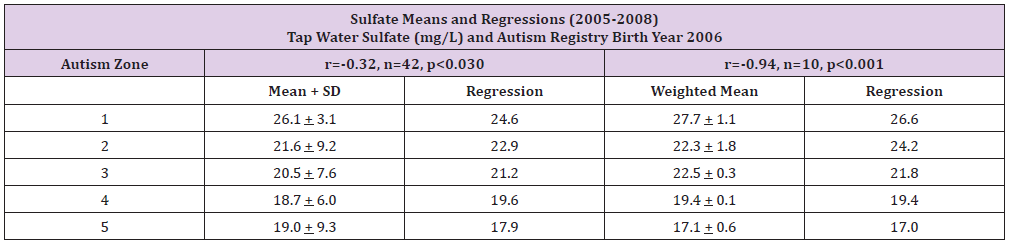
Table 4: Sulfate Means and Linear Regressions (2005-2008).

The second regression examines population weighted means. So, counties with larger populations would have more influence on the weighted means. This better represents the average level of sulfate of typical residents in each prevalence zone. The number of data points for this set is reduced to n=10, a weighted mean for each of the 5 prevalence zones in years 2005 and 2008. The results show a strong inverse correlation of r=-0.94 with a null probability of p<0.001, a very low 0.1%. That is a surprisingly strong correlation between local tap water and the presentation of autism.

Results in Graphical Form

The results are best visualized with the help of line graphs. To illustrate the data in Table 3, sulfate means for prevalence zones are plotted for each 3 year period from 2002 through 2020. Figure 2 presents simple sulfate means. Figure 3 shows population weighted means, to better represent the tap water available to typical residents of a zone. These graphs demonstrate significant separation between zones for most years. Focusing on the years 2005 through 2008, to highlight maternal pregnancy and early infancy for children born in 2006, a cleaner view of sulfate means may be presented. Simple sulfate means (Mean) and population weighted means (W Mean) are shown in Figure 4. For this figure, sulfate means are plotted against each of the 5 prevalence zones. A linear regression of this data is shown in Figure 5, within a standard deviation envelope. As expected, the curves depict a general decline in available sulfate as prevalence increases.
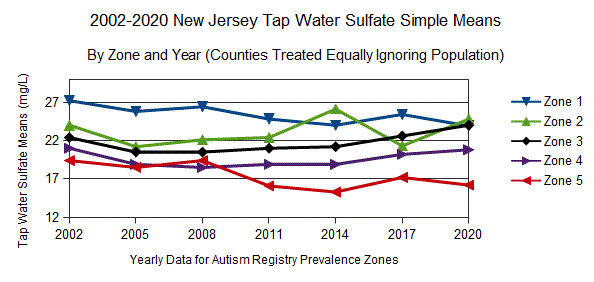
Figure 2: Sulfate in Tap Water Reported as Simple Means.
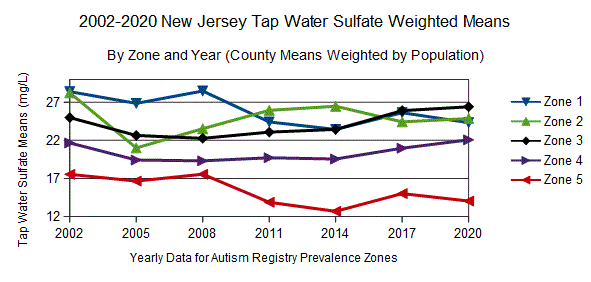
Figure 3: Sulfate in Tap Water Reported as Weighted Means.
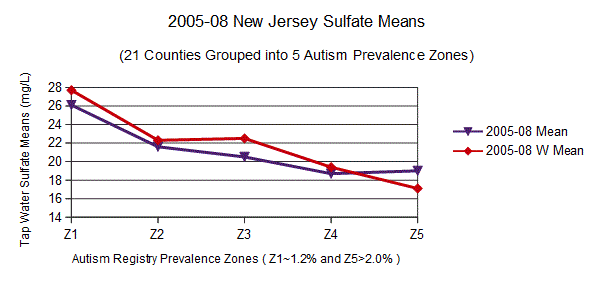
Figure 4: New Jersey Sulfate Means for Years 2005-2008.
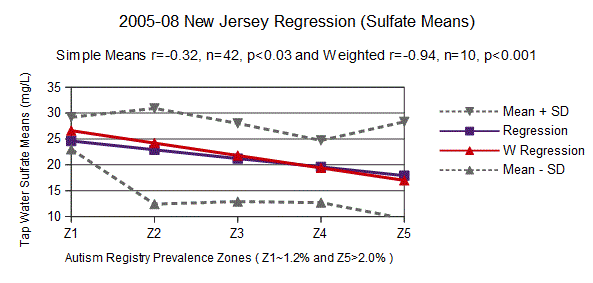
Figure 5: New Jersey Sulfate Regression for Years 2005-2008.

Discussion

Why is sulfate important for autism? One characteristic of autism is dysfunctional sulfur metabolism. In particular, the oxides of sulfur are implicated: sulfur dioxide, sulfite and sulfate (SO2, SO32- and SO42-). Sulfate may be ingested directly or it may be produced as an end product of the transsulfuration pathway. In this pathway, the amino acid methionine contributes sulfur dioxide and sulfite which is finally oxidized by sulfite oxidase enzyme to become sulfate. An English study reports the urine of those with autism contains 50 times the sulfite and double the sulfate of neurotypicals [8]. In an Arizona study that investigated blood sulfate levels, free sulfate was 35% and total sulfate was 72% of non-autistic individuals [9]. In addition, a French study of nasal stem cells found decreased expression of either the molybdenum cofactor sulfurase or aldehyde oxidase genes (MOCOS or AOX) in 91% of a small group (n=11/12) of autistic participants [10]. Both of these genes are part of the molybdenum cofactor pathway, responsible for sulfite oxidase enzyme, among several others. Impaired sulfite oxidase production results in an increase of sulfite as noted above.

Sulfate is a common nutrient and functions in a variety of chemical processes including the development of tissue structure for important organs. During human pregnancy, maternal circulating sulfate levels double during the final trimester. This highlights the importance of sulfate in fetal development [11]. In particular, heparan sulfate is essential for neuron regulation. In studies of mice with compromised heparan sulfate synthesis, symptoms similar to those found in autism resulted, including impairments in social interaction, expression of repetitive behavior and difficulties with vocalization [12]. In humans, the examination of postmortem brain tissue in young individuals showed reduced levels of heparan sulfate for those with autism vs neurotypicals [13]. Finally, sulfate supports sulfonation and sulfotransferase enzymes which help to remove xenobiotics and certain drugs. Through a sulfonate intermediary, sulfate is attached to unwanted chemicals increasing water solubility to facilitate removal [14]. Without sufficient sulfate, developing children may be at heightened risk from environmental toxins.

The working assumption underlying our study is sulfate deficiency coupled with genetic mutations involved with sulfur metabolism are significant risks which may lead to autism. Our results show sulfate in tap water to be strongly correlated (r=-0.94) to the prevalence of autism in New Jersey. Of course, tap water is just a surrogate for all sources of sulfate in the diet of mothers and infants. Water only becomes important when dietary sulfate in food and beverages is restricted and the natural metabolism of methionine falls short. In our study, mean tap water sulfate concentrations differ by a slim 10mg/L between high and low prevalence zones. Such a small difference is probably just the tip of the iceberg. There are clues of this nature in the medical literature. In Waring’s English study 20 years ago, urine was analyzed for those with autism and compared against neurotypicals. The results showed autistic urine to contain 6800μM sulfate compared to a normal reading of 3000. Assuming daily urine discharge at 1.4 liters, the extra sulfate in urine for those with autism was 510mg per day. This suggests that tissue in those with autism may be starved for sulfate. And this assumption is confirmed by Adam’s 2011 Arizona study showing blood levels are below normal, only 35% in the case of free sulfate. Perhaps increasing sulfate consumption by even a fraction of 510mg per day could lower the prevalence of autism in New Jersey.

As noted previously, many factors seem to influence the development of autism, including awareness, medical access, maternal age, prematurity and birth weight. The influence of sulfate must be balanced with these other risk factors. Looking closely at the sulfate results in Table 3, four counties appear to be out of step with the majority: Cumberland, Cape May, Hunterdon and Mercer. For these counties, the influence of sulfate is less important than something else. What might that be? An interesting candidate is wealth as measured by median household income. Hunterdon county has the highest median household income in New Jersey at $100,980 [15]. In fact, Hunterdon is often rated among the wealthiest in the United States. Cumberland reports the lowest income in New Jersey at $50,651. Cape May borders Cumberland and has the second lowest household income in the state. Both have very low levels of sulfate in tap water, yet are in the mid-range for autism prevalence. On the other hand, Hunterdon is bordered by Mercer county and both have higher than average sulfate in water, yet are in the highest prevalence zone. As a possible explanation, consider that higher income elevates autism awareness, quality of medical care and pressure toward delayed maternal age. So even in the presence of higher sulfate, these factors might push Hunterdon and Mercer toward additional cases of autism. Likewise, the low income of Cumberland and Cape May, could reduce the diagnosis of autism by lowering autism awareness, quality of care and age of motherhood.

It’s interesting to examine how New Jersey tap water compares to the rest of the United States. The Environmental Protection Agency (EPA) estimates that the national median sulfate concentration of all public water systems is 24mg/L [16]. The range is near zero to over 600mg/L, suggesting the average would be much higher than the 24mg/L median. The New Jersey average for the last 20 years has been about 21mg/L sulfate. This may help to explain why New Jersey has such a high rate of autism compared to other states. A revealing graphic is presented in Figure 6 showing average sulfate levels in the four most populous New Jersey towns relative to the dotted median for the full country. The Passaic Valley Water Commission (Little Falls and Wanaque Systems) serves the towns of Patterson, Clifton and Passaic. The sulfate concentration of this water is high by New Jersey standards, typically above 40mg/L. On the other hand, Newark (Pequannock and Wanaque Systems) provides water with very little sulfate, typically around 10mg/L. And Jersey City and Elizabeth have low sulfate water similar to Newark. It is important to note that these numbers are for tap water but many households prefer even cleaner water with less sulfate. New Jersey publishes State Health Assessment Data from family surveys which include comments about drinking water habits. In 2013, only 20% of families drank unfiltered tap water while 37% used filtered tap water and 40% preferred bottled water [17]. Note that this data was published before the lead crisis in Newark that certainly must have pushed the percentage for bottled water even higher.
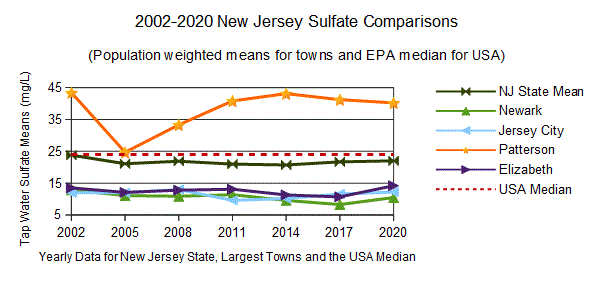
Figure 6: Sulfate Comparisons for Largest New Jersey Towns.

Bottled water is an interesting modern phenomenon, rare 70 years ago when autism was virtually unknown but very common in today’s world. Most bottled water is simply purified local tap water with sulfate and most other minerals completely removed. This is true of Aquafina, Smart Water, Sam’s Choice and most supermarket brands. Sparkletts bottled and/or delivered water measures about 3mg/L. And even Poland Spring, a popular spring water from Maine, has a sulfate concentration of just 5mg/L. (This data is from published water quality reports for these brands or our own tests using a Hanna Instruments Model HI 96751C digital photometer.) Again looking at Figure 6, if Passaic Valley customers reject their tap water and drink 2 liters of purified water instead, they give up 80mg of sulfate every day, perhaps increasing their risk of autism. Bottled water is not the only factor that has reduced sulfate in the modern world. Since the enactment of the Clean Water Act of 1972, the EPA has been tasked with cleaning up public water in all of the United States. Clearly, this is good for the country as it minimizes the microbes and toxins that pose health hazards. Of course, water that has been cleaned to contain fewer contaminates will naturally contain less sulfate. The reduced sulfate content of some tap water and most purified bottled water may be important to our understanding of autism.

Conclusion

Using sulfate in tap water as an indicator for dietary sulfate, we compare the county by county distribution of sulfate in water to the prevalence of autism. We use published prevalence rates from the Autism Registry for the birth year 2006. Then we calculate sulfate concentrations for over 600 water systems as cataloged in the New Jersey Water Watch database. Concentrating on the years 2005- 2008 to represent maternal pregnancy and child development through infancy, we compare the sulfate means for water against autism prevalence in all 21 New Jersey counties. The resulting correlation of a linear regression analysis shows a significant, although mild, relationship between sulfate and autism prevalence. When the simple sulfate means are adjusted to population weighted means to better represent the sulfate available to a typical family, the correlation becomes very strong (correlation r=-0.94, n=10, p<0.001). This is a surprisingly robust indicator even though other factors may likewise contribute to the development of autism. Based on our results, it may be possible to significantly reduce the incidence of autism by supplementing with sulfate rich food and water during pregnancy and early childhood. Examining New Jersey data, increasing sulfate concentrations in tap water by as little as 10mg/L may reduce autism prevalence by meaningful margins. The medical literature shows sulfate to be a necessary nutrient, important for organ development, brain function and toxin removal. In those with autism, blood sulfate concentrations are well below neurotypical levels. Our previous Facebook study correlated autism severity with low sulfate in beverages consumed during pregnancy. Our current study documents a strong correlation between autism prevalence in New Jersey and low sulfate in local tap water. These are very hopeful clues to autism prevention that warrant further investigation.

Declarations

Funding and Conflicts of Interest

This work was funded by Rybett Controls, Inc. The author is both an officer and shareholder of Rybett Controls. He donated his time to this project, receiving no compensation for his involvement. The author has some mild characteristics of autism which has led to his interest in this subject. Interestingly, he was born in Long Beach, California long before the advent of purified, bottled water and where sulfate in tap water is in the 48 to 124mg/L range. He is an electrical engineer with degrees from Caltech. Rybett Controls has no products related to autism except an Amazon book titled Autism, Enzymes and the Brimstone Demons [18]. The research published in this book laid the ground work for the sulfate study described by this paper. The book includes an economical recipe for sulfated water which we whimsically call Brimstone Water. For legal protection, Rybett Controls owns the trademark for Brimstone Water although the recipe is unprotected and freely available for all to use. Neither Rybett Controls nor the author have patents, commercial affiliations or business interests relating to autism and declare no conflicts of interest with this research study other than the book and trademark.

Availability of Data and Material

The Supplementary Material for this article includes a master spreadsheet with sub-sheets that calculate sulfate levels for all 21 New Jersey counties plus a summary. To obtain this spreadsheet, simply send a reasonable request to the author via email ( rybett@ aol.com ). The primary data sets analyzed by this study (Autism Registry prevalence, Water Watch test results, New Jersey GSR reports) are located on the web under References.

Author Contributions and Acknowledgment

All work within this study was performed by the author. The author would like to thank the New Jersey Autism Registry for publishing county by county prevalence rates on their website. Also, the New Jersey Department of Environmental Protection should be congratulated for their user friendly Water Watch database software.

Ethics Approval

The information used in the study was from data sets in which all relevant personally identifiable information had been removed. Prevalence was aggregated by the New Jersey Autism Registry at the county level and published on their website. Therefore, this project did not require institutional review for research with human subjects nor individual consents to participate. This article does not contain studies with animals or plants. 

For more Articles on : https://biomedres01.blogspot.com/


Antimicrobial Resistance: An Emerging Public Health Threat on One Health Perspectives

Antimicrobial Resistance: An Emerging Public Health Threat on One Health Perspectives

Mini Review
The emergence of multidrug-resistant (MDR) superbugs is extremely alarming. In most cases, infections arising from MDR superbugs do not respond to treatment with a few antimicrobial agents. This issue is on the verge of establishing pre- and postantimicrobial agent eras. In the latter, last-resort antibiotics will be unable to treat infections caused by Gram-positive and Gramnegative MDR bacteria [1]. The magnitude of this human health issue has been described by the World Health Organization (WHO) through the 2014 “Global Report on Antimicrobial Resistance Surveillance,” which is based on reports from 114 countries. The main findings include the high resistance to third generation cephalosporins and fluoroquinolones reported for Escherichia coli and Klebsiella pneumoniae, and the high resistance to carbapenems displayed by K. pneumoniae for both nosocomial and communityacquired infections. Similarly, high resistance to methicillin has been reported for a strain of Staphylococcus aureus [2]. The recognition of antimicrobial resistance among humans, animals, and ecosystems has led to the concept of “One Health,” a holistic term that distinguishes the important links between human, animal, and ecosystem health. As a public health issue, it involves implementing programs, policies, and research that carry out multidisciplinary work, bringing several sectors together to achieve better results. This approach englobes three essential points: understanding the mechanisms of bacterial resistance, using combined therapeutic approaches as clinical options, and discovering new antimicrobial agents [1,3].

The “One Health” approach is necessary to control and prevent infectious diseases, including emerging infections and antimicrobial resistance. This approach is crucial for antibiotic resistance because many antibiotics used in human medicine are also used in veterinary medicine and livestock production, leading to antimicrobial resistance selection. In addition, there is evidence indicating that at least some clinically relevant resistant bacteria and/or their resistance genes can be transferred between animals and humans across ecological and geographic barriers [4]. Given the dimensions of antimicrobial resistance in humananimal- ecosystem health, it seems reasonable to adopt a One Health approach to this problem. This approach includes taking steps to preserve the continuous efficacy of existing antimicrobials by eliminating their inappropriate use and limiting the spread of infection. The agriculture and veterinary sectors are particularly concerned about mass medicating animals with antimicrobials that are also used in humans, such as third generation cephalosporins and fluoroquinolones. Another concern is the use of medically important antimicrobials added to animal feed as growth promoters. These include colistin, quinolones, tetracyclines, and macrolides, and may cause the development of bacterial resistance in animals, which can be transmitted to humans directly or indirectly [5,6]. In conclusion, the concept of antimicrobial resistance and a “One Health” approach is crucial for understanding and mitigating the transmission of resistance genes among the human-animalecosystem interface. Despite significant new findings regarding antimicrobial resistance at this interface, other aspects must be explored to fully understand the origin, emergence, dissemination, and evolution of antimicrobial resistance.

For more Articles on : https://biomedres01.blogspot.com/
Cell Junctions Present in Reconstructed Human Skin Models

Cell Junctions Present in Reconstructed Human Skin Models

Introduction
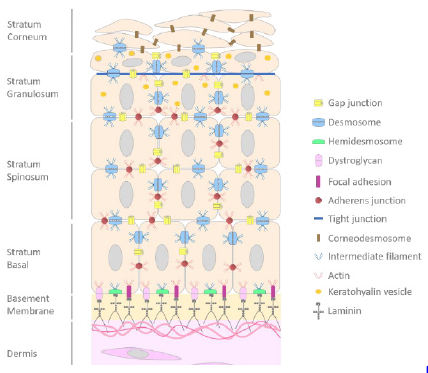
From several decades, reconstructed skin models have been developed both in the field of public research, in the cosmetics and pharmaceutical industries. All these approaches are based on the principle of isolation of primary cells, cultivation of cells in a monolayer and then specific differentiation of the tissue at the airliquid interface in order to obtain a multi-layered and specialized tissues [1,2]. Since the first experiments carried out by Rheinwald and Green in 1975 [3] on the isolation and culture of human primary keratinocytes on a monolayer of fibroblasts, techniques have evolved towards a culture of keratinocytes without a nourishing sub-layer. The technical changes were more focused on the culture media in order to obtain a tissue close to the characteristics of the in vivo skin. As a result, the epidermis is now cultivated on deepidermized dermis, inert filters or even more or less complex collagen matrices [1,4-8]. The growth and differentiation processes of the reconstructed epidermis, however, have changed little with a growth phase of keratinocytes in immersion and a differentiation phase induced with a medium concentrated in calcium ions [9,10]. These technical approaches improve the characteristics of reconstructed tissues with for example, better organization, structure, cohesion conferring them, a better integrity close to skin characteristics. The main role of the skin is to ensure a barrier function against external environmental stresses and to avoid water loss [11]. The maintenance of the skin integrity against stresses is due to the presence of numerous cutaneous junctions between cells and skin compartments [12,13]. In the skin, a stratified epithelium, from basal layer to stratum corneum we noticed the presence of focal adhesions (FA), dystroglycans and hemidesmosomes (HD) which ensure the adhesion to dermal compartment, cell-cell junction with GAP junctions, adherens junction, desmosomes then tight junctions in the granular layer and finally corneodesmosomes at the level of stratum corneum (Figure 1) [14]. The adhesion between the epidermis and the dermis is insured by a highly specialized zone called the Dermoepidermal Junction (DEJ).

Figure 1: Schematic representation of cell-cell and cell-matrix junctions.
Note: Scheme of the epidermis and its junctions from basal layer to stratum corneum. Dermoepidermal junctions are also represented.

The DEJ confers a fine-tuned architecture to the skin useful for the maintain of the skin homeostasis. The DEJ regulates cell adhesion, cell differentiation and motility, and plays an important role in the communication between the epidermis and the dermis [15]. The DEJ also influences the basal keratinocyte polarity and defines the basal surface where proliferating epidermal cells are attached [16]. The DEJ is a highly complex structure composed to hemidesmosomes, focal adhesions and dystroglycans. Hemidesmosomes are found in different tissues such as the cornea, the skin [17] allowing the maintain of these tissues. HD have important role in cell adhesion, wound healing, tissue morphology allowing the maintenance of tissue structure and integrity. HD, half of desmosome, are small structure about less than 0.5μm consisting of a tripartite plaque with an inner and outer plaque separated by a less dense zone [18]. HD consist of α6β4 integrin, plectin (P1a), tetraspanin CD151, BPAG1 (or BP230) and collagen XVII (or BP180 or BPAG2) [19].

These junctions link anchoring intermediate filaments in the epidermal compartment and fibrils on the extracellular matrix side among which the following proteins are mainly found keratins K5, K14, collagen VII and IV and other proteins like laminin 332 (laminin 5) [20]. In addition to hemidesmosomes, focal adhesions are dynamic adhesions allowing also keratinocyte junctions to the extracellular matrix through the connection of α3β1 integrin transmembrane proteins to the actin cytoskeleton and on the opposite to laminin 332 to the extracellular matrix [21]. FA are involved in different processes like cell communication, proliferation, migration, apoptosis, spreading, wound healing and differentiation. The FA is a protein complex composed about more 50 proteins divided into three groups:
i) The structural components (talin, vinculin, kindlins also named FERMT1-3)
ii) The enzymatic components (Focal Adhesion Kinase (FAK), Integrin-Linked Kinase (ILK) and Tyrosine-Protein Kinase SRC-1 (SRC))
iii) Adaptors (paxillin, P130, LIMS1…) [21-23].
The dystroglycans, another complex present in DEJ, were shown as expressed by keratinocytes and fibroblasts in human skin [24] and localized in the epidermal basement membrane. The dystroglycans allow a closed-link with the actin cytoskeleton of epidermal basal keratinocytes and with the extracellular matrix in human skin [24,25]. The integrity of the epidermis compartment is ensured by cell-cell junctions present between epidermal cells in all layers including stratum corneum. Among all junctions, GAP junctions link the cytoplasm of two cells allowing intercellular exchange of ions and small molecules [26]. This intercellular communication is important for the maintenance of skin homeostasis, including keratinocyte growth and differentiation [27], regulation in melanogenesis [28]. In fact, GAP junctions are channels assembled from connexin subunits (26, 32 and 43) belonging to connexin family about 21 members. The assembly of 6 connexins forms an oligomer called connexon, transported to the plasma membrane [29].
The connexon docks with a connexon of adjacent cell and form a GAP junction channel. These GAP junctions are regrouped into GAP junction plaque. In addition to GAP junction, desmosomes form the intercellular junctions (0.2–0.5μm in diameter) allowing the link of intermediate filaments to the plasma membrane giving a resistance to mechanical stress in the skin and other tissues [30]. The desmogleins (Dsc1-3) and desmocollins (Dsg1-4), transmembrane proteins of the desmosome, belong to the cadherin family of calcium-dependent adhesion molecules. The cytoplasmic tails of desmosomal cadherins are associated with the desmosomal plaque proteins: plakoglobin and desmoplakin belonging to the armadillo and plakin family of linker proteins respectively [31]. The tethering of cytoskeleton is insured by interaction of desmoplakins with the keratin intermediate filaments giving rise to inner dense plaque [32,33]. A third cell junction complex is adherens junctions (AJs) which have conserved plasma-membrane structures that mediate cell–cell adhesions organized into two complexes of proteins: nectin/afadin and cadherin/catenin.
The AJs form extracellular adhesive contacts between cells, and intracellular links to the actin cytoskeleton. E-cadherin and the catenin family members including p120-catenin, β-catenin, and α-catenin are the main components of AJs [34]. Two types of cadherins are expressed in the epidermis: P-cadherin expressed in the basal layer and in hair follicles, and e-cadherin in all layers of the epidermis. AJs are involved in several processes such as cytoskeletal dynamics, cell polarity, cell adhesion, cell shape, division, growth, apoptosis and barrier function [35]. At the upper layer of the epidermis, another type of junctions is present. Indeed the tight junctions are localized in the granular layer, thus ensuring the barrier function, cell polarity and preventing epidermal water loss and solutes [36]. Tight junctions are protein complexes containing more than 40 proteins that form the semi-permeable mechanical connections between cells.
The tight junctions consist of three main type of structural transmembrane proteins that are common to all tight junctions: claudins belonging to a family of 26 members, Tight Junctionassociated MARVEL proteins (TAMP) as occludin or tricellulin and junctional adhesion molecules (JAM-A, -B or -C) [37]. The tight junctions are linked to the cytoskeleton through protein adaptors called Zonula Occludens (ZO-1, -2, and -3) and MUPP1 (Multi-PDZ Domain Protein 1) forming the junctional plaque. Most of the proteins forming these junctions are found in the stratum granulosum including claudins 1, 4, 6, 7, 11, 12 and 18, occludin, ZO-1, ZO-2, MUPP-1 and cingulin [38]. And finally in the stratum corneum, composed of corneocytes responsible of the epidermis turnover and conferring a regenerating power of the skin, corneodesmosomes ensure the link to each other. Corneodesmosomes are a modified form of desmosome, indeed they are formed upon integration of corneodesmosin (CDSN) released by lamellar granules [39] during the conversion of desmosome to corneodesmosome in the stratum corneum of the epidermis [33]. CDSN glycoproteins embedded within the desmoglea (the intercellular space of desmosomes) to form the desmosomal plate [40].
Deposition of loricrin, a major component of the cornified cell envelope, begins at the desmosomal plaques in the cytoplasm of cell present in the upper layer of the stratum granulosum [39]. These junctions are degraded to allow the desquamation process by proteases as kallikreins and cysteine proteases (cathepsins) in contrast to protease inhibitors as LEKTI counterbalance to the stratum corneum formation [41]. In this article, we highlighted the presence of cell-cell junctions and cell-matrix junctions both in reconstructed epidermis and full thickness (combination of dermis and epidermis) and the integrity of the barrier function demonstrated with the penetration of lucifer dye after chemical stress (SDS).

Material and Methods

Ethical Compliance

Samples were obtained from anonymous human healthy donors. Surgical residues were harvested according to French regulation (agreement DC 2021-4617) and procurement of written informed consent from the patient.

Cell Culture of Normal Human Keratinocytes and Fibroblasts

Normal human primary epidermal keratinocytes (NHKs) were isolated from surgery (circumcision). An enzymatic digestion was used to dissociate the epidermis from the dermis indeed the biopsies were incubated in the Dispase II (Sigma, France) at 4°C overnight. Then a second enzymatic digestion was used to separate the epidermal keratinocytes with Trypsin-EDTA (Sigma, France) at 37°C for 10 minutes from epidermis cut into small pieces. The cells were centrifugated and the pellet was taken in a specific medium complemented with BPE (Gentaur, France). Cells were placed at 37°C in a humidified atmosphere containing 5% of CO2. In parallel, the dermis explant was placed in a Petri dish and incubated with DMEM with 1g/L of glucose (Lonza, Switzerland), 2mM L-glutamine (Lonza, Switzerland), Gentamycin (Euromedex, France) complemented with 20% FCS (Biowest, France). The explants were incubated at 37°C in a humidified atmosphere containing 5 % of CO2. At the appearance of fibroblasts, the dermis explant was removed and the culture medium was replaced by DMEM with 1g/L of glucose (Lonza, Switzerland), 2 mM L-glutamine (Lonza, Switzerland), Gentamycin (Euromedex, France) complemented with 10 % FCS (Biowest, France) and incubated at 37°C in a humidified atmosphere containing 5% of CO2.

Reconstruction of Epidermis

After keratinocyte isolation, the NHKs were seeded on a 0.5cm² inert polycarbonate membrane (Nunc, Thermo Fisher Scientific, USA) in a proprietary chemically-defined media and were placed at the air-liquid interface until 17 days at 37°C in a humidified atmosphere containing 5 % of CO2.

Reconstruction of Skin Equivalent (Dermis and Epidermis)

After fibroblast isolation, dermal equivalents were prepared using a neutralized solution containing bovine type I collagen (Collagen Solution, USA) diluted in complete DMEM [(1g/L of glucose, 2mM L-glutamine; Lonza, Switzerland), 10 % FCS (Biowest, France) and gentamycin (Euromedex, France)]. The mixture was dispensed onto 12-well tissue culture plates and incubated 24 hours at 37°C to allow the polymerization. After polymerization, complete DMEM medium was added to each well. Dermal equivalents were maintained at 37°C in a humidified atmosphere containing 5 % of CO2. After 4 days of contraction, the matrix was transferred in the proprietary chemically defined medium at the air-liquid interface. The NHKs were seeded on the dermal matrices and placed at 37°C under 5 % CO2. After 3 days of culture, the full thickness was placed at the air-liquid interface at 37°C in a humidified atmosphere containing 5 % of CO2.

Histology and Immunohistochemistry

For histological analysis, the reconstructed human epidermis and skin equivalent were fixed in the 10% formalin buffer (Sigma, France). After successively dehydration, the tissues were then embedded in paraffin. Paraffin section (4μm) were deposited on glass slides, deparaffinized and then successively rehydrated in xylene baths, alcohol of different percentages and water. The Hematoxylin & Eosin staining (H&E) staining was performed by placing the sections in a hematoxylin bath for 3 minutes. The sections were rinsed with water for 5 minutes at room temperature. The slides were then placed in an eosin bath for 2 minutes. The tissues were then dehydrated in successive baths of absolute alcohol and xylene. After mounting a coverslip with Eukitt* (O. Kindler), the photos were acquired with a Qimaging* Retina 2000R Fast1394 camera and processed by using the Q-Capture Pro 7 (QImaging, England) acquisition software.
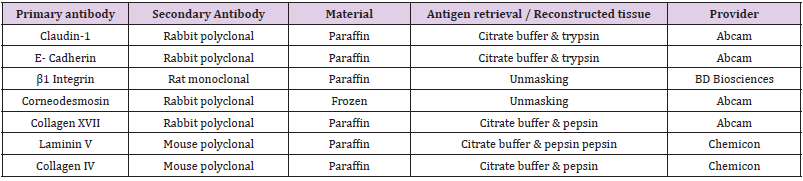
For immunohistochemistry (IHC), the reconstructed human epidermis and skin equivalent were fixed in the 10% formalin buffer (Sigma, France), then embedded in paraffin. Paraffin sections (4μm) were deposited on glass slides, deparaffinized and rehydrated with successive bath of xylene, absolute alcohol and water. The exposure of the antigens was realized by treatment of the sections with 0.01 M citrate buffer pH6 and 0.25 % pepsin or 0.05 % trypsin (Zymed, Invitrogen, Thermo Fisher Scientific, USA) for 15 minutes at 37°C. After the fixation, the saturation of nonspecific sites was performed with 5% BSA buffer (Sigma, France) for 30 minutes, primary antibody was applied at room temperature for 1 hour (Table 1). The sections were rinsed in PBS and the secondary antibody (Alexa Fluor Donkey anti-rabbit, Alexa fluor Goat anti-mouse, Alexa Fluor Goat anti-rat, (Invitrogen, Thermo Fisher Scientific, USA) was deposited at room temperature in dark for 1 hour. Finally, the slides were incubated with 0.3μM 4’,6’diamidino-2-phenylindole (DAPI, Molecular Probes, USA) for 5 minutes at room temperature in the dark and mounted with Fluoromount-G® (Electron Microscopy Sciences, USA). The photos were taken with a Qimaging EXI blue camera coupled to Volocity acquisition software (Improvision, England).

Table 1: Antibody characterics used for immunohistochemistry.

Barrier Integrity Assay

To observe the barrier integrity, a Sodium Dodecyl Sulfate (SDS) (Sigma, France) stress (concentration 0.1 to 0.75 % w/v diluted in PBS 1X) was applied topically for 3 hours. Then epidermises were rinsed 3 times with PBS 1X and then Lucifer yellow 1mM was applied topically for 2 hours to visualize the diffusion of this passive dye throughout the epidermis. Epidermises were rinsed 3 times with PBS 1X then tissues were fixed with formalin solution neutral buffer 10 % and embedded in paraffin. Paraffin sections (4μm) were deposited on glass slides, deparaffinized and rehydrated with successive bath of xylene, absolute alcohol and water. The slides were incubated with 0.3μM 4’,6’diamidino-2-phenylindole (DAPI, Molecular Probes, USA) for 5 minutes at room temperature in the dark and mounted with Fluoromount-G® (Electron Microscopy Sciences, USA). The photos were taken with a Qimaging EXI blue camera coupled to Volocity acquisition software (Improvision, England).

Results

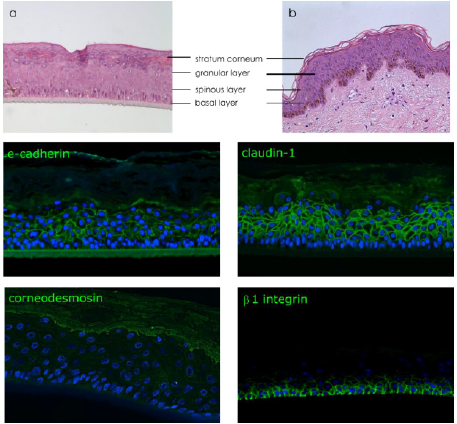
The reconstruction of cutaneous tissues such as epidermis or more complex tissue (dermis combinate with epidermis for example) is not only a layering of keratinocytes but a cellular stratification with the presence of specialized keratinocytes with specific functions and characteristics according to the corresponding epidermal layer such as basal, spinous, granular layers or stratum corneum. To investigate the integrity of the tissue due to the presence of cell junctions, immunodetections of specific proteins related to junctions were realized on these reconstructed tissues. Claudin-1 (a major protein involved in tight junction), e-cadherin (a main protein involved in cell-cell junction), b1 integrin (protein involved in cell-matrix adhesion and more specifically to collagen fiber) and corneodesmosin (a protein involved in the stratification of stratum corneum) were selected. Prior to realize immuno-detection of specific proteins, a histological observation of the human reconstructed tissue by hematoxylin and eosin (H&E) staining was performed to compare the structure of reconstructed epidermis to native human skin (Figures 2a & 2b).

Figure 2: Characterization of reconstructed human epidermis.
Note:
a) Histological observation by H&E of reconstructed human epidermis
b) Native skin.
Immunodetection of e-cadherin and claudin-1 presents in all epidermal layers, corneodesmosin localized in the upper layers (granular layer and stratum corneum) and β1 integrin expressed specifically in basal layer. Nucleus are stained in blue by DAPI.

The structure of reconstructed epidermis is similar to native skin with the presence of all differentiated layers; basal layer with columnar keratinocytes, spinous layer, granular layer with the presence of keratohyalin vesicles and finally a stratum corneum constituted of several layers of corneocytes. The detection of b1 integrin is located to the basal keratinocytes, this is in adequation with the function of b1 integrin to anchor the epidermis to the extracellular matrix at the dermoepidermal junction. The detection of both claudin-1 and e-cadherin were localized at the membrane of cells in the suprabasal layers. Detection of these proteins are less pronounced in basal layer. Corneodesmosin was expressed in the lastgranular layer of the epidermis and all layers of the stratum corneum where this protein is progressively proteolysed during corneocyte maturation and desquamation. The presence of specific proteins involved in the cohesion of epidermis seems to confirm the efficiency of barrier function of epidermis in the reconstructed tissues.
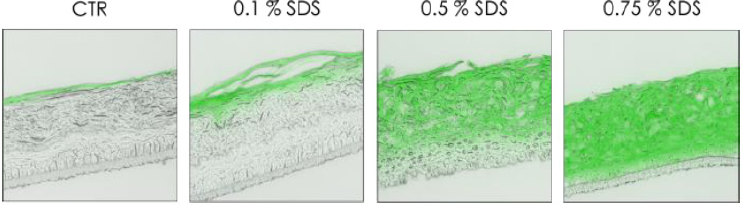
To validate this epidermal function, a passive dye was topically applied on the top of the RHE to observe the diffusion after a chemical stress by SDS at various concentrations (Figure 3). Treatment with SDS, a well know surfactant, disrupted cell junctions resulting in a deep penetration of dye Lucifer yellow inside the epidermis. This diffusion is dependent to the concentration of SDS, indeed at lowest concentration (0.1 %) the lucifer yellow was only present in the stratum corneum, and diffusion was not observed in viable cell layers. But on the opposite, at the highest tested concentration (0.75 %), lucifer yellow penetrated completely inside the reconstructed epidermis (Figure 3). After the reconstruction and the characterization of the in vitro epidermis, a more complex tissue combining dermal and epidermal compartment was studied. Prior to detect the presence of specific cell junction proteins, a histological staining by H&E was performed to compare the structure of full thickness to native skin (Figure 4).

Figure 3: Diffusion of passive dye after chemical stress (SDS).
Note: Observation of the passive diffusion of lucifer yellow applied topically (2h) after chemical stress induced by SDS (3h) at various concentration 0.1%, 0.5% and 0.75% on RHE at day 17.

Figure 4: Characterization of skin full thickness (FT) model.
Note:
a) Histological observation by H&E of in vitro FT model
b) Compared to native skin.
Immuno-detection of markers expressed in full thickness. Detection of proteins expressed in dermal epidermal junction (β1 integrin, collagen XVII, laminin 332 and collagen IV) and cell-cell junction in epidermal compartment (claudin-1 and e-cadherin).

As we observed a similar structure of reconstructed human epidermis to the epidermis of native skin, the observation of the epidermal compartment in the full thickness model is similar with the presence of all differentiated layers; basal layer with columnar keratinocytes, spinous layer, granular layer with the presence of keratohyalin vesicles and finally a stratum corneum (Figures 4a & 4b). The global structure of reconstructed tissue is similar to native skin (except for the presence of dermal papilla) but due to the early stage of reconstruction (day 10), the stratum appeared thinner than the epidermal stratum observed in RHE at day 17. Cohesion of the epidermal compartment with the dermal compartment is fully present all along the tissue. The detection of b1 integrin is localized all along the dermoepidermal junction, collagen XVII, laminin 332 and collagen IV were also expressed at the DEJ. As observed on reconstructed epidermis alone, the detection of both claudin-1 and e-cadherin are localized in the membrane of cells constituting suprabasal layers, the detection of these proteins are less pronounced in the basal layer.

Conclusion

Reconstruction of in vitro skin models from human cells is a real advantage for the research field and also it has been a revolution for toxicological studies to avoid the use of animals. These RHE are “real skin” and not only a superposition of cells which allowed the validation of these models by ECVAM (European Council of Validated Alternatives Methods) to use them for several toxicological studies such as skin irritation or corrosion (respectively OECD TG439 (2021) and 431 (2019), [42,43]). To obtain these validations, the “in vitro skin” must have similar properties to native skin and more precisely in term of barrier function. This barrier function is ensured by the stratum corneum with its structure in “bricks and mortar” (bricks symbolize corneocytes and mortar the intercellular lipids). In addition of the stratum corneum, to ensure this barrier function, cohesion between epidermal cells in the viable layers is essential. To ensure the tissue cohesion, there is several types of epidermal junctions such as GAP junctions, tight junctions (essentially located in the stratum granulosum), desmosomes, corneodesmosomes (in the stratum corneum) and hemidesmosomes, focal adhesions, dystroglycans in the basement membrane.
In this study, both reconstructed human epidermis and full thickness models presented all differentiated layers of a native human epidermis. Indeed, four typical epidermal layers are well differentiated with the presence of columnar keratinocytes in the basal layer, spinous layer constituted of 2-3 layers of polyhedral keratinocytes above the basal layer and the stratum corneum. The cells of the epidermal layers come from the migration of cells of basal layer. In the stratum spinosum, cells are provided with spicules or thorns, hence their name of spiny cells. These spines are in fact desmosomes to which microfilaments are attached. The third layer, the stratum granulosum, with characteristic cytoplasmic keratohyalin vesicles comprising loricrin, trichohyalin and profilaggrin (the precursor of filaggrin), contributes to the formation of interfibrillar cement by keratin filament aggregation. Thus, the function of keratohyalin vesicles is to stabilize the tonofibrils at the level of the corneocytes, by contributing to the formation of the insoluble matrix of the stratum corneum that leads to keratinization.
The cohesion of the spinous layers is also ensured by different junctions such as tight junctions evidenced by claudin-1 and desmosomes that are conversed in corneodesmosomes evidenced by corneodesmosin. Finally, the stratum corneum is formed by a superposition of anucleated and completely keratinized cells, the corneocytes, forming very elongated lamellae. All epidermal cells are firmly attached to each other, thus causing a mechanical cell coupling inducing resistance of the epidermis to mechanical stresses and a part of communication between cells are ensured by the presence of GAP-type junctions. The barrier function integrity can be observed by the detection of specific junction proteins involved in cell-cell adhesion. Claudin-1 (tight junction) and e-cadherin (adherens junctions), detected by specific antibodies, were presents in all suprabasal layers (spinous and granular) both in reconstructed epidermis and full thickness. It is interesting to notice that the detection of these proteins was absent or very weak in the basal layer.
This lower detection is due to the presence of proliferating cells and stem cells which initiate the renewal of the epidermis, indeed basal keratinocytes expressed high levels of β1 integrins and lower levels of e-cadherin and claudin-1. Presence of these two proteins is crucial because e-cadherin favors the incorporation of claudin-1 in the structure of tight junction and a decrease of claudin-1 plays a central role in dermatitis atopic [44]. The cohesion of the epidermal compartment to the dermis is also ensured by several proteins forming complex such as hemidesmosomes, focal adhesions or dystroglycans. Our in vitro model presented proteins belonging at the DEJ demonstrated by the presence of collagen XVII (hemidesmosomes), laminin 332, collagen IV and β1 integrin (focal adhesion). The study of the cell-cell junctions and cell-matrix junctions are very important to better understand skin diseases. The development of in vitro models deficient in specific proteins can be a perfect tool in this investigation.
Indeed, for example hemidesmosome are very important bonds because mutations in the genes encoding these proteins induce serious pathologies such as bullous dermatosis which results from the loss of interaction between plectin and collagen XVII [45], in mice the deficiency of β1 integrin induced a resistance to skin scleroderma resulting in reducing dermis thickness [46]. To develop specific in vitro models, the combination between molecular biology and tissue engineering allows to modify genetically the cells then to reconstruct human tissues deficient in the expression of specific proteins involved in cell-cell junctions or cell-matrix junctions to mimic diseases.

For more Articles on : https://biomedres01.blogspot.com/
Tuesday, January 4, 2022

Reduced Outpatient Obstetrics and Gynecology Visits During COVID-19 Pandemic in a Medium-Sized Regional Hospital, Japan

Reduced Outpatient Obstetrics and Gynecology Visits During COVID-19 Pandemic in a Medium-Sized Regional Hospital, Japan

Introduction

The coronavirus pandemic crippled the healthcare delivery around the world [1,2]. Many countries, including Japan, implemented guidelines to diminish exposure, and individuals were encouraged to stay-at-home orders and self-quarantine to reduce transmission risk of infection, particularly those considered high risk for coronavirus infection (e.g. the elderly and immunocompromised). It brought about unprecedent transformed healthcare services, any form of routine medical care should be avoided and only emergency services may be provided [3,4]. Every country, region and state improved the guidelines according to their infection status and regional requirements [5]. Therefore, we attempted to critically investigate the changes in the number of the outpatient obstetrics and gynecology visits during the pandemic period compared to that of pre-pandemic period at the mid-sized care hospital in the region of Japan.

Materials and Methods

This prospective study was carried out by retrieving outpatient visit data from registries of Matsunami General Medical Center (Gifu, Japan) and the Department of Obstetrics and Gynecology. The data collected from January 2018 to March 2020 was categorized into the pre-pandemic period and the data from April 2020 to September 2021 was grouped into the pandemic period. The statistical analysis was performed with Student’s t-test, and a P-value of <0.05 was considered significant.

Results

Total number of outpatient visits during the initial 3 months of COVID-19 pandemic decreased by17.3 % (from 20643 ±871.1 to 17088 ±886.0 per month, p<0.05) compared to before COVID-19 pandemic (January 2018 to March 2020) (Figure1). There was no significant gender difference in pre-pandemic and pandemic periods. During the pre-pandemic period, approximately 10% of total visits received obstetrics and gynecologic care (Figure 2). The number during the initial 3 months of COVID-19 pandemic was significantly lower than the pre-pandemic period (852 ± 49.1 vs 1136 ± 55.3, p<0.05). The refrain from consultation for obstetrics and gynecologic consultations had a slight tendency to remain throughout pandemic period (means of 957 ± 77.7).

Figure 1: Medical center outpatient visits.

Figure 2: Obstetrics and gynecology outpatient visit.

Discussion

This retrospective study was designed to investigate the effect of the pandemic on the changing trends of obstetrics and gynecology outpatient. The analysis of patients in the pre-pandemic would reflect the usual pattern of cases attending our regional center and the drops in outpatient visits during the initial 3 months of COVID-19 pandemic seemed to more premiant than that of total institutional visits (17.3% vs 25.0%). This was followed by gradual relaxations that led to resumption of healthcare visits even under pandemic. Restriction of movement during the initial 3 months of pandemic period prevented the patients from seeking prompt obstetrics and gynecology-related care and inability to receive the required treatment. Similar changing trend were also noticed in emergency or cancer cares [6-9]. In addition, patient may also intentionally avoid visiting hospitals due to scary infections. Awareness about the restriction of obstetrics and gynecology services during the initial pandemic period may lead to resumption of healthcare visits even under pandemic. Limitations of this study include that we did not categorize emergency, urgent and elective and that we did not observe the attendance age and clinical diagnosis. Further research is needed to understand how decreased outpatient visits during the pandemic may affect attendance outcomes.

Conflict of Interest
The authors declare that they have no conflict of interest.

For more Articles on : https://biomedres01.blogspot.com/
Quantification of Flavonoides and Phenols of Bravo Bean Extract (Capparis flexuosa L. Caparaceae)

Quantification of Flavonoides and Phenols of Bravo Bean Extract (Capparis flexuosa L. Caparaceae)

Introduction
The use of plants for medicinal purposes is not present only in contemporaneity, since the course of human history there was already the search for plants that possessed the curative capacity, even with little knowledge about them, the men of antiquity already used them and distinguished them for the various purposes. Medicinal herbs are fundamental in the treatment of various pathologies, especially in communities isolated from large urban centers [1]. With the advent of navigations it was possible to discover new continents, presenting to the world the great therapeutic arsenal derived from plants, indispensable to modern medicine [2]. Nature has always been a source of charm for man, not only for the useful resources of its food and maintenance, but for being its greatest source of learning and inspiration [3]. Brazil is a privileged country in biodiversity since, of all the plant species in the world, 20% is in The Brazilian territory. Several native or nonnative species face risk of extinction due to the degradation of their habitat and exploratory [4].

Although Brazil has a great biodiversity, there are still few species cataloged and strictly studied as their therapeutic potential, which makes it difficult to make use of these. However, ethnobotany research in the Northeast has shown satisfactory results, especially of plants adapted in the caatinga [5]. The caatinga biome is present only in The Brazilian territory, with an area of 844,453km2, which corresponds to 11.00% of the national territory, predominant of all states of the Northeast and North region of Minas Gerais [6]. This biome has long been considered poor in biodiversity, however, studies have shown its rich biological diversity. More than 2,000 species of vascular, succulent, woody plants and various species of bees, amphibians, birds and mammals have been recorded. Among several species of caatinga, several plants have antioxidant action and several other biological activities, and are used as a remedy for popular use, with leaves, stems and seeds sold in markets and free fairs [6,7-9].

Thus, it is possible to emphasize the species belonging to the family Caparaceae more precisely the species Capparis flexuosa L. (Caparaceae), which is popularly known as wild beans, stands out for presenting a favorable development in semiarid regions, such as the northeast, and in a dry period the occurrence by biological production is satisfactory of this species. Its morphological characteristics consist of a shrub-tree size of perennial leaves, in the late afternoon insects and bees become attracted by their flowers, because they have the ability to ezalarem odor, more precisely due to the main floral resource that it has nectar [10]. Due to its meliferous relevance, C. flexuosa L. is recommended to be cultivated in regions that have as activity the creation and conservation of bees, for the extraction of honey. In addition, this forage exercise an important activity in cattle ranching activities in the northeast, which serve as food for the herds, mainly for sheep and goats, thanks to their resistance to develop in dry periods [11].

In traditional medicine, wild beans are presented as a contributor to several diseases, such as: sinusitis through its inhalation, and against snake bite reactions, from the embehest of the liquid resulting from its peel shaved with water. In view of the attributions of wild beans in traditional medicine, it is important to quantify phenolic compounds and flavonoids of the leaves of C. flexuosa, given the great biological and pharmacological importance of these bioactive compounds in the human organism [12-15]. Therefore, the objective of this study was to quantify the total phenol and flavonoid content of the leaves of C. flexuosa L, using spectrophotometric techniques.

Methodology

Obtaining the Crude Ethanol Extract

The leaves were collected, identified, dried at room temperature and subsequently crushed. The extraction of the chemical constituents was performed by macerated in P.A. ethanol for two weeks. The extractor liquid was concentrated in rotaevaporator at a temperature of 45 °C degrees Celsius, to obtain the crude extract.

Phenolic Compounds - Folin Ciocalteau

The quantification of phenolic compounds and flavonoids was performed by the analytical method of quantification by external standardization, with the aid of a UV-VIS spectrophotometer. The method for determination of total phenols was adapted from [16], and consists of the reaction of the constituent acids of the folinciocalteau reagent and phenolic or non-phenolic compounds. To quantify the phenol content, a calibration curve of manic acid was performed with concentrations ranging from 0.15 to 0.005 mg/mL. After preparing the calibration curve, the plant extract solution was prepared. Initially, 0.005 g of the plant sample was weighed and diluted in 5 mL of MeOH. Then, a rate of 0.075 mL of this solution was removed and 0.425 mL of MeOH (stock solution) was added. To perform the reading, 100μL of the stock solution, 500μL of folin - Ciocalteau and 6 mL of Distilled H2 for each sample were added in amber glass (in triplicate- for eachsample). It was subsequently stirred in the vortex for 1 minute, then 2 mL of 15% sodium carbonate was added and stirred again in the vortex for 30 seconds. The last procedure for the preparation of the solutionswas transferred to the solution to a 10 mL volumetric balloon and the volume was completed with Distilled H2O; and then the solutions were incubated in the dark for 2 hours. To obtain the white, a solution of 100μL of MeOH, 500μL of the Reagent Folin-Ciocalteau and 1 mL of H2The distilledwas prepared. Soon after, 2 mL of sodium carbonate was added 15% and then stirred for 30 seconds in the vortex. Subsequently completed the volume of the solution in a 10 mL volumetric balloon. The solution was incubated in the dark for 2 hours. Before any reading, the whitepp p zeroe the spectrophotometer was used. A UV-VIS spectrophotometer with a wavelength of 750 nm was used to read the solutions.

Quantification of Flavonoid Content

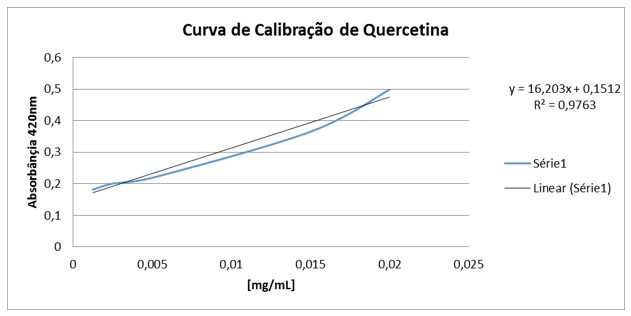
The analysis was adapted to the study by [17]. Initially, the calibration curve was prepared with the quercetin pattern, where 1mg of quercetin was weighed and diluted in 1ml of MeOH. Then, dilutions were performed at concentrations of 0.03; 0,025; 0,020; 0,015; 0,01; 0,005; 0.0025 and 0.00125mg/ml. Soon after, it weighed it and 1mg of the crude extract and diluted it in 1ml of MeOH. After preparing the stock solution, the solutions (in wells - in triplicate) were made for reading that contained 200μl of the test solution of the plant sample and 100μl of 2% aluminumchloride solution. The solution for white (in triplicate) was prepared with 200μl of MeOH and 100μl of 2% aluminum chloride methanic solution. Then the well plate was kept in the dark for 30 minutes. After the time, the reading was performed in aPECTrophobimeter UV-VIS at 420nm. The flavonoid content was determined by interpolation of the average absorbance of the samples against the quercetin calibration curve (replacement of the straight equation) and expressed in mg of EQ (quercetin equivalent) per g of the extract.

Results and Discussion

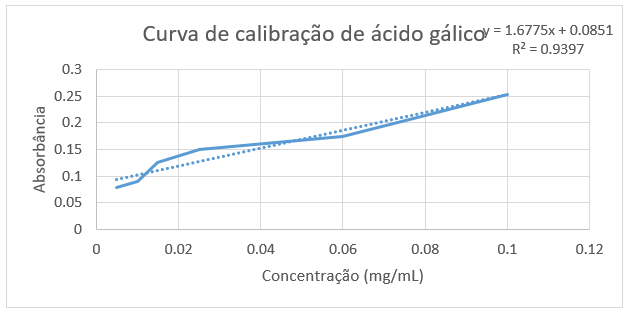
Phenolic substances are widely distributed in nature, about 8000 phenolic compounds have been found in plants [18]. These compounds can be classified according to their chemical structure, in classes such as simple phenols, phenolic acids, acetophenones, phenylaacetic acids, hydroxycinamic acids, phenylpropenes, coumarins, xanthones, anthraquinonas, flavonoids among others [19]. One of the most importantclasses of phenolic compounds are flavonoids. This class is widely distributed in the plant kingdom, being found in fruits, seeds, roots, splints, flowers, teas and wines. They are aromatic substances and have basic structure C6-C3-C6, with 15 carbon atoms. The two rings are aromatic (rings A and B) joined by three carbons that form a heterocyclic with ring C [20]. By the Folin–Ciocalteau method, the total phenol content of the extract of C. flexuosa leaves was determined by the spectrophotometric method. The total phenol content was identified by interpolation of the absorbance of the samples against a calibration curve constructed with patterns of lalic acid [21], as shown in Graph 1.

Graph 1: Calibration curve of the lalic acid.

By interpolating the absorbances of the species C. flexuosa, a content of 1916.9 mg EAG/g of extract was obtained; a result being superior to others already described in the literature. According to JUNIOR (2015) [15], when analyzing the wild bean, a phenol content of 595.47 mg EAG/g of extract was obtained. Assim as phenolic compounds, flavonoids also play an important role in the protection of living organisms against oxidative agents, present in plants, which act as bioactive agents, such as anti-inflammatory, antiallergic, anti-hemorrhagic, action against diabetic retinopathy and among others, highlighting its performance mainly as antioxidant [8,13,14]. Thus, there was a quantitative analysis of the flavonoid content of the species C. flexuosa, obtaining a content of 84.04 mg EQ/g of extract, byinterpolating the absorbances of the sample with a standard quercetin curve (Graph 2).

Graph 2: Quercetin calibration curve.

Conclusion
The preliminary spectrophotometric analysis of the crude extract of the leaves of the species C. flexuosa showed significant values of phenolic compounds and flavonoids. Therefore, future studies should promote the identification of compounds and/ or structural isolation and characterization, monitored by pharmacological bioassays, aiming to identify the active ingredients in different experimental models of inflammatory, cardiovascular and metabolic diseases.

For more Articles on : https://biomedres01.blogspot.com/
Bio-Filtration as a Solution for the Detrimental Health Effect of Excess Fluoride in Drinking Water

Bio-Filtration as a Solution for the Detrimental Health Effect of Excess Fluoride in Drinking Water

Introduction
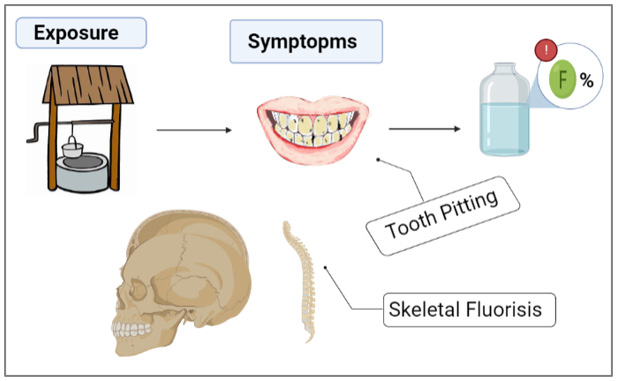
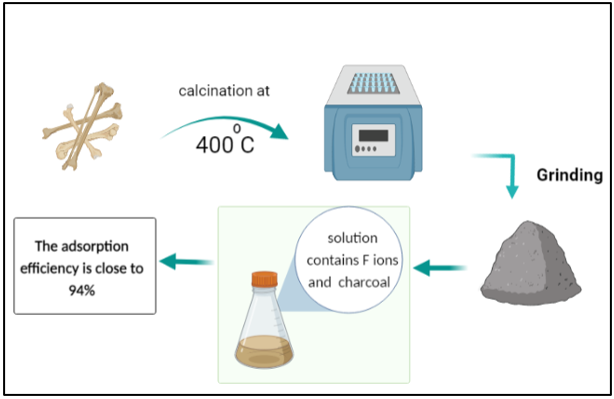
One of the main importance of water filtration is to prevent water-related illnesses and diseases. To this day, various explored methods were used in the remediation of water of different types of contaminants such as flocculation [1,2], coagulation [3], solventextraction [4], co-precipitation [5], precipitation [6], ion-exchange [7], photo catalysis [8], adsorption-desorption [9], reverse-osmosis [10], nano-membrane filtration [11]. The adsorption technique is considered one of the attractive and commercial options to eliminate of the most pollutant substances whether macro- or micro- organic/inorganic ions from water, due to its simplicity of steps and high activity. Moreover, the purification of water by using adsorption technique has been applied to several matter as absorbent such as agricultural residues and industrial residues, and biomaterials wastes, which are modified and applied in biosorption of contaminants from water [7,9-12]. Fluoride is an ionic form of fluorine and can be found in food and numerous sources of drinking water. It can be also purchased as a dietary supplement [12]. Many kinds of toothpastes contain fluoride because these ions serve as an armor against tooth decay [13]. Approximately 80% of the fluoride taken orally is absorbed. Humans retain around 50% of the fluoride they consume, and most of this amount is deposited in teeth and bones (Graphical Abstracts 1 & 2). The remaining 50% is excreted in the urine.

Graphical Abstract 1: Problem statement.

Graphical Abstract 2: Solution.

However, young children can retain an especially high percentage of the consumed fluoride, because their bones and teeth absorb more fluoride than those of adults [14]. The principle and mechanism of pollutants removal by adsorption technology from different types of water based on forms layer of condensate pollutants (called adsorbate) which is migrated from aqueous solution to the surface of solid (called adsorbent) as either in the form of liquid-solid interface [11,15]. Excess fluoride is harmful to human health. Groundwater wells worldwide have been reported to contain water with fluoride concentrations exceeding the acceptable level of 1.5 mg/L. This fact was attributed to local ground stones exhibiting high percentages of fluoride in their composition [14]. Excessive fluoride consumption can lead to several health issues, such as skeletal fluorosis, a disorder marked by bone and joint pain as well as joint tenderness. The overconsumption of fluoride during the formative years of tooth enamel can also lead to dental fluorosis, which leads to tooth discoloration, and/or tooth pitting [15]. Many researchers have attempted to develop water filtration strategies to lower the levels of fluoride or metals that contaminate water [16]. Biomaterials have shown great promise in water filtration because of their environmentally favorable properties, high filtering efficiency, and low cost [17].

Charcoal, which may be manufactured from a variety of biomaterials, is one of the most commonly used bio-filters. Water contaminated with heavy metals can be treated using different processes, which include ion exchange, precipitation, reverse osmosis, catalysis, coagulation, and adsorption [18,19]. Heavy metal adsorption is dependent on the nature of the adsorbents, which can be composed of natural or man-made mate-rials including clay [10], sludge [11], industrial waste, activated carbon, and plants [12]. Bone char is an adsorbent made up of 90% calcium phosphate and 10% carbon. It can be created using one of the two methods: treatment with chemicals and physical treatment leading to carbonization of bones [20,21]. Cow bone char is com-monly used to purify water contaminated with heavy metals, as shown in (Table 1). The aim of the current study was to produce a lowcost, effective, and environmentally friendly biochar adsorbent from cow bone through physical activation (carbonization), and subsequently use it to remove fluoride from the polluted water [22]. Furthermore, it was also proposed to enhance this bio-filter by adding nanocomposites. Nanocomposites have very high surfaceto- volume ratios, which makes them ideal components for the adsorption process [23,24].

Table 1: Bone charcoal use based on the literature review.

Experiments

Cow bones were collected and processed by rinsing them several times with hot water to remove residual muscles and other joint tissues. Then the bones were allowed to dry in the open air. The dried bones were calcined in a furnace for 1 h at 400°C. The resultant charcoal adsorbent was crushed using a gate mortar and stabilized for further testing. It can be stated that the filters were produced with little to no expenses. A stock solution of CaF2 with a 100-ppm concentration of fluoride was prepared to test its adsorption in the cow bone sample. First, 1 g of charcoal was added to the 100 mL solution in a separate beaker, which was then placed in a shaker operated at room temperature and a 251 min-1 frequency for 5 h. Next, on the same day, the solution containing cow bone charcoal was filtered from impurities and charcoal leftovers using filter paper to prepare a sample for ionic chromatography (IC) [25]. IC was utilized for determining the concentrations of calcium and fluoride ions in the prepared CaF2 solution. Ion chromatographs can measure concentrations of important anions such as fluoride, chloride, nitrate, nitrite, and sulfate, as well as major cations such as lithium, sodium, ammonium, potassium, calcium, and magnesium in the parts-per-million (ppm) range. Ion chromatography can also be used to determine the concentrations of organic acid [26].

The surface structure of cow bone charcoal was studied by using a scanning electron microscope (SEM) (Model: JSM-7100F) at 10000 × magnification [27]. In conjunction with SEM, the energy dispersive X-ray (EDX) analysis technique was used to perform the elemental analysis and chemical characterization of the material. EDX utilizes an electron beam that strikes the surface of a conducting sample (placed under SEM) to determine its elemental content [28].

Results and Discussion

The SEM micrographs of the cow bone biochar explained the sample morphology by analyzing the microstructure of the bone powder, as shown in (Figure 1a). The corresponding EDX graph is presented in (Figure 1b). A close look at (Figure 1a) reveals cracks and irregular surfaces, as expected after grinding, where Vickers hardness can be determined (it is planned to be measured in the upcoming study). Furthermore, SEM micrographs showed that the studied samples had several heterogeneous porous layers, which represent a key feature relevant for fluoride adsorption. The pores appeared to be localized symmetrically in certain regions in the grooves on the surface of the bone. The sample composition revealed by EDX results was as follows: O2, 39.6 wt%; Ca, 33.9 wt%; C, 12.8 wt%; P, 12.8 wt%; Na and Mg, 0.9 wt%.

Figure 1: (a) Scanning electron microscope (SEM) micrograph of the cow bone charcoal shows several groups of symmetrically distributed pores. (b) The corresponding energy dispersive X-ray (EDX) graph of the bone constituents.

The surface morphology of the cow bone is particularly distinctive in terms of the hard appearance and the distribution of pores, which are of critical importance in filtering large species from water (Figure 2). Hence, the surface geometry and the source of adsorbent provided different types of active sites onto surface of adsorbent [29-35] (Table 2).

Figure 2: (a) SEM micrograph of cow bone charcoal shows symmetrically distributed pores on the surface (red arrows) with diameters in the range of several hundred nanometers, as shown in (b).

Table 2: The effect of bio-filtration with cow bone charcoal on fluoride removal.

Conclusion

The examined cow bone charcoal filter achieved maximal fluoride adsorption of 93.6%, which can be attributed to its porous nature. The prepared bio-filter has a very high adsorption capacity and is energy-efficient as it works at room temperature and does not require energy consumption. It means that using cow bone charcoal is a cost-effective filtration technique that should be further investigated to optimize the performance of nanocomposites and to set up measures for its widespread manufacturing.

Supplementary Materials

N/A.

Author’s Contribution

Alasmari, E, M, carried out experiments and engaged in various article-related tasks. Alsharif, S. H. performed the experimental measure-ments. Khayyat, M. M. designed the experiments and prepared the final version of the manuscript.

Funding

This work was performed as part of the joint program of KACST and Mohiba ITHRAA 2021.

Data Availability Statement

The obtained results have been presented in the cur-rent article, and any further details can be provided upon request made to the cor-responding author.

Acknowledgment

The authors would like to thank Dr. Saeed M. Alshehri, the director of MSRI, KACST, for his kind support throughout the project.

Conflicts of Interest
The authors declare that the research was conducted in the absence of any commercial or financial relationships that could be construed as a potential conflict of interest.


For more Articles on : https://biomedres01.blogspot.com/
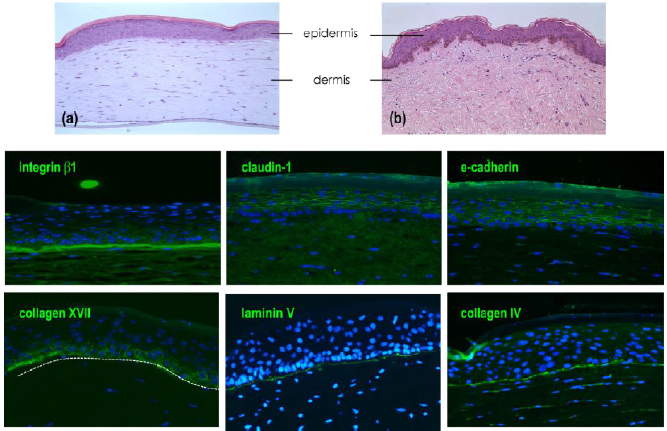
Bridging the Gap Between COVID-19 and Subarachnoid Hemorrhage: A Case Report and Literature Review

  Bridging the Gap Between COVID-19 and Subarachnoid Hemorrhage: A Case Report and Literature Review Introduction The novel coronavirus was ...