Assessment of the Phenolic Contents, Antioxidant and Antimicrobial Activities of Oxalis pes-caprae
Introduction
Oxalis pes-caprae (O. pes-caprae), also called sourgrass or soursob, bermuda buttercup, buttercup oxalis or yellow oxalis, is a perennial herbaceous plant of the Oxalidaceae family, native to South Africa [1]. O. pes-caprae has a pleasant sour flavour and acidic tastes. This acidity is caused by the unusually high content of oxalic acid [2]. Despite its biodisponibility in all regions of Tunisia during the spring, no previous investigation was interested on study of antioxidant, antimicrobial activities. The plant has been used as a source of oxalic acid. Bulbs are small, white to brown in color, tear shape and sour in taste, and usually used as a food and leaves in salad [3]. In folk medicine, the plant has been used as anti-parasitic (Anthelmintic), antihypertensive, and as a diuretic [3,4]. Flowering period is from January to April and the golden petals can be used to produce a yellow dye [5]. The isolation and characterization of various compounds of O. pes-caprae have been reported. These include cinnamic acid ester, two dihydrocinnamic acid esters, a noroxyneolignan, a dibenzyl ether derivative, cinnamic and dihydrocinnamic acids, phenols, 4-hydroxybenzoic acid, THC acid, flavonoids, p-coumaric acid, dihydrocinnamic acid, cis-p-coumaric acid, 3-methoxyphenol, 2-methoxyphenol, 4-hydroxybenzoic acid, 4-(1-hydroxyethyl)phenol, 3-(1-hydroxyethyl)phenol, and flavones derivates (tangeretin, nobiletin, 5-demethylnobiletin, and 4’-demethylnobiletin) [6-8].
More focus is given from scientific research in various specialties on medicinal and aromatic plants in order to extract, identify and isolate natural compounds and molecules with potential biological activities. In recent years, interest in natural antioxidants, in relation to their therapeutic properties, has increased significantly [9]. Nevertheless, currently, no single, reliable universal method of antioxidant capacity assessment. Indeed, to judge the overall antioxidant effect of an extract from a plant or food resource, the use of several antioxidant activity tests is necessary [9]. Thus, the antioxidant activity of O. pes-caprae extracts was evaluated using the combination of four tests, namely DPPH, ABTS, β-carotene and FRAP methods. In addition, the antibacterial and antifungal activities of all extracts from different plant parts were evaluated by using the microdilution assay. Phytochemical quantification of phenols, flavonoids and tannins were also assessed and correlated with different activities.
Materials and Methods
Preparation of Plant Extracts
Different parts of O. pes-caprae (seeds, stems, leaves and flowers) were collected from the region of Beni Khalled, Nabeul, northeastern Tunisia, in December 2016. The samples were dried in the dark at room temperature (RT, 28 ± 2 °C) and stored carefully in a dry place until extraction. Organs crushing was carried out with an electronic blinder. Powder was submitted to extraction by maceration with continuous agitation, at RT and in the dark for minimum 12 h. Five organic solvents and water are used (100 mL of the solvent are added per 10 g of powder), which are added in order of increasing polarity: ether of petroleum, chloroform, ethyl acetate, ethanol, methanol and water respectively [10]. The mixture is filtered through Wattman N°1 paper and placed in oven at 37 °C overnight for solvent evaporation.
Determination of Plant Extraction Yield
To compare the proportions sample/extract, the extraction yield was calculated according to the following formula [11]:
Yield (%) = (Wext / Wsamp × 100
Wext: Extract weight obtained after solvent evaporation
Wsamp: Initial sample weigh
Determination of Total Polyphenol Content
The principle of this dosage is adapted from Singleton & Ross (1965) with the Folin-Ciocalteu reagent [12]. The extracts tested were prepared at a concentration of 1 mg/mL, dissolved in distilled water. For dosage, 750 μL of the Folin-Cioclateu reagent (diluted ten times) was added to 100 μL of extract, shake vigorously then, after 5 min 750 μL of sodium carbonate solution was added. The mixture was incubated in the dark and at RT for 90 min. Absorbance is measured at 760 nm with a plate reader (Thermo Scientific). The total polyphenol content is deduced from a standard curve established with gallic acid (0-250 μg/mL) under the same conditions as extracts. Results are expressed in mg of equivalent of gallic acid per g of extract (mg EAG/g extract).
Determination of Total Flavonoid Content
The aluminum trichloride (AlCl3) method was adopted to quantify total flavonoids in the various extracts [13]. One and a half mL of the extract solution (dissolved in distilled water) is added to 1.5 mL of 2% AlCl3 in methanol. The mixture is vigorously shaked, then incubated in the dark at RT for 10 min. The absorbance is measured at 367 nm with a plate reader. The quantification of flavonoids is deduced from a standard curve established with quercetin (0-50 μg/mL). The results are expressed in mg of quercetin equivalent per g of extract (mg EQ/g extract).
Determination of Total Tannins Content
The reference method described by Sun et al. was used [14]. Fifty μL of the extract is mixed with 3 mL of vanillin (4%), and then 1.5 mL of concentrated HCl was added. The assay was miniaturized in 96-well plates, in each well, 200 μL of the mixture was added. After 15 min of incubation at RT and in the dark, the absorbance was measured at 500 nm with a plate reader. Catechin was used as a standard for establishing the standard curve, and the content of condensed tannins is expressed in mg of catechin equivalent per g of dry extract (mg EC/g extract).
Antioxidant Activity of Plant Extracts
DPPH Radical-Scavenging Activity: The effect of extracts on the 2,2-Diphenyl-1-picrylhydrazyl (DPPH) radical is estimated by the method described by Molyneux et al. [15]. Briefly, 100 μL of extract with a concentration of 0.007 to 1 mg/mL are added to 100 μL of a methanolic solution of DPPH (the final concentration of DPPH is 0.2 mmol/L). Absorbance is measured using an ELISA plate reader at a wavelength of 520 nm, after 30 min of incubation in the dark and at RT. Anti-free radical activity is expressed as a percentage of reduced DPPH. Quercetin is used as a reference substance.
Inhibition Percentage = [( A0 − A1 ) / A0] ×100
Where A0 and A1 are the absorbance at 30 min of the control and the extracts, respectively. The antiradical activity was expressed as IC50 (mg/mL), the extract dose required to cause a 50% decrease of the absorbance at 517 nm.
ABTS Radical Scavenging Activity: The ABTS (2-2’-Azino-di- [3-ethylbenzothiazoline sulfonate]) solution is prepared by mixing 7 mM ABTS and 2.45 mM potassium persulfate (K2S2O8), and incubated for 12-16 h in the dark at RT [16]. The ABTS+ solution is diluted with ethanol to an absorbance of 0.7 (± 0.02) is obtained at 734 nm. To determine the anti-free radical potential, 150 μL of the diluted solution of ABTS+ is added to 50 μL of the plant extract with a concentration of 0.007 to 1 mg/mL. Then, the absorbance is measured by the ELISA plate reader at 734 nm after 30 min of incubation in the dark at RT. The anti-free radical power of the extract is expressed as an inhibition percentage of the ABTS+ radical, and calculated using the same formula as for DPPH. The inhibition curves were prepared and IC50 values were obtained.
β-Carotene-linoleic Acid Assay: To a solution of 2 mg of β-carotene (dissolved in 1 mL of chloroform), 25 μl of linoleic acid and 200 mg of Tween 40 are added, and then chloroform was evaporated at 40 °C in vacuo. One hundred mL of deionized water are added with vigorous shaking. To 2.5 mL of this emulsion, 350 μL of each extract (1 mg/mL) and of the Butylated HydroxyToluene (BHT) control are added. The absorbance is immediately (t=0) measured for BHT at 490 nm and after 2 h of incubation (t=120) in the dark, for the extracts [17]. The antioxidant activity of the extracts was evaluated in terms of bleaching of the β-carotene using the following formula:
β-Carotene Bleaching Inhibition (%) =[E120− A120 / A0 − A120 ] ×100
Where A0 and A120 were the absorbance values of the control at 0 and 120 min, respectively, and E is the extract absorbance at 120 min. The results were expressed as IC50 values (mg/mL).
Reducing Power Determination: The Ferric Reducing Antioxidant Power (FRAP) of organic and aqueous extracts was determined according to the method described by El Jemli et al. [18]. The method consists of mixing 200 μL of extracts at different concentrations with 500 μL of phosphate buffer (200 mM, pH 6.6) and 500 μL of potassium ferricyanide K3Fe(CN)6 (1%). The mixture is incubated at 50 °C for 20 min. Subsequently, 500 μL of trichloroacetic acid (1%) are added to the mixture to stop the reaction, and the tubes are centrifuged at 600 rpm for 10 min. Finally, the supernatant (500 μL) is mixed with 500 μL of distilled water and 100 μL of FeCl3 (0.1%). The absorbance is measured at 700 nm by an ELISA plate reader. In this test, the yellow color of the solution changes to a green, the intensity of which depends on the reducing capacity of the sample. The results are expressed in terms of the inhibition concentration IC50 which represents the concentration of the extract corresponding to an absorbance equal to 0.5. The IC50 value is obtained by interpretation of the linear regression curve.
Antimicrobial Activities
For antibacterial activity, the bacteria used included two Gram‐negative bacteria, Salmonella enterica (NCTC 6017) and Escherichia coli (ATCC 8739) and two Gram‐positive bacteria, Bacillus subtilis (ATCC 6633) and Staphylococcus aureus (ATCC 6538). For antifungal activity assessment, we have used Candida albicans (ATCC 2071).
Determination of MIC: The Minimum Inhibitory Concentration (MIC) is the smallest inhibitory concentration of microbial growth (100%) after a contact time with the substance tested (extract, antibiotic, etc.) of 18-24 h [19]. The MIC of different plant extracts were determined by the standardized method of micro-dilution in Muller Hinton (MH) broth medium, in 96-well plates. One hundred μL of MH broth medium with 1.5 ×10⁶ Colony Forming Units (CFU) per mL microbial suspension (inoculum). Then, 200 μL of the initial concentration of the extract (5 mg/mL) are added in the first well and serially diluted twofold up to 10 dilutions. Fifty μL of the inoculum is added to the different wells. The detection of microbial growth is determined by adding 10 μL of resazurin (growth indicator, which is initially blue and changes to pink by reduction in the presence of living cells). Two controls were used for each test. These included positive control (well containing antibiotic (Gentamicin) or fungicide (Amphotericin B) and growth media with the inoculum) and negative control (well containing the growth medium with inoculum).
Determination of MBC: MBC is the Minimum Bactericidal Concentration (or MFC for Minimum Fungicidal Concentration) of an extract capable of 99.9% reduction in the microbial population after incubation for 18-24 h at 37 °C [20]. The MBC (or MFC) is determined from the wells corresponding to the MIC and those before, which will be inoculated on MH agar, then incubated at 37 °C for 24 hours. The absence of surviving microbial colonies in the Petri dish means that the corresponding concentration is the MBC (or MFC).
Statistical Analyses
Extracts were analyzed in three analytical replications and data were presented as mean ± SD (standard deviations) and a P value <0.05 was considered statistically significant. IC50 values were calculated by Graph-Pad Prism. The Pearson’s correlation test was used to analyze the correlation between total phenolic, total flavonoids and tannin content in different plant parts and antioxidant and antimicrobial activities. Correlation coefficient r >0: positive correlation; Correlation coefficient r <0: negative correlation.
Results and Discussion
Extraction Yield
Maceration is a simple and traditional method which consists of making the plant material in contact with the solvent. It is based on the solubility of bioactive compounds in the solvent and it may be influenced by many factors, mainly the nature of plant material, the concentration of molecules in the sample, the solvent, the temperature and time of the extraction [21]. Notably, extraction yields increases from the root (seeds) to the shoot part of the plant (stems, leaves and flowers). Indeed, high extraction yields are noted with leaves and flowers and especially for water extract (Figure 1). For leaves, the yields are around 1% for chloroform, ethyl acetate and ethanol, 2% for petroleum ether and methanol, and up to 3.5% for water extract. For flowers, the yields vary between 0.34% for methanol extract and 3.44% for water extract. The yields are around 1% for petroleum ether and chloroform, followed by ethanol extract with a yield around 1.65% and ethyl acetate with a yield around 2.19%. Lowest yields are noted for seeds (between 0.11% and 0.33%, with an increase of yield with passage from a solvent to the next) followed by stems, when yield vary between 0.45% and 1.7%. Much higher percent extractive values were previously noted with ethanol (5.31 %), methanol (20.6 %), chloroform (8.43 %) extracts of O. pes-caprae [4].
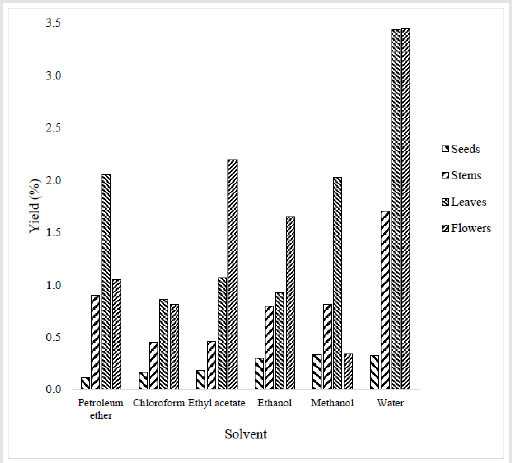
Figure 1:Percentage yield of different parts of plant extracts. The powder of each plant part was submitted to extraction by maceration by using different organic solvent and water. After that, solvent and water were evaporated, and percentage yield of each extract was determined according to the formula described by Falleh et al. [11].
Total Polyphenol Content
High content of polyphenols were obtained with ethanol, methanol and water extracts of different plant parts (Figure 2). Indeed, polyphenol contents were between 42 and 104 mg GAE/g of extract in seeds and stems extracts, and between 90 and 230 mg GAE/g of extract in leaves and flowers extracts for leaves and flowers respectively. Moderate contents were obtained with chloroform and ethyl acetate extracts of different parts (between 14 and 100 mg GAE/g of extract). Relatively low amounts were determined in petroleum ether extracts of seeds, stems and flowers (18 ± 1.97, 26 ± 1.72 and 32 ± 3.2 mg GAE/g of extract respectively) with no polyphenol traces for leaves extracts. Lower total phenolic content of ethyl acetate (8.46 GAE/g of extract) and methanol (4.16 GAE/g of extract) extracts of the aerial part of O. pes caprae were previously noted [22]. Also, low phenol levels (11.56 ± 0.21 mg 100/g of extract) was found in lyophilised leaves and peduncle of inflorescence samples of O. pes-caprae [17]. The polyphenolic content of the aerial extracts were identified as chlorogenic acid, quinic ferulate, luteolin glucoside, cernuoside luteolin and apigenin [22,23].
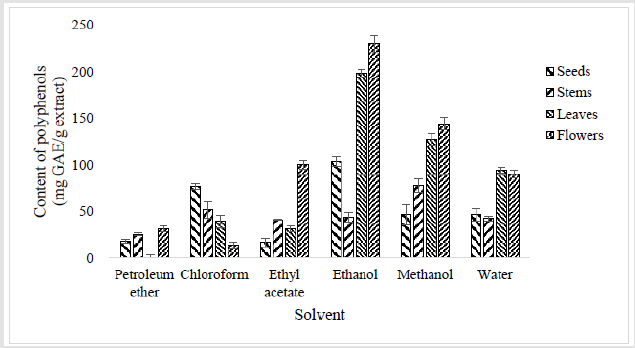
Figure 2:Contents of total polyphenol (expressed as mg Gallic Acid Equivalents / g of extract) in extracts of different parts of Oxalis pes-caprae. The quantification of total phenols was determined by Folin-Ciocalteu method for each extract and results are expressed in terms of Gallic Acid Equivalent (mg GAE/g) of extract [12]. Each bar represents the mean ± SD of triplicate determinations (n=3).
Total Flavonoid Content
High contents of flavonoids were obtained in ethanol (192 ± 7.14 and 209 ± 5.39 mg QE/g of extract respectively), methanol (182 ± 1.31 and 187 ± 8.02 mg QE/g of extract respectively) and water (170 ± 2.04 and 181 ± 8.75 mg QE/g of extract respectively) extracts leaves and flowers (Figure 3). Moderate to low amounts of flavonoids were determined in ethanol, methanol and aqueous extracts for seeds (106 ± 7.73, 31 ± 2.19 and 8 ± 1.75 mg QE/g of extract respectively) and stems (88 ± 1.89, 83 ± 2.48 and 47 ± 1.6 mg QE/g of extract respectively). Also, in chloroform (between 15 and 68 mg QE/g of extract) and ethyl acetate (between 39 to 138 mg QE/g of extract) extracts of different plant parts. No traces of flavonoid were noted in petroleum ether extracts of different plant parts and in ethyl acetate extract of seeds.
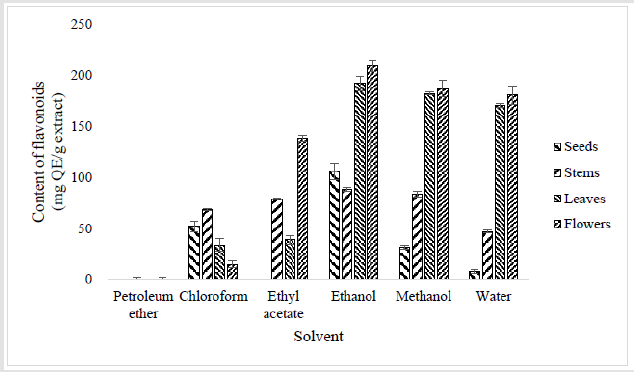
Figure 3:Contents of total flavonoids (expressed as mg Quercetin / g of extract) in extracts of different parts of Oxalis pes-caprae. The quantification of flavonoids was estimated by Aluminum Trichloride (AlCl3) method and results are expressed as mg of quercetin equivalent per g of extract (mg QE/g)[13]. Each bar represents the mean ± SD of triplicate determinations (n=3).
Total Tannin Content
Compared to polyphenols and flavonoids, the tannin profile seems to be inverted. Indeed, much higher tannin contents were found in non-polar and low polarity index solvents (petroleum ether, chloroform and ethyl acetate). Similarly, to polyphenols and flavonoids, high tannin contents were found in leaves and flowers extracts. Especially, in chloroform extract, with tannin content ranged between 116 and 121 mg CT/g of extract respectively (Figure 4). Moderate amounts were determined in petroleum ether (42 ± 5.89 mg CT/g of extract) extract of stems, in chloroform (30 ± 4.71 and 52 ± 2.36 mg CT/g of extract respectively) and ethyl acetate (32 ± 4.71 and 60 ± 2.36 mg CT/g of extract respectively) extracts of seeds and stems. Similarly, in petroleum ether (31 ± 3.54 and 56 ± 5.89 mg CT/g of extract respectively) and ethyl acetate (52 ± 4.71 and 42 ± 2.36 mg CT/g of extract respectively) extracts of leaves and flowers. For ethanol (between 2 and 29 mg CT/g of extract), methanol (between 2 and 31 mg CT/g of extract) and water (between 1 and 65 mg CT/g of extract) extracts, most of amounts were lower than other extracts. Even no traces were detected in ethanol extract of seeds and in water extracts of leaves.
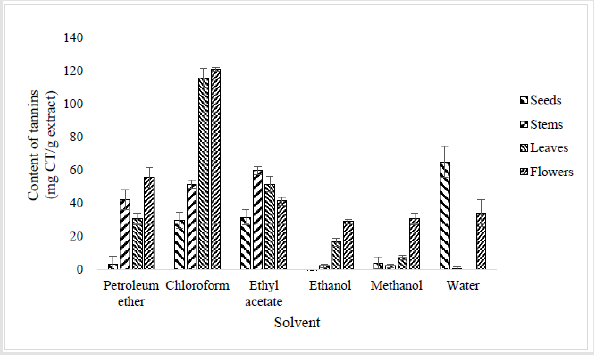
Figure 4:Contents of total condensed tannin (expressed as mg Catechin / g dry weight) in extracts of different parts of Oxalis pes-caprae. The quantification of condensed tannins in each extract was determined according to the method of Sun et al. and results are expressed as mg of catechin equivalent per g of extract (mg CE/g)[14]. Each bar represents the mean ± SD of triplicate determinations (n=3).
In a recent study, qualitative analysis of ethanolic, methanolic and chlorofrom extracts of O. pes-caprae exhibited occurrence of phenol, tannins (as analysed by ferric chloride test), flavonoids (as analysed by Alkali test), carbohydrates and saponins in all extracts [4].
Antioxidant Capacity
For note, a lower IC50 value corresponds to a higher antioxidant activity. As shown in Table 1, for DPPH method, petroleum ether did not shown an important activity. For other solvents, leaves and flowers noted better activity than seeds and stems with an inverted profile with chloroform extracts. Similar range of antioxidant activity, by using DPPH, was noted with ethyl acetate (IC50 equal to 0.44 mg/mL) and methanol (with IC50 equal to 0.3 mg/mL) O. pes-caprae plant tissues extracts [22]. Gaspar et al. (2017) recently noted more important free radical scavenging bioactivity by DPPH of dried extract of O. pes-caprae, with an IC50 equal to 0.018 mg/ mL. For ABTS method, potent activity was noted for petroleum ether (with IC50 equal to 0.374 ± 0.038 and 0.228 ± 0.014 mg/mL respectively) and chloroform (with IC50 equal to 0.177 ± 0.006 and 0.042±0.005 mg/mL respectively) extracts of seeds and stems, with lesser activity (even negligible for some extracts) for leaves and flowers. All ethyl acetate extracts of different plant parts noted an important ABTS activity with IC50 ranged between 0.038 and 0.546 mg/mL. A lower activity was noted for ethanolic extracts of seeds (IC50 = 3.048 ± 0.482 mg/mL) and stems (IC50 = 2.488 ± 0.551 mg/mL) versus an important activity for ethanolic extract of leaves (IC50 = 0.527 ± 0.042 mg/mL) and flowers (IC50 = 0.099 ± 0.011 mg/mL). For methanolic extracts of different parts, a moderate activity was noted with IC50 ranged between 0.3 and 1.79 mg/mL. A potent activity (IC50 < 1 mg/mL) of aqueous extract of different parts was noted except for seeds extract (> 5 mg/mL).
For β-carotene method, a very high activity was noted for six extracts of the different organs, with an IC50 between 0.008 and 0.79 mg/mL. Finally for FRAP method, a lower values (1 mg/mL > IC50 > 5 mg/mL) was noted for all extracts of different plant parts.
Thus, an important antioxidant activity noted with most of different plant parts extracts was in agreement with other studies reveals that O. pes-caprae is an interesting source of antioxidant secondary metabolites which contains a high levels of antioxidant compounds, such as luteolin glucoside and cernuoside [22,23].
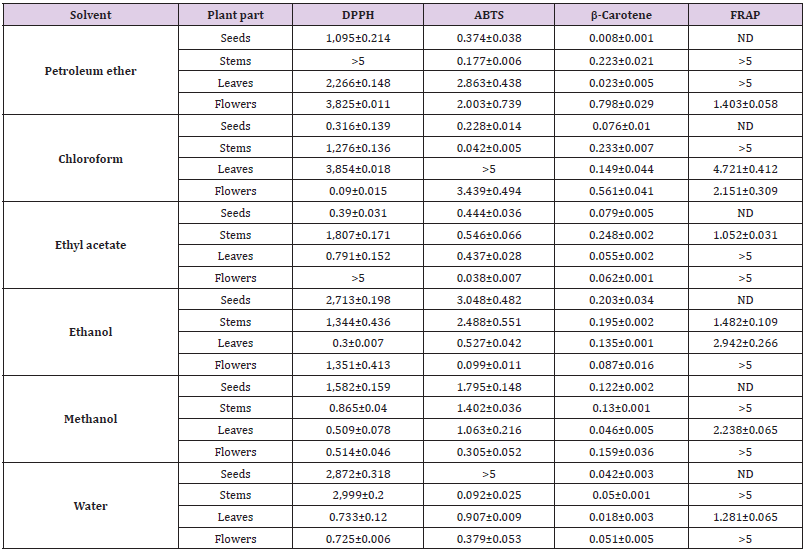
Table 1: Body mass index of the patients over a year.
ND: Not Determined.
Antimicrobial Activities
A broad variation in the antibacterial properties of different extracts from different plant parts against various strains was observed. The results are indicated in Table 2. For the four organs, no antimicrobial activity (MIC and MBC > 5 mg/mL) was noted against all strain for petroleum ether and chloroform extracts. Except, a selective inhibitory effect against S. aureus (5 mg/mL) was noted for chloroform extract of flowers. For ethyl acetate extracts, only extract of flowers noted a potential antimicrobial activity (against S. enterica, B. subtilis and C. albicans). Ethanol extract of seeds has an effect only against Gram- bacteria (S. enterica and E. coli). For ethanol extract of flowers, an important antimicrobial activity was noted for S. enterica, B. subtilis and C. albicans. However, for ethanol extracts of stems and leaves, no antimicrobial activity against any of tested strain was noted. For methanol extract of seeds, an antimicrobial effect was noted against S. enterica, E. coli, B. subtilis and C. albicans. A specific antibacterial effect against S. aureus was noted for methanol extract of stems. An antibacterial activity was noted for methanol extract of leaves against S. enterica and for methanol extract of flowers against S. aureus. An antifungicidal effect (against C. albicans) was noted for both methanol extracts of leaves and flowers. A selective antibacterial activity against S. enterica was noted with aqueous extract of seeds. No other potential antimicrobial activity of water extract was noted for other organs against selected strains.
O. pes-caprae was known as a natural source of antibacterial and antifungal compounds. In fact, among ethanolic, methanolic, acetone, n-hexane and chloroform extracts of O. pes-caprae, a high antibacterial activity was shown with ethanolic extract against Xanthomonas (16.25 mm), Clavibacter machengnitis (17.75 mm) and Bacillus (20.5 mm). Concerning antifungal activity, the potent activity was shown by ethanolic extract against Aspergillus flavus (48.24 mm), Fusarium solani (41.5 mm) and Penicillium (35.34 mm) at 1000 ppm [3].
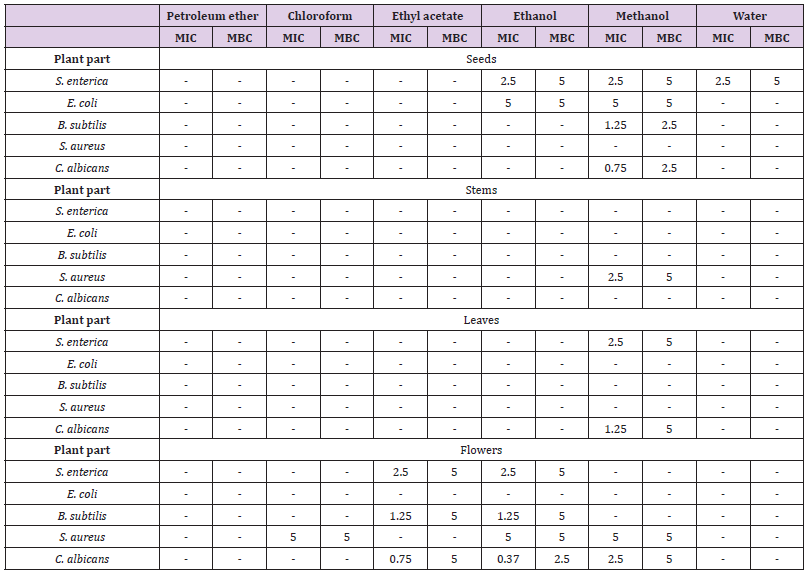
Table 2: Body mass index of the patients over a year.
MIC: Minimum Inhibitory Concentration; MBC: Maximal Bactericidal Concentration; - : >5mg/mL
Correlation Analysis
To appreciate an eventual correlation between total polyphenols, total flavonoids and condensed tannins contents, in the different extracts of each plant organ, and antioxidant and antimicrobial activity, we used the Pearson’s test (Table 3). Notably, no significant correlation was found between polyphenols contents and antioxidant activity. Most of significant correlation was noted between flavonoids contents and antioxidant activity. Indeed, a significant correlation was noted between flavonoids contents and DPPH antioxidant activity of stems extracts (r = -0.9694; P = 0.0014) and ABTS antioxidant activity of flowers extracts (r = -0.884; P = 0.0194). Also, between flavonoids contents and β-Carotene activity of seeds (r = 0.8694; P = 0.0245) and flowers (r = -0.9335; P = 0.0065) extracts, and between flavonoids contents and FRAP activity of stems (r = -0.9798; P = 0.0006), leaves (r = -0.9179; 0.0098) and flowers (r = 0.9641; P = 0.0019) extracts. A significant correlation was also noted between tannin contents and DPPH activity (r = 0.8528: P = 0.0309) in leaves extract and between tannin contents and ABTS activity in leaves (r = 0.8262; P = 0.0427) and flowers (r = 0.9407; P = 0.0052) extracts. Previous significant correlation was found between total phenolic content and antiradical activity for O. pes-caprae measured by the DPPH assay [23]. A significant correlation between phytochemical contents and antibacterial activity was noted only with polyphenols in stem extracts and MIC and MBC of anti-bacterial activity against S. aureus (r = -0.873; P = 0.0232).
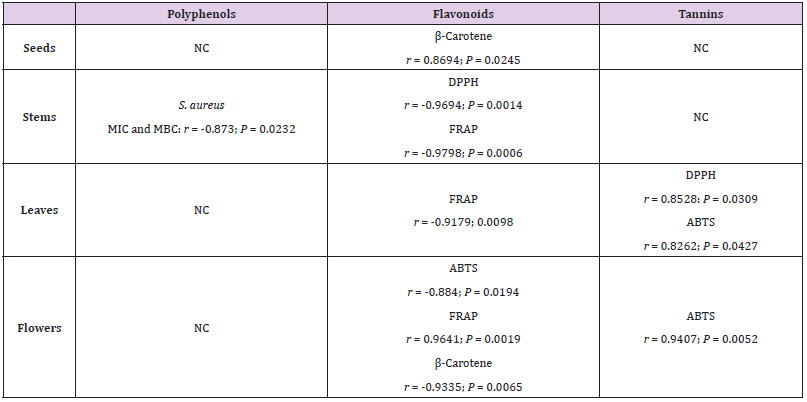
Table 3: Correlation coefficient r between polyphenols, flavonoids and tannins contents and antioxidant and antimicrobial activity.
NC: No significant correlation.
Conclusion
A relatively important yield of extraction was obtained with maceration especially for leaves and flowers. Phytochemical analysis in organic and aqueous extracts of seeds, stems, leaves and flowers of Oxalis pes-caprae reveals an important total phenolic and flavonoid contents in ethanol, methanol and water extracts, and tannins amount in petroleum ether, chloroform and ethyl acetate extracts. For note, the highest phytochemical amounts were obtained with leaves and flowers extracts. Various extracts reveals a potent antioxidant activity with DPPH, ABTS, β-carotene and FRAP assay method as demonstrated with a lower IC50 values. Antimicrobial activity, evaluated with MIC and MBC values, shown a potential antibacterial and antifungal activities especially with ethanol and methanol extracts against different tested strains. Correlation analysis reveals a strong relation between flavonoids contents and antioxidant activity of extracts from different plant parts.
| For more Articles on : https://biomedres01.blogspot.com/ |