Friday, April 29, 2022

Doctor of Radiography Curriculum: Comparison of the Perception of Radiography Lecturers and Radiography Students towards the Proposed Curriculum


Doctor of Radiography Curriculum: Comparison of the Perception of Radiography Lecturers and Radiography Students towards the Proposed Curriculum


Introduction

The word curriculum etymologically is derived from the Latin word ‘curus’ which means a racecourse taken by horses. In education, curriculum is conceived as a course taken in the systematized educational process. The term ‘curriculum’ was coined by Franklin Bobbit in the year 1918. According to Bobbit, curriculum embodies experiences that the learner acquires in a learning institution [1]. Subsequently, curriculum has generally remained conceptualized as an instrument which embodies all those students undergo or pass through while pursuing any educational program. Even universities cannot be effectively run. Curriculum is regarded as the heart of learning institution [2]. Curriculum could be seen as a body of knowledge, as learning experiences, as a plan for action, learning outcomes or a process. According to Adirika and Okolie, curriculum is planned, guided learning experiences, and intended learning outcomes formulated through the systematic reconstruction of knowledge under the auspices of the school for the continuous and willful growth of the learner [3]. Curriculum is thus a programme which universities must run to properly educate the students. With curriculum, universities prepare students to acquire skills that would enable them to survive in their society. Hence, it should include a plan, a statement of purpose with a specification of contents and methods, inbuilt with the capacity for evaluation to know whether the purpose has been achieved or not. The curriculum of any institution of learning should be developed for the achievement of desired educational goals.

Curriculum development has a broad scope because it encompasses and considers the development of the school, the students, the teachers, and the society at large. Curriculum development is thus a planned, purposeful, progressive, and systematic process designed to create positive improvements in the educational system [2]. Since education is concerned with the advancement of man and the society, the curriculum developed to actualize this must possess the following five characteristics: purposeful aims and objectives, functionality, flexibility, relevance, and evaluation [4]. First, the aims and objectives of the curriculum to be developed must be clearly stated. A properly developed curriculum should also be workable, practicable and feasible. It should also be flexible hence, capable of adapting to the needs of the students and the society at large. Relevance is another characteristic of a properly developed curriculum. By relevance, the curriculum ought to emphasize the aspects that will be of great benefit to the students and the society. Students like to learn what would be useful to them. Evaluation thus becomes a very important characteristic a curriculum developer must consider. The developed curriculum should be evaluated to ensure that there is progress and that the progress is in the desired direction. This serves as a feedback for curriculum planners, implementers, and beneficiaries alike [2].

Radiography has undergone many transformations in recent years with a diversification in the role of the radiographers. The doctor of radiography curriculum is intended to introduce new areas like forensic radiography, computed tomography, film reporting, counseling skills, procurement and entrepreneurial skills and supply chain management which is role extension for radiographers. The doctor of radiography programme is expected to last for six sessions or twelve semesters unlike the basic bachelor’s programme that lasts for five sessions or ten semesters. This is also obtained in other sister professions like Pharmacy, Medical rehabilitation, and Optometry. This is to keep in pace with other health professional groups academically. The Doctor of Radiography program is also expected to produce radiographers with professional competence, scientific competence, and sufficient managerial ability to perform excellently in hospital diagnostic services, public health services, research, and academics. Hence, produce graduates that will be able to function independently or in collaboration with other members of the health team. In the long run, the doctor of radiography programme with the help of a well-designed curriculum is expected to produce high quality professionals that can be part of the health team that make policies at the national and international levels. There is an urgent need for radiographers to be part of the team that make policies in the health sector so they can always protect the interest of the profession and the nation at large. The inclusion of radiographers in the health-policy making team will enhance the growth of the profession as bills promoting the growth of the profession will easily be passed into law while bills threatening the existence of the profession will be identified early and responded to; accordingly, since the radiography profession must adapt to the needs of the modern health sector and keep in pace with other health professional groups. The aim of this study is to compare the perception of radiography lecturers and radiography students towards the proposed Doctor of Radiography (D-RAD) curriculum.

Methodology

Participation in this cross-sectional study was voluntary and all were informed that their right to confidentiality and privacy would be adhered to. Ethical approval to carry out the study was obtained. Undergraduate students in their first, second and third years of study were excluded. The study population comprised radiography lecturers (n=62) and radiography students in their fourth and fifth years (n=40) in both public and private universities in Nigeria. A standard self-structured questionnaire was used for the study. Cronbach alpha test for internal consistency of items was applied in checking the reliability of the instrument. The Cronbach alpha coefficient value was 0.92. The high co-efficient value was an indication of the internal consistency of the instrument, which was considered satisfactory for the study. The questionnaire comprised of 3 sections. Section A contained closed questions which were used to obtain the demographic data of the lecturers and students. Section B comprised of questions on perceived knowledge of graduates of the D-RAD curriculum. Section C captured information on perceived quality of radiographers that will be produced by the D-RAD curriculum. This required the participants to rate their level of perception on a 4-point Likert scale of Strongly Agree-4 to Strongly Disagree-1.

Statistical analysis was done using Statistical Package for Social Sciences version 23. Descriptive statistics like frequencies and percentages were used to describe the demographic characteristics of the participants. Mean and standard deviation were used to determine the perception of the lecturers and the students on the ability of the D-RAD curriculum to produce very knowledgeable and high-quality radiographers. A mean of 2.50 (which was the mean gotten from the 4-point Likert scale of Strongly Agree-4, Agree-3, Diagree-2, Strongly Disagree-1) and above was accepted. Independent sample t-test was used to ascertain if there was a statistically significant difference in the ratings of the two categories of lecturers on perceived knowledge and quality of radiographers that will be produced by the Doctor of radiography curriculum. A p-value less than 0.05 was used as a criterion for statistical significance.

Results

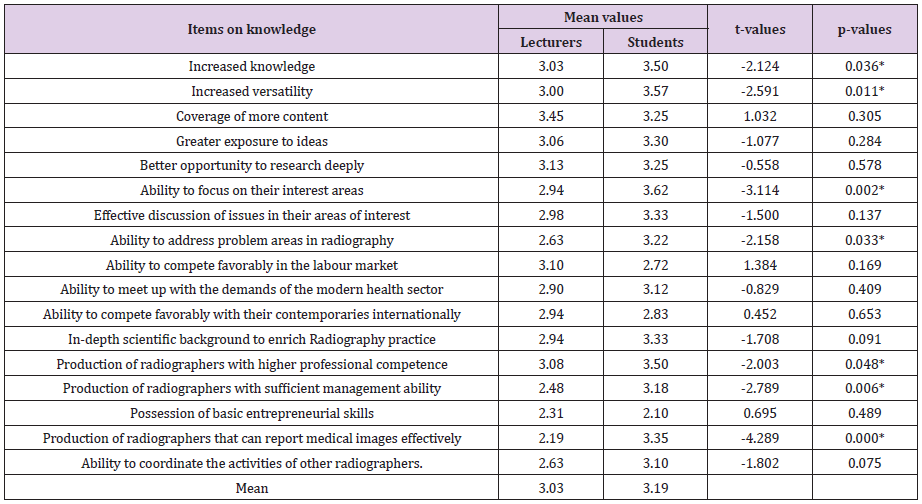
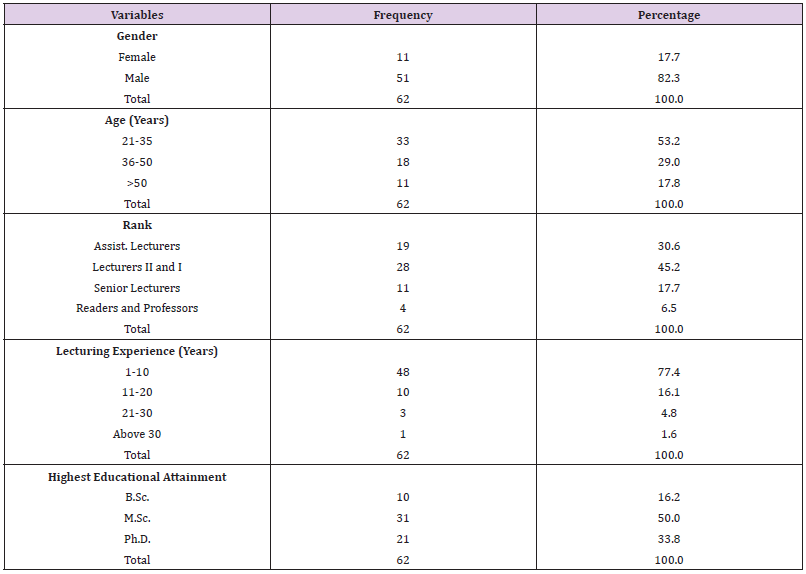
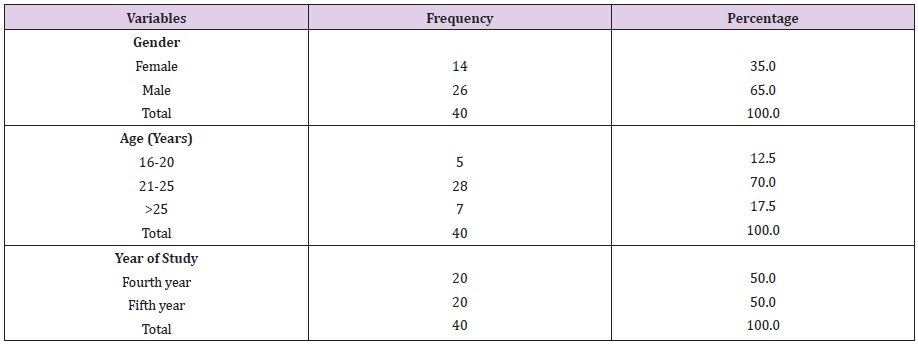
Table 1 shows the demographic data of the lecturers. The lecturers were categorized by gender, age, rank, lecturing experience, and highest educational attainment. From the table, a total of 51 male and 11 female lecturers (n=62) participated in the study. 33 lecturers (53.2%) were within the age range of 21- 35 years, 18 lecturers (29.0%) were within 36-50 years while 11 lecturers (17.8%) were above 50 years of age. Lecturers that had B.Sc as their highest educational attainment were 10 (16.2%) in number, those that had M.Sc were 31 (50%) in number while those with Ph.D were 21 (33.8%) in number. Table 2 shows the demographic data of the students. The students were categorized by gender, age, and level of study. From the table, a total of 40 students comprising 26 males (65%) and 14 females (35%) participated in the study. 5 students (12.5%) were within 16-20 years, 28 students (70%) were within 21-25 years while 7 students (17.5%) were above 25 years. 20 students (50%) were in their fourth year while 20 students (50%) were in their fifth year of study. Table 3 shows the mean comparison of lecturers and students’ perception on knowledge of graduates of the D-RAD curriculum. The lecturers had a mean of 3.03 while the students had a mean of 3.19 (A mean of >2.50 shows an agreement). This shows that both the lecturers and the students agree that the D-RAD curriculum will produce very knowledgeable radiographers.

Table 1: Demographic data of the lecturers.

Table 2: Demographic data of the students.

Table 3: Perception of lecturers and students on knowledge of radiographers.

*Significant p<0.05

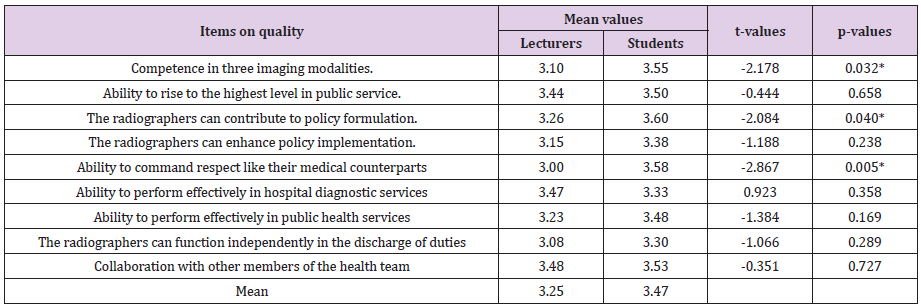
Table 4 shows the mean comparison of lecturers and students’ perception on the quality of radiographers that will be produced by the D-RAD curriculum. The lecturers had a mean of 3.25 while the students had a mean of 3.47 (A mean of >2.50 shows an agreement). This shows that both the lecturers and the students agree that the D-RAD curriculum will produce high quality radiographers that can better contribute to policy formulation and implementation. Table 5 shows independent sample t-test of the two categories of lecturers on the perceived knowledge of students of the D-RAD curriculum. The p-value was 0.056 (p>0.05). This implies that there is no significant difference in the mean ratings of perceived knowledge level between the higher cadre lecturers and the lower cadre lecturers. Hence, the null hypothesis was accepted. Table 6 shows the independent sample t-test of the two categories of lecturers on the perceived quality of professionals that will be produced by the D-RAD curriculum. The p-value was 0.063 (p>0.05). This implies that there is no significant difference in the mean ratings of the two categories of lecturers on the perceived quality of professionals that will be produced by the D-RAD curriculum. Hence, the null hypothesis was accepted.

Table 4: Perception of lecturers and students on quality of radiographers.

*Significant p<0.05

Table 5: Independent sample t-test of the two categories of lecturers on perceived knowledge of radiographers.

NS = Not Significant

Table 6: Independent sample t-test of the two categories of lecturers on perceived quality of professionals produced.

NS = Not Significant

Discussion

From this study, the graduates of the D-RAD curriculum will exhibit increased knowledge in all radiography specialties than the graduates of the basic bachelor’s curriculum. This is like the findings by Raupach et al. who carried out a study on the impact of an undergraduate cardio-respiratory curriculum on the knowledge of students [5]. A virtual problem-based learning environment for the students was created. It was discovered that additional problembased learning with an online module as part of an undergraduate cardio-respiratory curriculum led to an increased knowledge of the students. The knowledge of the students is expected to increase because online classes are almost as effective as physical contact classes. The result of this study is also in line with the study carried out by Morrison et al. that assessed the impact of a palliative care curriculum on knowledge of medical students [6]. Validated multiple choice palliative care pain management items were administered to measure the knowledge of the students. The students demonstrated a statistically significant increase in knowledge hence it was recommended that the curriculum be inculcated into the programme of the students. It is expected that the knowledge the students had after being exposed to the curriculum will be higher than their knowledge before exposure to the curriculum. The result of this study disagrees with the study done by Carolyn et al. who assessed the knowledge of medical students after completion of an integrated nutrition curriculum at Harvard Medical School [7]. A survey of the students was carried out and their knowledge was rated. It was discovered that there was no significant change in the nutrition knowledge of the students after receiving the integrated nutrition curriculum. This could be due to poor lecture delivery. If the instructional methods and materials are inadequate, the students might not add any new knowledge to what they knew before.

The result of this study showed that the D-RAD curriculum will be able to produce high quality radiographers that can better contribute to policy formulation and implementation. This is similar to the findings by Abdulaziz who carried out a study on radiography education and training and found out that a high quality program for radiographers is necessary to produce competent radiographers for both diagnostic and therapeutic working environment [8]. Hence, there is a need to review radiography education and training so as to fulfill the needs of the modern health sector. Also, Mumbo and Kinaro carried out a study on assessment of the relevance of curricula development in health training institutions [9]. According to the researchers, strengthening of health training institutions to increase the quality of health workers produced is very important and ensures access to universal quality health coverage. This entails design and constant reviews of their curriculum to meet the needs of the modern health sector.

Conclusion

Both the radiography lecturers and the students showed a positive perception towards the proposed D-RAD curriculum. The study discovered that the D-RAD curriculum will produce radiographers with higher knowledge and broader orientation in radiography. It is also perceived that the D-RAD curriculum will produce high quality radiographers that can contribute to policy formulation and implementation.

For more Articles on : https://biomedres01.blogspot.com/ 


Laboratory Evaluation of Ethanol Production from Jatropha Curcas as Compared to A Selected Sugarcane Variety (DB 7869)


Laboratory Evaluation of Ethanol Production from Jatropha Curcas as Compared to A Selected Sugarcane Variety (DB 7869)


Introduction

The world has been traditionally dependent on fossil fuels for industrial and other productive activities. However, the use of these types of fuels over the years has contributed to global warming, depletion of the ozone layer and the ultimate effect – climatic changes. To reduce global warming and other effects, there has been a concerted effort to produce a fuel that has minimum exhaust emissions. In the quest for an alternative energy source, organic materials are being exploited daily in search of a more efficient, cleaner and cheaper energy source (fuel). Ethanol mixed with 10% gasoline requires no modification for modern day vehicle. Although ethanol is used in the pharmaceutical industries, the main focus today is on fuel production. Ethanol is produced mainly by fermentation of fruits, vegetables, cellulosic plant materials, and plant/animal wastes. Jatropha, a perennial crop that has a higher efficiency of biofuel production than sugar cane as it gives 19,800–26,400 Energetic equivalent kwh/ha as opposed to 16,000 (Saccharum officinarum). Belonging to the family Euphorbiaceae, Jatropha is a plant that does not need much attention in its cultivation; it adapts to a wide range of climates and soils, produces seeds even after decades of planting, replenishes the soil it grows on and requires little or no fertilization. Sugarcane accounts for some 50,000 ha of land along the coast of Guyana. Yearly production rate ranges from 320,000 to 350,000 tonnes from 5 estates. Domestic consumption uses about 35,000 tonnes. The potential for commercial ethanol production from sugarcane has been extensively studied in recent years.
Fermentation is strongly influenced by temperature because the yeast performs best in a specific temperature range. The rate of fermentation increases with temperature in temperature range between 80oF (27oC) and 95oF (35oC). Above 95oF (35oC), the rate of fermentation gradually drops off and ceases altogether at temperature above 109oF (43oC). The actual temperature effects vary with different yeast strains and typical operating conditions are closer to 80oF (27oC) than 95oF (35oC). this choice is usually made to reduce ethanol loss by evaporation. For every 9oF (5oC) increase in temperature, the ethanol evaporation rate increases 1.5 times (Nathan, 1978). Saccharomyces cereviseae are most effective in pH ranges between 3.0 and 5.0. The cause of premature flocculation seems to be a function of the pH of the mash and the number of free calcium ions in the solution. Hydrated lime is sometimes added to adjust the pH. Sugar concentration There are two basic concerns that govern the sugar concentration of the substrate: [1] excessively high sugar concentrations can inhibit the growth of yeast cells in the initial stages of fermentation and [2] high ethanol concentrations are lethal to yeast. If the concentration of ethanol in the solution reaches levels high enough to kill yeast before all the sugar is consumed, the quantity of sugar that remains is wasted. Yeast growth problems can be overcome by using large inoculations to start fermentation. Saccharomyces strains can utilize effectively all of the sugar in solutions that are 16% to 22% sugar while producing beer that ranges from 8% to 12% ethanol by volume.
Yeast strains are divided informally into top and bottom yeast according to the location in the mash in which most of the fermentation takes place. The top yeasts Saccharomyces cereviseae, produce carbon dioxide and ethanol vigorously and tend to cluster on the surface of the substrate. Producers of distilled spirits use top yeasts of high activity to maximize ethanol yield in the shortest time (Campbell I. and Duffus J.H, Yeast, 1988).
Nutritional Requirement Yeasts are plants, despite the fact that they contain no chlorophyll. As such, their nutritional requirements must be met, or they cannot produce ethanol as fast as desired. An energy source such as carbohydrates must be provided for metabolism. Amino acids must be provided in the proper proportion and major chemical elements such as carbon, nitrogen, phosphorus and others must be available to promote cell growth [3]. According to Ochse (1980), “the young leaves may be safely eaten, steamed or stewed.” They are favored for cooking with goat meat, said to counteract the peculiar smell. Though purgative, the nuts are sometimes roasted and dangerously eaten. In India, pounded leaves are applied near horses’ eyes to repel flies. The oil has been used for illumination, soap, candles, adulteration of olive oil, and making Turkey red oil. Alternate uses of the oil include climatic protection, varnishes, organic insecticide, and medicine for skin diseases, cancer, piles, snakebite, paralysis, dropsy and many more. Nuts can be strung on grass and burned like candlenuts [4]. Mexicans grow the shrub as a host for the lac insect. Ashes of the burned root are used as a salt substitute [5,6] conclude that it has strong molluscicidal activity. Duke and Wain (1981) list it for homicide, pesticide, and raticide as well. The latex was strongly inhibitory to watermelon mosaic virus [7]. Bark used as a fish poison [8]. In South Sudan, the seed as well as the fruit is used as a contraceptive (List and Horhammer, 1969–1979). Sap stains linen and can be used for marking [9]. Little, Woodbury, and Wadsworth (1974) list the species as a honey plant.

Martial and Methods

Selection of the Best Media for Yeast Growth

500 ml of different culture medium was prepared as such as Potato Dextrose Agar (PDA), Potato Dextrose Yeast Extract Agar (PDYEA), Oatmeal Agar (OMA) and Universal Yeast Medium (YM.).

Effect of Various pH (4, 5, 6, 7, 8, 9) on the Growth of Yeast Culture

In this experiment broth was prepared based on the media the yeast grows best on. As observed both PDYEA and the Universal Yeast Medium showed the best growth in terms of colony count. However, as noted the PDYEA gave large colonies. And as such the broth of PDYEA was prepared.

Effect of Various Temperatures (20oC, 25oC, 30oC, 35oC, 40oC) on the Growth of Yeast

The Potatoes Dextrose Yeast Extract Broth (PDYEB) prepared by standard protocol and then poured in five (5) 125ml conical flasks, flasks were cotton plugged and autoclaved for 20 psi. Three (3) grams of yeast was added into each flask. The flasks were placed in water baths and regulated at temperatures (20oC, 25oC, 30oC, 35oC, 40oC) and maintained during this experiment. The broth was then filtered using Watman’s filter paper at the two days interval after observation to determine the mass growth of the culture. The initial weight and the wet weight of the filter paper were recorded. The filter paper was oven dried at 100 oC for one (1) hour and the dry weight was also recorded.

Results and Discussion

The number of colonies seen from culturing on PDYEA was much more in quantity and size as compared to all the other media used in this experiment. PDA followed next with a consistent increase in colonies from week 1 to 4; then a drastic increase in week 5 and continued with a steady increase until week 7. Figures 1-4. However, PDA produced smaller colony size. UYM was third in line to produce the largest quantity of colonies with a steady increase up to week 3 followed by a sharp increase unto week 6 then a gradual increase into week 7. The colony size obtained from UYM was smaller than PDYEA but larger than PDA. OMA on the other hand produced the least number of colonies with the smallest size [10,11]. As shown in Table 1 pH has a great influence on the growth of mycelium (Sacchromyces cerevisiae). pH 7 has dominated throughout the growth period (seven days). pH 6 on the other hand did fairly well with the lowest results obtained from pH 4 and 8. Yeast (Sacchromyces cerevisiae) grows best on pH ranging from 5-6, but conditions in Guyana are different, as such the pH that was most outstanding throughout the testing period was 7 and as such this was selected to culture the yeast. At temperature 30oC, from day 1 to day 7 the growth of mycelium exceeded all the other temperatures. It can be safely concluded that temperature 30oC, is the most appropriate temperature required for the yeast’s rapid growth and development, as such this temperature was used throughout the yeast culturing. Yeast (Sacchromyces cerevisiae) grows best at temperature ranging from 27oC-35oC and this experiment brought that out. Figures 5-7 Treatments 1 & 2 were not significantly different from each other but were significantly different from the rest of the treatments. Treatments 4 & 5 were not significantly different from each other but were different significantly from the other treatments. Treatment 3 on the other hand was significantly different from all the treatments. There was no significant difference amongst treatments 2, 3 & 4 however; these treatments were significantly different from treatments 1 & 5 (Tables 1-5).

Figure 1: Growth of Yeast on Different media.
PDYEA: Potato Dextrose Yeast Extract Agar
PDA: Potato Dextrose Agar
OMA: Oatmeal Agar
UYM: Universal Yeast Medium

Figure 2: Ethanol Yield from J. leaves (Mean-ml). Treatments:
Trt 1= 1.0 ml Yeast broth
Trt 2= 1.5 ml Yeast broth
Trt 3= 2.0 ml Yeast broth
Trt 4= 2.5 ml Yeast broth
Trt 5= 3.0 ml Yeast broth

Figure 3: Ethanol Yield from J. seeds (Mean-ml).

Figure 4: Ethanol Yield from seeds and J. leaves (Mean-ml).

Figure 5: Ethanol Yield from sugarcane (Mean-ml).

Figure 6: Mean Ethanol Yield for the different materials.

Figure 7: A comparison of Jatropha curcas and Sugarcane ethanol production (ml).

Table 1: Effect of pH (4, 5, 6, 7, 8, 9) on the growth of Yeast Culture in PDYEA (dry weight in grams).

Table 2: Effect of Temperature (20oC, 25oC, 30oC, 35oC, 40oC) on Yeast growth (wet weight).

Table 3: Showing the various substances (Alcohols, Esters) present in the ethanol of Jatropha leaves (g/hl).

Note: e4 = 1 x 10000
i.e. = 1.6317e4 = 1.6317x10000 = 16317

Table 4: Showing the various substances (Alcohols, Esters) present in the ethanol of Jatropha seeds (g/hl).

Table 5: Showing the various substances (Alcohols, Esters) present in the ethanol of Sugarcane variety DB 7869 (g/hl).

Treatment 5 was significantly different from all the other treatments as so was treatment 1. There was no significant difference amongst treatments 1, 2 & 3. Treatments 3 & 4 were not significantly different and so were treatments 4 & 5. Treatments 1, 2 & 3 were not significantly different from each other but were different significantly from treatments 4 & 5. On the other hand, treatments 4 & 5 were not significantly different. There was no significant difference between the materials, Jatropha leaves and Sugarcane variety DB 7869, however when compared to Jatropha seeds, which gave the lowest overall production of ethanol, was significantly different from the other materials used. Jatropha leaves/seeds was also significantly different from all other treatments as well. There was a steady increase in ethanol yield from the various materials used as the level of yeast broth increases. Sugarcane variety DB 7869 gave the highest value for total alcohol [Alc (vol%)] for all the treatments used followed by Jatropha leaves, however Jatropha seeds tested the lowest in terms of alcohol strength. This material, Jatropha leaves, has numerous substances (alcohols and esters) and in the largest quantity in g/hl present in all the treatments which is an indication that the ethanol produced from this material is not pure. In Jatropha seeds’ samples, many alcohols and esters are also found but in smaller quantities in g/hl, this as well is an indication that the ethanol produced from this material is not pure. This as well suggests that the ethanol produced from this material is not pure. Sugarcane variety DB 7869 has the least amount of substances (alcohol/esters) and in small quantities. The ethanol produced from this material is purer than all the others because of the lower proportion of alcohols/esters1

Summary

Jatropha curcas (seeds, leaves) gave the highest yield of ethanol as compared to Sugarcane variety DB 7869. As the level of yeast broth increases the production of ethanol also increases. However, Sugarcane variety DB 7869 is purer than Jatropha curcas in terms of other alcohols/esters present. Nonetheless, Jatropha curcas contains the alcohol “methanol” which is also used as a biofuel.

For more Articles on : https://biomedres01.blogspot.com/ 


Thursday, April 28, 2022

Immunomodulatory Effect of Lactoferrin on Mucosal Immunity of Uterus in Pregnant Rat


Immunomodulatory Effect of Lactoferrin on Mucosal Immunity of Uterus in Pregnant Rat


Introduction

Disturbances in early Pregnancy and endometrial receptivity are the major causes of subfertility and also impact placental improvement and fetal growth [1], which has implications for the phenotype of the offspring and capacity to withstand health challenges in later life [2]. Key regulators of the conception and implantation events are maternal tract cytokines and immune cells within the female reproductive tract, while the receptivity of the endometrium is dependent on immune cells present at the implantation site [3]. In mice and rats, implantation was between days 4 and 5 of Pregnancy, considering the first day of Pregnancy as the day on which a vaginal plug or spermatozoa are present in the vagina [4]. Lactoferrin (LF) was a very important part of the human body’s natural defense system [5]. Lactoferrin is a cellsecreted mediator that links innate and adaptive immune function in mammals. It is a pleiotropic molecule that directly supports the influence of presenting cells for the development of T-helper cell polarization [6].

In vitro, Lactoferrin stimulates the growth of lymphocytes [7], natural killer activity [8], and the release of interleukin-8 (IL- 8) from neutrophils. Further, Lactoferrin stimulates the release of IL 1, IL 2, and tumor necrosis factor (TNF) from leukocytes or complement activation [9]. LF and its derivatives have pleiotropic functions, including broad-spectrum antimicrobial activity, regulation of cell growth and differentiation, and intonation of inflammatory as well as humoral and cellular immune responses [10]. During Pregnancy, the peripheral-specific immune response is shifted away from a type 1 cellular immune response towards a type 2 humoral immune response [11]. During rat pregnancy, both monocyte and granulocytes increased in number in circulation [12]. There is an absolute monocities during Pregnancy, especially in the first trimester, but decreases as gestation advances. Monocytes help in preventing fetal allograft rejection by infiltrating the decidual tissue from seven to twenty weeks of gestation, possibly through prostaglandin E2 mediated immunosuppression [13].

In fact, the uteroplacental tissue produces an array of antiinflammatory cytokines as interleukin 10 that are expressed in the uterus, oviducts, and ovaries of cycling mice and during Pregnancy in the uterine myometrium and cervix [14-20]. Thus, the balance between pro-inflammatory cytokines as tumor necrosis factor (TNF) and interleukin 1a and anti-inflammatory cytokines is essential to a successful pregnancy outcome [21]. IL1A is one of the major cytokines that participate in the local regulation of many reproductive affairs. IL1A also plays a role in regulating ovulation [22]. TNF-α has been shown to influence hormone synthesis, placental architecture, embryonic and follicle development, steroidogenesis, uterine cyclicity, placental differentiation, and parturition [23,24]. [25-30] hypothesized that Pregnancy is a stressful condition as it leads to increased levels of oxidants and therefore reduces Total Antioxidant Capacity (TAC). C- Reactive Protein (CRP) is a sensitive marker of systemic inflammation and is primarily synthesized in hepatocytes in response to infection and tissue injury. Production of CRP is stimulated by the release of proinflammatory cytokines, including interleukin-1, interleukin-6, and tumor necrosis factor-alpha. Although sometimes referred to as an acute-phase reactant, CRP accompanies both acute and chronic inflammatory disorders [31].

[32] showed that progesterone reduced macrophage migration into the murine uterus, while [33-36] showed that estrogen, progesterone, and human chronic gonadotrophin did not affect migration of macrophage cells in guinea pigs. [37-45] showed that progesterone(p4) withdrawal is associated with the initiation of labor. The effect of P4 on immunity has been revealed, mainly at pregnancy concentrations. These effects are primarily mediated via the intracellular P4 receptors (PR), PR-A, and PR-B, which act as transcription factors [46]. Upon Pregnancy, estrogen is shown to promote uterine blood flow, myometrial growth, stimulate breast growth, and at term, promote cervical softening and expression of myometrial receptors. Also, estrogen was suggested to affect different immune cell populations in their number and function and thereby contribute to fetal tolerance [47]. Leukocytic infiltration during early Pregnancy indicated that decidual natural killer cells makeup around 30% of the uterine stromal compartment, mainly at the implantation site where they are found scattered throughout the stroma and thickly clustered around glands and spiral arteries in the uterus [48]. So, the present study aimed to evaluate the immunological effect of Lactoferrin on some cytokines, immune cells, and mucosal immunity of uterine tissue in the rat during pregnancy.

Materials and Methods

All procedures of laboratory work carried out under guidelines for biosecurity and infection control according to Guidelines for Veterinary personal biosecurity (2013) & Australian Veterinary Infection control manual (2014).

Experimental Animals

The study was conducted on twenty-four mature female Sprague Dawley rats and six mature male rats weighing 250 g. B. wt, divided into two groups, twelve female rats in each group. All animals were purchased from a laboratory animal house in, Helwan – Egypt. They were housed in separate cages in the physiology department, Faculty of veterinary medicine, Mansoura University. They were kept in a controlled environment for two weeks before the experiment for accommodation; maintained under normal condition, and rats were fed a basal control diet; water and diet were given ad-libitum throughout the experimental period. All females were examined for the detection of the stage of the estrus cycle by taking vaginal smear and examine it under the microscope to determine which female in the estrous phase to determine the best time of insemination according to the methods of [49].

Diet and Additives

The basal diet was prepared by the Faculty of Agriculture, Mansoura University, according to standard levels of NRC. The diet was produced in the form of pellets and was admitted to all groups of the study.

Lactoferrin

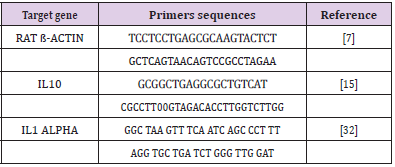
Bovine Lactoferrin (BLF), an immune-modulatory substance, was purchased from Sigma company; the commercial name is L9507 in the form of a powder that was dissolved by distilled water and was prepared to be given to twelve mature female rats (lactoferrin group) in a dose of 50microgram/kg orally by stomach tube every day before mating by one week and persisted after mating till one week according to (Yamauchi et al., 2000). Oligonucleotide primers used in SYBR Green real-time PCR: They are shown in Table 1.

Table 1: Oligonucleotide primers and probes used in SYBR Green real-time PCR.

Blood and Tissue Samples

At different time points (5hrs,1 day,3 days, and 7 days) after mating, blood samples were collected from retro-orbital venous plexus and separated into two parts, one for hematological assay and the other for serum separation that stored frozen until hormonal and biochemical assay. Uterine tissue samples were collected after anesthesia and slaughter of three rats of two groups at each time point and stored frozen for PCR assay and other tissue parts stored in 10% neutral buffer formaldehyde for histopathological examination.

PCR

RNA Extraction, according to (Yuan, et al. [50]): RNA extraction from tissue samples was applied using QIAamp RNeasy Mini kit (Qiagen, Germany, GmbH) when 30 mg of the tissue sample was added to 600 μl RLT buffer containing 10 μl β-mercaptothion per 1 ml. For the homogenization of samples, tubes were placed into the adaptor sets, which are fixed into the clamps of the Qiagen tissue Lyser. Disruption was performed in 2 minutes high-speed (30 Hz) shaking step. One volume of 70% ethanol was added to the cleared lysate, and the steps were completed according to the Purification of Total RNA from Animal Tissues protocol of the QIAamp Rneasy Mini kit (Qiagen, Germany, GmbH). N.B. On column DNase, digestion was done to remove residual DNA.

Preparation of PCR Master Mix according to Quantitect SYBR:

a) Oligonucleotide Primers: Primers used were supplied from Metabion (Germany) and are listed in Table 1.

b) cDNA Synthesis: RNA was reversely transcribed into cDNA using Thermo Scientific Revert Aid Reverse Transcriptase (Thermo Scientific). Where 20- μl reaction containing 4 μl of the 5X Reaction Buffer, 1 μl of Revert Aid Reverse Transcriptase (200 U/ μL), 0.5 μl of (20 U) Thermo Scientific™ RiboLock Rnase Inhibitor (#EO0381), 0.5 μl (20 pmol) Random hexamer (#SO142), 2 μl of dNTP Mix [10 mM each (#R0191)] 10 μl of water, and 2 μl of RNA template. The reaction was performed in an Applied biosystem 2720 thermal cycler. The mixture was incubated for 10 min at 25°C, followed by 60 min at 42°C.

c) SYBR Green rt-PCR: Primers were utilized in a 25- μl reaction containing 12.5 μl of the 2x QuantiTect SYBR Green PCR Master Mix (Qiagen, Germany, GmbH), 0.5 μl of each primer of 20 pmol concentration, 10.5 μl of water, and 1 μl of cDNA template. The reaction was performed in a Stratagene MX3005P real-time PCR machine. A primary denaturation step was done at 94OC for 15 min, followed by 40 cycles of 94°C for 15 sec., 60°C for 30 sec. and 72°C for 30 sec. A Dissociation curve was performed for one cycle, including 94OC for 1 min., 60°C for 1min., and 94°C for 1 min.

d) Analysis of the SYBR Green rt-PCR Results: Amplification curves and ct values were determined by the Stratagene MX3005P software. To estimate the variation of gene expression on the RNA of the different samples, the CT of each sample was compared with that of the positive control group according to the “ΔΔCt” method stated by [51].

Biochemical Assay

1-Estrogen: Estrogen was diagnostic by using IMMULITE and IMMULITE 1000 Analyzer for the quantitative measurement of Estradiol in serum, as an aid in the differential diagnosis of amenorrhea, and monitoring8 of ovulation induction with and without stimulating in Assisted Reproductive Technology (ART) according to [52].

2-progesterone: Progesterone was diagnostic by using IMMULITE and IMMULITE 1000 Analyzer for the quantitative measurement of progesterone in serum, as an aid in the differential diagnosis of amenorrhea, and monitoring of ovulation induction with and without stimulating in Assisted Reproductive Technology (ART) according to [53].

3- TAC (Total Antioxidant Capacity): Total antioxidant capacity is measured by the colorimetric determination method by ready-made diagnostic kits provided by Bio-diagnostic, according to [54].

4- TNFα (Tumor Necrosis Factor): TNFα was estimated by using ready-made Rat Tumor Necrosis Factor-α (TNFα). ELISA Kit presented by Quantikine Company according to [55].

5- CRP (C- Reactive Protein): The rapid latex agglutination test is for the qualitative screening and quantitative determination of C-Reactive Protein (CRP) in serum presented by ATLAS MEDICAL LATEX Kit, according to [56].

Tissue Sampling

Both uterine horns were excised from all pregnant rats and one sample from each horn was taken and fixed immediately in 10% neutral buffered formalin solution. All specimens were routinely processed in ascending grades of ethyl alcohol (80%, 90%, 100%), cleared in xylene, and embedded in paraffin wax to prepare 5μm thick paraffin sections. Sections of 5 μm thickness were cut and picked up on uncoated slides, dried, deparaffinized with xylene (3x3minutes) and rehydrated with graded alcohol (5x2minutes), washed and stained with H&E according to [57], and stained with Giemsa stain to determine eosinophil cell count in uterine tissue sections. Uterine sections from day 7 of gestation were additionally stained with Masson’s trichrome. The stained sections were dehydrated in absolute ethyl alcohol, cleared in xylene, and mounted with Mount-Quick liquid cover glass medium to the surface of the slides. Histological changes were examined by light microscopy (binocular, Olympus). Histological pictures were picked up using a Digital camera (Canon 5 megapixels, 3.2x optical zoom).

Histopathological Examination and Statistical Analysis

The data of histopathological examination of morphometric measurements of epithelial height and diameter of uterine glands were subjected to student T-test to differentiate between control and lactoferrin treated group to compare the difference between means. Data were expressed as means ± standard errors. The difference between means was considered significant when (P < 0.05). The remaining data obtained for rats of the two experiments were expressed as means ± SD. Statistical Analysis of data was carried out by the computer package program (SPSS,1994) version 16, using the two-way Analysis of variance M-ANOVA between variables at group level and time level followed by Duncans Multiple Range Test (DMRT) for testing the significant differences between variables [58].

Results

Effect of Lactoferrin on Total Leukocytic Count (WBCS×103 /μl)

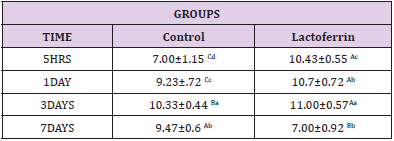
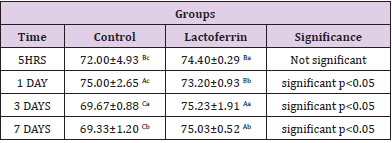
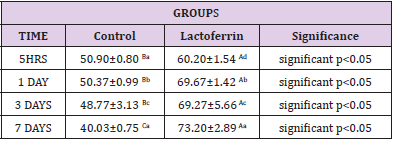
As shown in Table 2 results indicated an increase in Wbcs at 5hrs, 1day, and 3 days after mating in the lactoferrin group compared with the control group at the same time.

Table 2: Effect of Lactoferrin on total leukocytic count (WBCS×103 /μl).

Effect of Lactoferrin on Neutrophil%

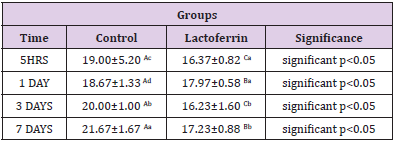
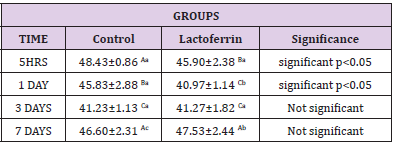
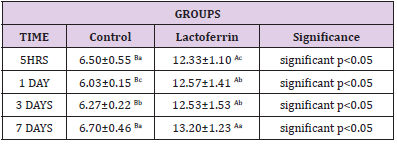
As shown in Table 3, results indicated an increase in neutrophil percent in the lactoferrin group at 5hrs, 3 days, and 7 days after mating compared with the control group.

Table 3: Effect of Lactoferrin on neutrophil%.

Effect of Lactoferrin on Lymphocyte%

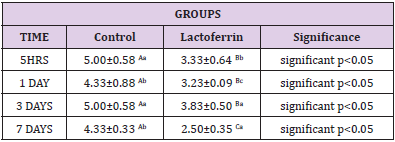
As shown in Table 4, results demonstrated a decrease in lymphocyte percent in the lactoferrin group at 5hrs, 1day, 3 days, and7 days after mating.

Table 4: Effect of Lactoferrin on lymphocyte%.

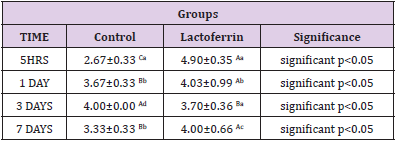
Effect of Lactoferrin on Eosinophil%

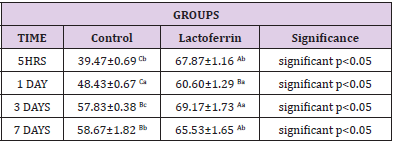
As shown in Table 5, results indicated that the eosinophil percent increase in Lactoferrin at 5hrs, 1day, and 7 days.

Table 5: Effect of Lactoferrin on eosinophil%.

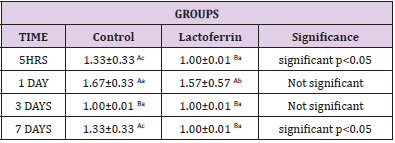
Effect of Lactoferrin on Basophil%

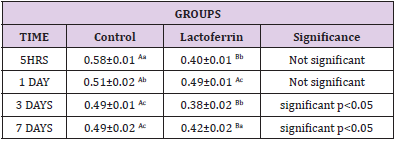
As shown in Table 6, results indicated that basophil decrease in the lactoferrin group at 5hrs, 1 day, and 7 days.

Table 6: Effect of Lactoferrin on basophil%.

Effect of Lactoferrin on Monocyte%

As shown in Table 7, results indicated that the monocyte percent decrease in the lactoferrin group at 5hrs, 1day, 3days, and 7 days.

Table 7: Effect of Lactoferrin on monocyte%.

Effect of Lactoferrin on Estrogen(ng/ml)

As shown in Table 8, results indicated that estrogen decrease in the lactoferrin group at 5hrs and 1 day when compared to the control group.

Table 8: Effect of lactoferrin on estrogen(ng/ml).

Effect of Lactoferrin on Progesterone (ng/ml)

As shown in Table 9, results indicated an increase in progesterone hormone in the lactoferrin group at 5hrs, 1 day, 3 days, and 7 days after mating when compared to the control group.

Table 9: Effect of Lactoferrin on progesterone (ng/ml).

Effect of Lactoferrin on Total Antioxidant Capacity (TAC) (μ mol/L):

As shown in Table 10, results indicated a decrease in the lactoferrin group at 5hrs, 1day, 3days, and 7 days when compared with the control group.

Table 10: Effect of Lactoferrin on total antioxidant capacity (TAC) (μ mol/L).

Effect of Lactoferrin on Tumor Necrosis Factor (TNF) (pg/ml)

As shown in Table 11, results indicated an increase in TNF at 5hrs, 1 day, 3 days, and 7 days in the lactoferrin group when compared to the control group.

Table 11: Effect of Lactoferrin on tumor necrosis factor (TNF) (pg/ml).

Effect of Lactoferrin on C-Reactive Protein (mg/L)

As shown in Table 12, results indicated an increase in C reactive protein in the lactoferrin group at 5hrs, 1day, 3days, and 7 days when compared to the control group.

Table 12: Effect of Lactoferrin on C-reactive protein (mg/L).

Effect of Lactoferrin on IL1a and IL10 by Real-Time PCR:

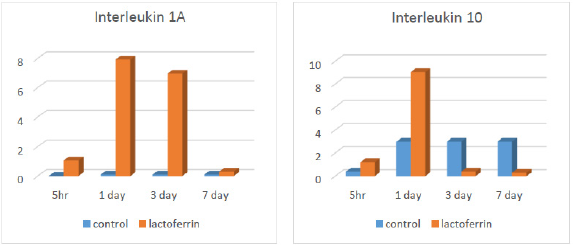
As illustrated from Figure 1, results indicated an increase in interleukin 1A in the lactoferrin group at 5hrs, 1 day, and 3 days after mating when compared to the control group. At the same time, results indicated an increase in interleukin 10 in the lactoferrin group at 5hrs and 1 day after mating but decreased at 3 days and 7 days when compared with the control group.

Figure 1: Effect of Lactoferrin on IL1a and IL10 by real-time PCR.

Histopathological Analysis for Rat Uterus

Rat Uterus After 5 Hours of Gestation

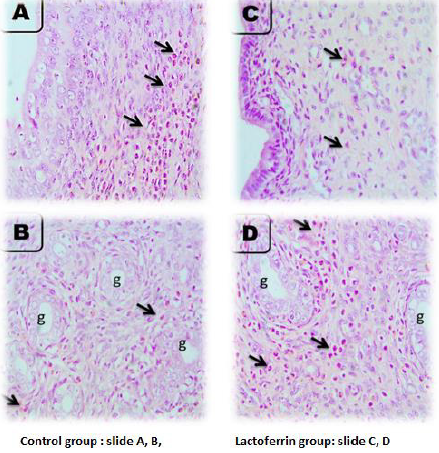
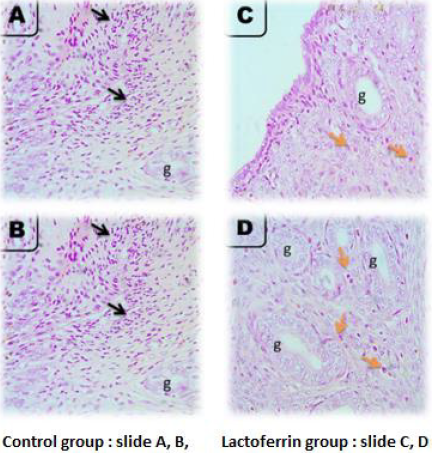
As illustrated from Figure 2, the microscopic picture shows rat uterus after 5 hours of gestation shows heavy eosinophils infiltration in superficial endometrium (arrows) (A, B) and in between uterine glands (g) (arrows). Few stromal cell density and very few eosinophils’ infiltrations are seen in superficial endometrium (arrows), and heavy eosinophils infiltrations are seen in between uterine glands (g) (arrows) in Lactoferrin treated rats I. Control (slide A and B), Lactoferrin group (C and D).

Figure 2: Microscopic picture shows rat uterus after 5 hours of gestation.

Rat Uterus at 1 Day of Gestation

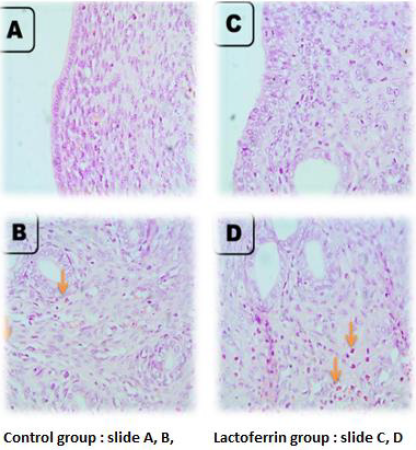
As illustrated from Figure 3, the microscopic picture shows rat uterus at 1 day of gestation shows focal PMNs infiltration in superficial endometrium (black arrows) (A) and fewer eosinophils between the uterine glands (g) than after 5 hours (orange arrows) (B) in control rats. Very few eosinophils’ infiltrations are seen in superficial endometrium (orange arrows) (C), and between uterine glands (g) (orange arrows) (D) in Lactoferrin treated rats. H&E, X: 400.Note: density of uterine glands increased in Lactoferrin treated rats (D) when compared with (B). H&E. The Control group presented in (slide A and B) and Lactoferrin group presented in slide (C and D).

Figure 3: Microscopic picture shows rat uterus at 1 day of gestation.

Rat Uterus at 3 Days of Gestation

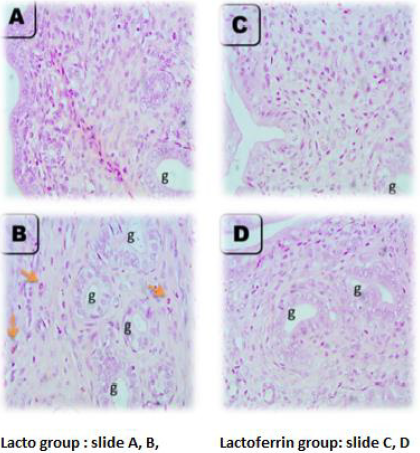
As illustrated from Figure 4, the microscopic picture shows rat uterus at 3 days of gestation shows minimal leukocytic cells infiltration in superficial endometrium (A) and between the uterine glands (orange arrows) (g) (B) in control rats. Few eosinophils’ infiltrations are seen in superficial endometrium (orange arrows) (C), and between uterine glands (g) (orange arrows) (D) in Lactoferrin treated rats. H and E. Microscopic picture shows rat uterus at 3 days of gestation shows eosinophils infiltration in the myometrium (arrows) (A) in control rats and Lactoferrin treated rats (C). Uterine glands in control (B) and Lactoferrin treated rats(D).

Figure 4: Microscopic picture shows rat uterus at 3 days of gestation.

Rat Uterus at 7 Days of Gestation

As illustrated from Figure 5, the microscopic picture shows rat uterus at 7 days of gestation shows superficial endometrium (A) and uterine glands (g) with few eosinophils’ infiltration (orange arrows) (B) in control rats. Few eosinophils’ infiltrations are not seen in superficial endometrium (C) but seen between uterine glands (g) (orange arrows) (D) in Lactoferrin treated rats. Note: density and diameter of uterine glands (g) increased in (D) in Lactoferrin treated rats, H&E. Control (slide A and B), Lactoferrin group (C and D).

Figure 5: Microscopic picture shows rat uterus at 7 days of gestation.

Effects of Lactoferrin Administration to Pregnant Rat on Eosinophil Count in Uterine Tissue at a Different Time (5hrs, 1day, 3days, and 7 days) of Pregnancy

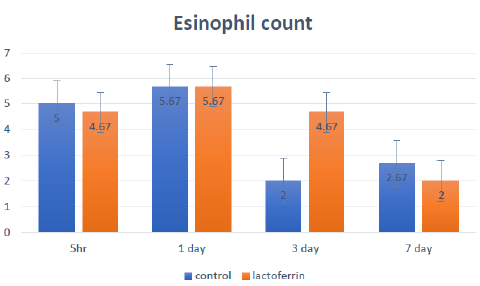
The effects of lactoferrin administration to pregnant rats on eosinophil count in uterine tissue at a different time (5hrs, 1day, 3days, and 7 days) of Pregnancy is shown and summarized in Figure 6.

Figure 6: Effects of lactoferrin administration to pregnant rat on eosinophil count in uterine tissue at different time (5hrs, 1day, 3days and 7 days) of Pregnancy

Discussion

From the results, we should remember that we are dealing mainly with concentrations of a number of immunity markers either wbcs in plasma or immunity markers , hormones and cytokines in serum to detect effect of LF on immunity mainly during early period of pregnancy. Results of the present investigation were recorded in (Tables 2-7) showed that white blood cells number increased at 5hrs and 3 days after insemination and decreased at 7 days after insemination in the lactoferrin group when compared with the control group. Lf was a natural compound of mammalian secretions which have a protective effects range from antimicrobial activities against variety of pathogens, including bacteria, viruses, fungi and parasites, to anti-inflammatory effect. Its functions rely not only on the capacity of Lf to bind iron but also on its immunomodulatory effect by its cellular and molecular mechanisms with both host and pathogen. Lf can interact with antigen presenting cells, reduce excessive inflammation and stimulate host immune responses, as well as identifying cell targets and receptors and this was important in the maintenance of immune system homeostasis [59]. Neutrophils increased at 5hrs, 3days, and 7 days after insemination, while basophil and eosinophil increased at 5hrs, 1 day, and 7 days after insemination in the lactoferrin group.

While, Lymphocyte and monocyte showed a significant decrease in the lactoferrin group at 5hrs, 1 day, 3 days, and 7 days after insemination. This result agreed with [60], who showed that Lactoferrin had a role in regulating innate and adaptive immune response, regulating the secretion of cytokines and regulated growth, differentiation, and activation of different leukocyte cells and so increased the number of circulated leukocytes. This agrees with [61], who showed that both monocytes and granulocytes increased and immune systems activated during Pregnancy in the rat. [62] reported that Lactoferrin regulated the immune system by stimulating endometrial and stromal cell proliferation and stimulating immune cells against antigen as well as [63] reported that Lactoferrin increased recruitment of neutrophil in mice circulation. Besides, [64] recorded that Lactoferrin increased the number of natural killer cells and modulated myelopoiesis with increased phagocytosis against a specific antigen. In the same respect, [65] showed that WBCs increased during rat pregnancy, and this was inconsistent with the significant increase in the number of white blood cells as presented in (Table 2).

Estrogen increased in the lactoferrin group, particularly at 7 days after insemination, and showed decreased at 5hrs and 1day after insemination. Estrogen was considered an immune modulator substance that could improve the immune response of the female reproductive tract in rodents, as shown by [66]. This agreed with (Hamid et al. 2012) showed that rats implantation period was initiated on day 5 and completed by day 7 of the pregnancy and during this implantation period, the dominant hormone modulator to morohological and functional changes were estrogen and progesterone and this may explain why estrogen increased at our study at 7 days taking into consideration the difference between species as difference between rat and human in time of endometrium changes and hormones secretion as shown [67] showed that estrogen played a pivotal role in early Pregnancy in mice as, during the first two days after insemination, the preovulatory estrogenstimulated proliferation of the luminal and glandular epithelial cells in addition to potentiated with progesterone hormone that secreted from corpus luteum and stimulated stromal cell proliferation on 4 days which was the day of the implantation process. Furthermore, [68] showed that there was a close relationship between estrogen and Lactoferrin as an estrogen-regulated expression of Lactoferrin in the endometrial epithelium of rat, particularly along all stages of the estrus cycle as well as lactoferrin levels changed with the change in estrogen level and so this could explain the increase in estrogen hormone in lactoferrin group after insemination.

Progesterone increased at 5hrs, 3 days, and 7 days in the lactoferrin group compared to the control group, as showed in Table 10. [69] reported that progesterone hormone inhibited estrogen hormone and decreased lactoferrin gene expression in uterine epithelial and stromal cells by controlling progesterone receptor and affecting estrogen receptors in vitro using uterine rat tissue. Also, [70] reported that progesterone was secreted in hamsters at the preovulatory stage from an extra luteal tissue source for allowed characteristics appearance of estrus behavior, and this could explain the increase in progesterone hormone in the lactoferrin group. Total Antioxidant Capacity(TAC) increased in the lactoferrin group at 1 day after insemination when compared to the control group as showed in Table 10 and this agrees with [71] who showed that Lactoferrin (LF) was believed to be safer than the drugs currently used for hypertension treatment due to its antioxidant effect. It has been reported that two weeks of lactoferrin supplementation has been able to increase the hydrophilic antioxidant capacity in healthy humans [72]. Besides, [73] suggested that Lactoferrin contributed to oxidoreductive reactions at the cell membrane, and LF had an antioxidant effect on red blood cells through inhibition of lipid peroxidation and hemolysis. In the same respect, LF was an important specialized iron scavenger, and its antioxidant activity was most likely related to its ability to bind ferrous and ferric ions. Thus, LF may inhibit the iron-catalyzed formation of hydroxyl radicals.

Tumor necrosis factor (TNF) decreased at 3 days and then increased at 5hrs, 1 day, and 7 days in the lactoferrin group as presented in Table 11. This increase may be due to secretion of TNF at early gestation as that different cytokine profiles might be beneficial or harmful at different stages of Pregnancy as TNF-a which was proinflammatory cytokines seem to be crucial during the implantation process, whereas high levels of these cytokines may be harmful later in Pregnancy. Also, showed that tumor necrosis factor was multi potent cytokines and had an essential role during early Pregnancy by the stimulated embryo and placental growth. In contrast, revealed that TNF had an adverse impact on Pregnancy and inhibited blastocyst growth in the rat. This conflicted impact was shown by reported that the timing of secretion, the concentration of TNF, and stimulatory signals directed TNF to be either useful or harmful toward Pregnancy. Nakashima 2012 suggested that stimulation of Th 1 dominance directed TNF to stimulate lymphokine-activated killer cells that destructed trophoblast cells and caused pregnancy loss. Moreover, Clark 1998 suggested that TNF stimulated maternal immune rejection to the embryo through the affected blood supply by applying vasculitis. This data could explain the significant increase in TNF in the lactoferrin group, particularly at 5hrs, 1 day, 3 days, and 7 days of Pregnancy. C-Reactive Protein (CRP) increased at 5hrs, 1 day, 3 days, and 7 days of Pregnancy in the lactoferrin group when compared to the control group, as shown in Table 12. This in agreement who found a slight rise in the CRP values throughout Pregnancy, and who detected maximal concentrations of CRP at 24-48 hours after the inducing stimulus or infection and so may be increased due to presence of sperm and then the presence of embryo as immune response. Moreover, CRP increased in inflammation and applied a proinflammatory function and stimulated secretion of cytokines and granulocyte-macrophage colony-stimulating factor as well as had anti-inflammatory functions as prevented migration and adhesion of neutrophil to endothelial cells to provide immune tolerance and aided in implantation and this meant that presence of embryo or sperm caused inflammatory response and stimulated secretion of CRP. Interleukin 1a (IL1A) increased at 5hrs, 1day, and 3 days in the lactoferrin group, as showed in Figure 1. This in agreement with, who showed that the interleukin1(IL1) family as IL1alpha and IL1 b secreted by early embryonic signals and aided in the preparation of a receptive maternal endometrium and may play an important role in embryo implantation.

Interleukin 10 increased in the lactoferrin group, particularly at 5hrs and 1 day of Pregnancy as shown in Figure 1. This in agreement with recorded that an up-regulation of anti-inflammatory IL-10 was found after lactoferrin (LF) administration in rats with colitis. Moreover, reported that bovine LF regulated cytokines production by splenocytes of obstructive jaundice rats. Also, LF enhanced the secretion of the anti-inflammatory cytokines IL-10 and IL-4 and reduced colitis in rats. Interleukin 10 entered in the initial formation of the fetus and supported implantation during the early period of Pregnancy as proved by Tewari 2009 that IL-10 role in Pregnancy was a potent protector against vascular dysfunction that was associated with hypertension and inflammation during Pregnancy as contributing to the regulation of maternal immune tolerance during Pregnancy and helped in the extra villous trophoblast and endothelial cell formation. Besides, illustrated that interleukin 10 in mice reached high levels in the first and second trimester of Pregnancy for improving placental growth and supporting trophoblast invasion. Histopathological examination of uterine tissue specimens presented in Figures 2-5 showed that the rat uterus was formed of three layers; endometrium, myometrium, and perimetrium. The endometrial glandular epithelium was a tall simple columnar with rounded basal nuclei. Few Polymorphonuclear Cells (PMNs) were seen in the lumen of the uterus and uterine glands.

The stroma contained spindle-shaped stromal cells and blood vessels. The myometrium was formed of inner circular and outer longitudinal smooth muscle layers with numerous blood capillaries in the perimetrium. Histopathological examination after administration of Lactoferrin to female rats revealed that there was an increase in eosinophilic and neutrophil infiltration in endometrium and myometrium, increased stromal cells, and increased in epithelial cell thickness and folding at 5hrs, 1day, 3 days, and 7 days after insemination. This agreed showed that there was a dramatic increase in cellular proliferation, endometrial tissues proliferation neovascularization, and blood flow during early rat pregnancy. Also, Guerra-Infante 1999 showed that neutrophil cells increased in the count but decreased in phagocytic activity during Pregnancy. Moreover, there was an increase in a blood vessel with decreased congestion and an increase in the number and diameter of the uterine gland when compared with the control group. This may provide nutrition to the embryo at early Pregnancy as the obtained results are declared and presented in Figures 2-5. This result inconsistency with Filant and Spencer, 2013 showed that uterine glands and blood vessels supported embryo with essential substances like proteins and sugars during early Pregnancy for providing the fetus with adequate nutrition. This could explain the increase of uterine gland number in early Pregnancy, particularly in the lactoferrin group, as shown in Figures 2-5.

In early pregnant women and rats, demonstrated that decidual cells differentiated and clumped together to form masses around cells to be in direct contact allowing the transportation of food between mother and fetus. The increase in stromal cells and epithelial cell proliferation in the lactoferrin group agreed who showed that Lactoferrin had a stimulatory and inhibitory effect on cell division and proliferation as it stimulated growth and division of somebody cells and inhibited others as mammary epithelial cells, fibroblasts, and tumor cells that may be according to the type of cells with unknown mechanism. In the same respect, demonstrated that estrogen and progesterone regulated expression of Lactoferrin in rat uterine tissue and so during early pregnancy, estrogen enhanced the uterine epithelium for the secretion of Lactoferrin and so increased epithelial and stromal cell proliferation. Nichols and McKee 1990 showed that Lactoferrin’s role in the proliferation of epithelial cells was due to its ability for iron transportation inside the cells. Moreover, Hagiwara 1995 reported that the role of Lactoferrin in stimulating cell proliferation was due to stimulation of growth factor as one of its modulatory actions. Eosinophil count increased in the lactoferrin group as showed in Figure 6 in uterine tissue, particularly at 3 days after insemination when compared with the control group. These data get inconsistent with the results of added that eosinophil was decreased in uterine tissue with the advancement of Pregnancy. However, Robertson 2000 reported that eosinophil cells were present in rodent uterine tissue, particularly at early Pregnancy.

Their numbers increased after exposure to semen after mating within the uterine stroma, particularly at the area adjacent to the luminal and glandular epithelium. The migration of eosinophil and leukocyte to uterine tissue maybe had a role in implantation and attracted to granulocyte-macrophage colony-stimulating factor, interleukin 4 and interleukin 5 molecules. This could explain that Lactoferrin increased eosinophil particularly at 5hrs and 1 day after insemination in uterine tissues, and this may explain that eosinophil had a role in the implantation of the embryo and it may secrete chemical mediators or cytokines as Rantes, Eotaxin, MIP, and IL5 that aided in early embryo acceptance by immunity and may have a role in early implantation of the embryo.

Conclusion

Lactoferrin increases the number of leukocytes, especially lymphocytes, eosinophil, and basophil, and increases TNF and C-reactive protein in serum. In addition to that, increase the concentration of interleukin 1 A and interleukin 10, especially with the advancement of pregnancy at 3 and 7 days of gestation. So Lactoferrin has a positive effect on stimulating the general and mucosal immune system during pregnancy.

For more Articles on : https://biomedres01.blogspot.com/
 

Effects of Photodynamic Therapy on Staphylococcus Aureus Viability and Staphylocoagulase Activity, an Ex-Vivo Trial


Effects of Photodynamic Therapy on Staphylococcus Aureus Viability and Staphylocoagulase Activity, an Ex-Vivo Trial


Introduction

Staphylococcus aureus is an important pathogen with extremely high mortality in humans [1]. It has a series of harmful factors which participate in pathogenicity, such as coagulase enzyme or Staphylocoagulase (SC) [2], which distinguished S. aureus from other Staphylococcus species [3,4]. SC supports bacterial endurance inside phagocytic cells, which is the key to the pathogenic tactic of dodging host immune system reactions [5]. Accordingly, this enzyme acts to initiate the blood’s coagulation by Prothrombin Conformational Activation Mechanism (PCAM), through which N-terminal domain interacts, adheres to C-terminal of fibrinogen, and repeats the sequences [6-9]. This activity produces an active proteolytic complex (Staphylocoagulase-prothrombin complex), enhancing fibrinogen’s ability to fibrin [10]. Here comes the need for new technologies that can prevent, control, and reduce the disease process’s risk. Different strategies have been used to develop antibodies to forestall S. aureus contaminations; however, no good outcomes have been resulted [11]. It is known that some killed-vaccines and live-attenuated vaccines against S. aureus protect against varying antigens, but they need more research focus [12]. It is suggested that antimicrobial photodynamic treatment (PDT) represents a modality to treat S. aureus infection.

The PDT has a potential mechanism that can reduce Staphylocoagulase activity at a specific dose of laser irradiation along with the administration of a photosensitizer to increase the rate of cellular apoptosis [13]. This mechanism depends on Reactive Oxygen Species’ production (ROS) from cytological photochromophores of irradiated cells. The photokilling effects of MB-based PDT towards S. aureus have been described decades ago. The present study aims to evaluate a new aspect of the use of PDT on S. aureus. We have assessed the action of 650nm diode laser alone and with different concentrations of MB as an external photosensitizer to reduce SC’s activity, which may help develop an anti S. aureus treatment.

Material and Methods

Bacterial sample. Bacterial samples were isolated from infected patients and identified using analytical profile index (API) test methods. Stock cultures were maintained on Casein Hydrolysate slant agar pH 7.4 (HiMedia) at 4ºC and were sub-cultured weekly.

Isolates were divided into six groups and labeled as follows:

a) Control group: S. aureus without treatment,

b) IRA group: S. aureus with laser irradiation,

c) 50PDY group: S. aureus suspension in 50 μg/ml MB and laser irradiation,

d) 100PDY group: S. aureus suspension in 100 μg/ml MB and laser irradiation,

e) 150 PDY group: S. aureus suspension in 150 μg/ml MB and laser irradiation,

f) and 200PDY: S. aureus suspension in 200 μg/ml MB and laser irradiation.

We prepared five replicas of each sample.

Laser Irradiation

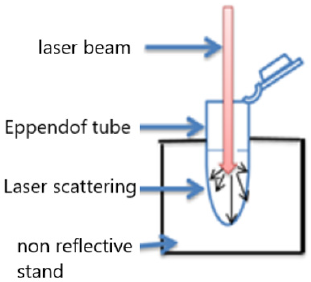
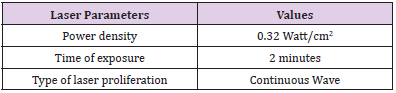
In this experiment, we used a diode laser (JD-R303, HUONJE 114 TM/ China) with 650nm wavelength and 100mW power. Table 1 shows laser parameters that we adjusted to irradiate the samples [14-16]. We used sterile Eppendorf tubes containing 1 milliliter(ml) of growth culture (5x 10⁶ cell/ml) installed in tube rack to be directly and adjacently under diode laser exposure [17]. The laser irradiation set-up was designed vertically to ensure maximum laser distribution evenly in hole suspension volume (Figure 1). Preparation of bacteria for PDT was done by taking 1 ml of the bacterial suspension after 18 hours of incubation and mixing with 1ml of MB solution. After irradiation, the samples were inoculated in 10ml of Casein Hydrolysate Broth (CHB).

Figure 1: Laser arrangement for bacterial suspension irradiation.

Table 1: Laser irradiation parameters.

Cultivation Methods

S. aureus was cultivated on 20 ml of CHB in 100 ml Erlenmeyer flasks at 35 ºC for 18 hours so that the bacterial growth culture reached the exponential phase, which is optimum for enzyme production. The cultures were shaken in a shaking incubator (LSI 3016R / Labtech Shaking Incubator) at 190 revs. min-l [17]. The bacteria were also cultured in Casein Hydrolysate Medium (CHM) (HiMedia) at PH=7.4, and then the number of colony-forming units per milliliter (CFU/ml) was obtained.

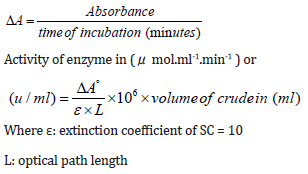
Staphylocoagulase Assay: According to Engels et al. we do the SC assay based on clotting time [18]. 20 ml of culture was centrifuged (BECKMAN COULTER/Analytical Ultracentrifuge) at 12500 g for 2 minutes. Then 0.5 ml of culture supernatant was blended with 0.5 ml of human plasma and incubated at 35 ºC for 4 hours. SC activity was calculated depending on clotting time. After the Staphylocoagulase-plasma reaction, the absorbance at 540nm was calculated for five replicates of each sample using a UV-VIS spectrophotometer (SP-3000 nano-OPTIMA, Japan). For calculating the enzyme activity (Uml-1), the following equations were applied: [19].

CFU Enumeration: CFU was calculated according to Thomas et al. [20]. Single Plate-Sequential Dilution Spotting (SP-SDS) technique includes preparation of CHM at pH 7.4. Each 9-cm Petridishes were divided into six sectors; each sector was labeled with the bacterial suspension’s dilution factor. A stock solution of growth culture was determined by measuring the optical density (OD) at 600 nm utilizing a 1:10 diluted stock in a UV/ VIS spectrophotometer (SP-3000 nano-OPTIMA, Japan). A serial dilution of 101–106 was set up from the 100 stocks in 1.5 ml Eppendorf tubes with 3–5 imitates and change the tips. We used sterilized distilled water autoclaved and stored for stock and dilutions preparation. Utilizing an adjusted micropipette, 20 μl of six dilutions were applied as 4–6 miniaturized scale drops in the divided sectors (sample spotting). The inoculated Petri dishes were dried off using the laminar airflow cabinet and incubated at 37˚C for 18-24 hours. The formula that we used to calculate CFU was:

where, n = colonies number, d= dilution level yielding the countable colonies.

Statistics: We analyzed our results with SPSS software version 23.0 (IBM Inc., Armonk, NY, USA). Paired sample T-test was used to analyze the enzyme activity and CFU mean values of five replicates. We made the comparisons before and after PDT with a significance level of 0.05 and control as the dependent variable. Furthermore, we used EXCEL to present our results in a column chart associated with standard error taps.

Results

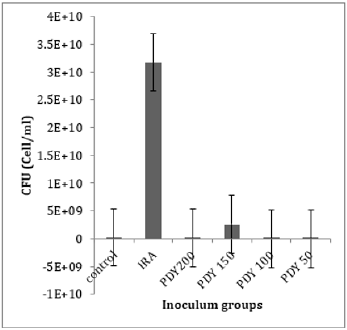
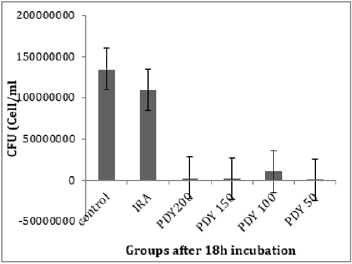
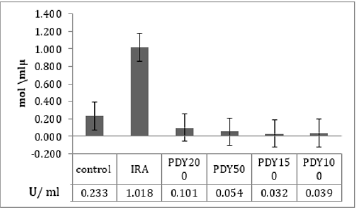
The total bacterial numbers for inoculum and exponential growth culture before and after PDT were calculated using the CFU technique described by Thomas et al. [21]. Each experiment was repeated five replicates for each sample. The mean values of inoculum in (Figure 2) show that the control, PDY200, PDY100, and PDY50 groups have the lowest values with the same mean value. In contrast, a highly increasing CFU inoculum after irradiation of the inoculum with 650nm laser for 2 minutes (IRA group) was recorded. These samples were inoculated in CHB and broth culture immediately after irradiation. It could be noticed a slight increase in total cell number means values of the PDY150 group. After 18hrs of shaking incubation, each group’s growth cultures were divided into two parts; the first part was serially diluted for a total bacterial count, then re-cultured and incubated for 18-24 hours at 37˚C-the dilution yielding acceptable colonies selected for CFU enumerations. The results show significant decay in CFU mean values of IRA groups compared to control groups. Simultaneously, the mean values of PDY groups produce the lowest bacterial count impact as a result of the highly bacterial dead ratio to inoculum volume after laser-photosensitizer treatment (Figure 3). Generally, there is a noticeable decrease in viable bacterial numbers after 18h of the incubation period. This is mainly because of the high rate of active nutrition consumption and oxygen content during shacking incubation which shortens the exponential phase compared to the stationary growth phase. The second part of the growth culture was harvested to separate and extract crude enzyme following SC activity determination steps using a spectrophotometer at 540nm. The data were analyzed by comparing means using paired sample test tables and showed a significant rising and decline in SC activity at IRA and PDY150 compared to control, respectively (Figure 4). The lowest SC activity mean values were recorded in the 150PDY group.

Figure 2: The mean values of CFU inoculum of control and irradiated groups.

Figure 3: The mean values of CFU for control and irradiated groups, after 18h incubation.

Figure 4: Mean values of SC activity as a function of nonirradiated and irradiated groups.

Discussion

The photokilling effects of MB-based PDT towards S. aureus have been described previously. The present study was designed to compare the effects of laser irradiation alone or associated with MB as a photosensitizer on S. aureus bacteria, mainly focused on Staphylocoagulase activity as a new aspect. We irradiated the groups of bacteria with a 650nm diode laser for the same exposure time to clarify the effect of laser on bacterial growth concerning the presence or absence of methylene blue as a photosensitizer, and then we calculated the SC activity in the specimens. Our findings approved that 2 minute of irradiation of S. aureus with a 650nm diode laser alone results in rising total cell numbers and SC activity. As noticed in (Figures 2 and 4), photo-biostimulation influence response to 650nm laser on inoculum (the IRA group) after 2 minutes of laser irradiation significantly increased the SC activity (P-value= 0.003). It included an increase in cell proliferation rate and biomass of bacteria after overnight culturing. These results are contradictory to the findings of Chung et al. [21]. According to Chung̓s study, where they irradiated three different bacteria species, S. aureus, E. coli, and P. aeruginosa, with nine unique laser frequencies for 15minutes, none of the laser frequencies caused noteworthy distinction in growth on any of the three organisms’ species. Our hypothesis is that exposing the micro-organisms to laser treatment for an extended period, such as Chung ̓s study, leads to thermal effect instead of photo-biostimulation, and thermal accumulation limits actively the ionization of intracellular chromophores [22,23].

Another study by Andraus et al. has reported that low-level laser therapy (LLLT) with 660nm or 808nm lasers has no bactericidal effect and no hindrance growth in the illuminated region of plates at different irradiation times (2.15 min, 1.7min and 40 seconds) [24]. We hypotheses that the form of prepared bacterial biofilm for irradiation represents a critical factor to observe the effect of LLLT on bacterial growth and its intracellular biomolecules activities. Chung and Andraus used to irradiate bacterial culture on the medium plate in an illuminated room that provides highly accumulated concentration of bacteria that prevented total absorption of laser wavelengths despite using different wavelengths, powers, intensities, and irradiation time. In the present experiment, we prepared liquid cell suspension to be irradiated and inoculated for subculturing. (Figure 3) shows a slight drop in CFU mean values of the IRA group after 24 hours of incubation compared to control despite a significant increase in the same group’s SC activity. This occurs due to accelerating cell division rate, nutrition consumption, and shifting in the lag phase after the photo-biostimulation effect. These findings match the results of Jadah et al. [25]. PDT has adequacy against a broad spectrum of Gram-positive and Gramnegative bacteria and other types of micro-organisms. It has a multi-target mechanism [26-30], autonomously affecting their protection from standard antimicrobial treatment [31-32]. This method requires a photosensitizer (PS), light, and oxygen. The PS when energized by laser light within sight of O2, produces receptive oxygen species (ROS) like superoxide (O2•-), hydrogen peroxide (H2O2), hydroxyl radical (•OH) created by type І systems, and singlet oxygen (1O2) (type Ⅱ systems) [33].

The impacts of O2•- and H2O2 are less intense than those of •OH and 1O2 since the latter two are substantially less responsive to detoxification by endogenous antioxidants. Examples of that antioxidants system are catalase, superoxide dismutase (SOD), peroxidase, regulatory genes RpoE, RpoHII, and RoHS. Conversely, no enzyme can detoxify •OH or 1O2, making them intensely cytotoxic [34]. As indicated, we can use photodynamic conventions to reduce the virulence of S. aureus without affecting total cell viability. Therefore, this trial represents the PDT protocol to battle against SC without affecting the bacteria’s total viable count. To provide an optimal cultivation condition and maximum production of the virulence enzyme (SC) from S. aureus, which occurs only in the exponential growth phase, we utilize CHB as the optimal production medium and suitable shacking incubation parameters (190 revs. Min-1, 35˚C for 18h) [22]. Photosensitizing with MB at a 150 μg/ml concentration results in significant inhibition on SC activity compared with other groups. It can be hypothesized that photodynamic influence is more effective at 150 μg/ml concentration of MB. It is the optimal concentration of MB for maximum penetration to the intracellular bacterial structure, resulting in ROS production inside and outside the plasma membrane of the bacterial cell [35]. This can be seen in (Figure 2) by sudden increases of CFU mean values in the PDY150 group. Another PDT consequence effect was distortion in RNA-related organelles that will be inherited to successive generations; therefore, after 18h of cell proliferation, significant SC activity inhibition is seen (Figure 3) in the 150PDY group. It means that photodynamic treatment can cause inherited distortion in cytoplasmic organelles, which is responsible for low production of SC, or there was a shifting in the lag phase of bacterial growth, which leads to the lowest secretion of SC. For both hypotheses, we produce attenuated bacteria with low potential of SC as a virulent factor [36]. Morphological studies by Bertoloni et al. support the first. They have concluded that irradiation of eukaryotic cells with Helium-Neon laser at 632nm increased packing of the cytoplasmic matrix and number of ribosomes until almost complete disappearance of the microorganisms [37].

In our study, laser arrangement for bacterial suspension irradiation was designed vertically to ensure maximum laser distribution evenly in hole suspension volume. The thermal effects of laser radiation on the specimens should also be discussed. Because if the number of viable bacteria in each sample decreases due to these thermal effects, it can affect the enzyme activity in the results [32]. Our results show an increase in the number of bacterial colonies after two minutes of laser irradiation alone (Figure 2). Therefore, the rise in temperature does not seem to have much effect on our results.

Conclusion

The most effective PDTs̓ parameters which reduce SC activity were diode laser at 650 nm wavelength, 100mW power, 2 minutes’ irradiation time, liquid bacterial suspension to be exposed directly to laser irradiation, and MB concentration of 150 μg/ml. These conditions cause inhibition in SC activity without affecting bacterial viability after 24 h of incubation. This method can potentially be an effective way to treat S. aureus infections, especially the methicillinresistant S. aureus (MRSA). However, serial studies associated with immune response and another virulence factor of S. aureus are still needed.

For more Articles on : https://biomedres01.blogspot.com/
 

Phytoremediation of Organophosphorus Pesticides from Aqueous Media Using Azolla Filiculoides (Case study: Anzali Wetland)

  Phytoremediation of Organophosphorus Pesticides from Aqueous Media Using Azolla Filiculoides (Case study: Anzali Wetland) Introduction Org...