Introduction
Silicates are known as a part of carbonate-silicate cycle [1], but the role of silicon (Si) in pH regulation of groundwater and agricultural soil (soil) is not as well clarified. Stability in inter-regional relative pH values has suggested on the possible role of silicon (Si) in pH regulation [2]. Soil pH has been written to associate non-significantly positively with Si.gw in continental Finland [3], but pH.soil was highest in Åland, where Si.gw was low [4]. In combined regression by [Temp; pH.soil] pH coefficient got negative value for Si.gw [5]. Åland has been excluded from this survey because the availability of Si seems not to be associated with Si.gw [4,6]. Groundwater pH is different in immediate analysis on the field (pH.gw.field) to the laboratory survey (pH.gw.lab). The purpose of this assessment is to describe this difference (Δ. pH.gw) and to propose explanations.
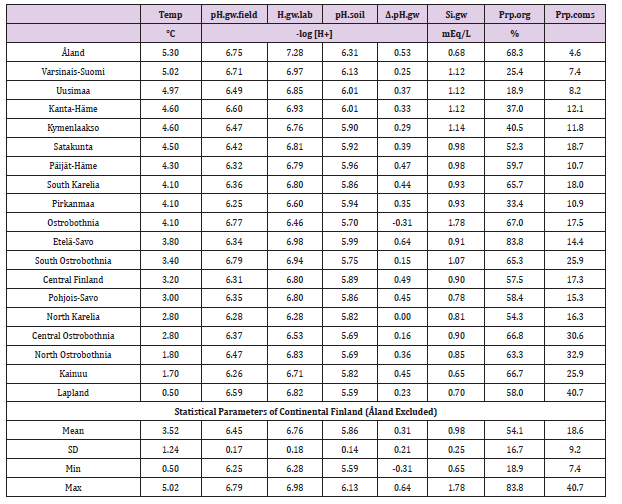
Groundwater parameters (concerning springs and dugwells) are from Groundwater database © Geological Survey of Finland 2017 [7]. pH values and soil-type proportions from cultivated fields separately from 19 Rural Centers (RC, earlier Agricultural Advisory Centers), concerning period 1986-90 are provided by Eurofins Viljavuuspalvelu Oy [8]. Number of soil samples was 552,788. The boundaries, names and numbers of RCs and Regions deviate slightly from each other [9]. Average annual temperatures of RCs from 1981-2010 are visually approximated by combining map of Finnish Meteorological Institute [10] and map of RC´s [11]. Regional values for “Varsinais-Suomi” we got by combining RC values of “(03). Varsinais-Suomen” and “(4b). FinskaHushållningss ”and for “Uusimaa” by combining RC values of “(01).Uudenmaan” and “(02).NylandsSvenska” as in [4]. After this RC values were given for respective Regions. Numerical data are in Table 1.
 Results
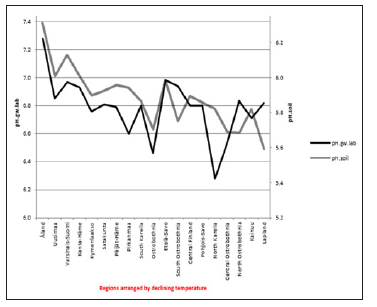
In general values of pH.gw.lab (6.67 +/- 0.18), were the highest, pH.gw.field (6.45 +/- 0.17) the second highest. Values of pH.soil (5.86 +/- 0.14) were the lowest. Only in one of 19 regions pH.gw.field was higher to pH.gw.lab (in Ostrobothnia). Mean regional Δ. pH.gw was 0.31 (+/- 0.21), maximum 0.64 and minimum -0.31 (Table 1). pH.gw.field and pH.gw.lab associated weakly positively with each other (r = +0.29) (Figure 1), as well as with Temp (+0.17 and +0.20, respectively) (Table 2). pH.gw.field associated significantly (+0.64) with Si.gw (Table 2) and mirror-like with pH.soil (r = -0.12) (Table 2) and (Figure 2). pH.gw.lab correlated weakly inversely with Si.gw (r = -0.11) (Table 2) and moderately positively with pH.soil. (r = +0.41, p = 0.091) (Figure 3)- oppositely to pH.gw.field (Table 2).
 Figure 1: pH.gw.field and pH. gw.lab.
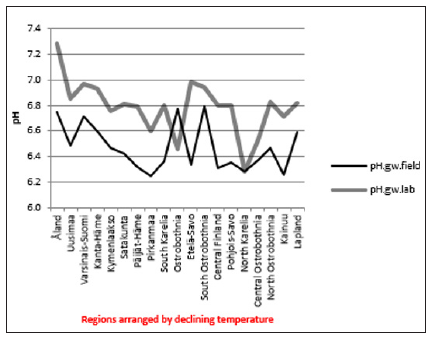 Figure 2: pH.gw.field pH.soil.
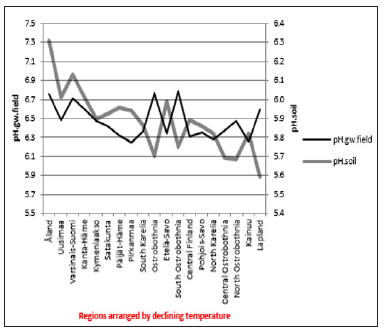 Figure 3: pH.gw.lab. pH.soil.
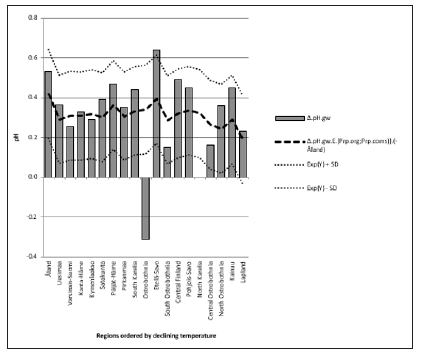
 Δ. pH.gw correlated (Table 3) as pH.gw.lab, but stronger – inversely – with Si.gw (-0.62**) (Figure 4) and positively with pH.soil (+0.45) (Figure 5) Si.gw correlated weakly (+0.11, ns), but interestingly with pH.soil (Figure 6).(Regression by) [Temp; Δ. pH.gw] explained variation of pH.soil 79.4 % (r = 0.89, p < 0.001), coefficient (direction)s (+/+) (Figure 7) and by [Temp; Si.gw] 80.6 % (r= 0.90, p < 0.001) coefficients (+/-) (Figure 8).[Prp.org;Prp. coms] explained trend-like Δ. pH.gw. Visual association is clear, although association is non-significant, coefficients (-/+) (Figure 9).
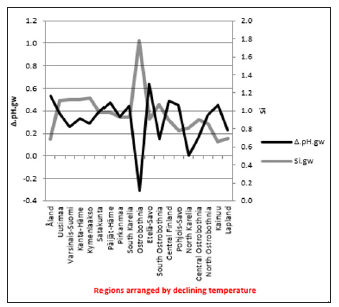 Figure 5:Δ. pH.gw and pH.soil.
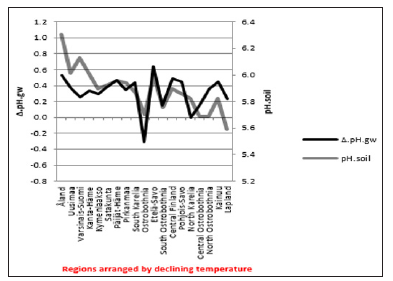 Figure 6: pH.soil and Si.gw.
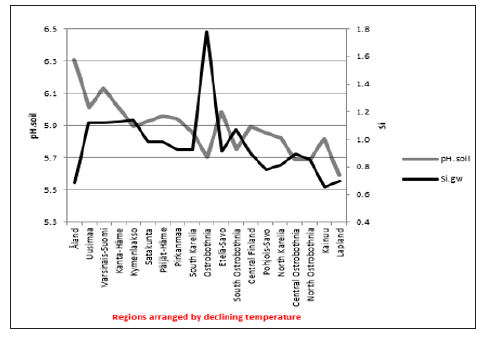 Figure 7: Combined regression of PH.soil by Temp and Δ. pH.gw in continental Finland.
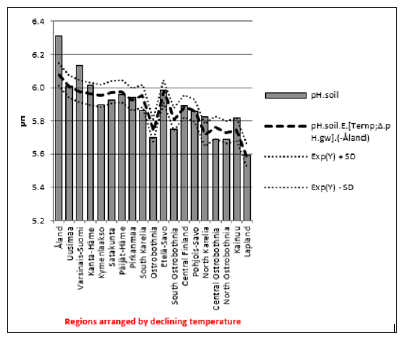 Figure 8: Combined regression of pH.soil by Temp and Si.gw in continental Finland.
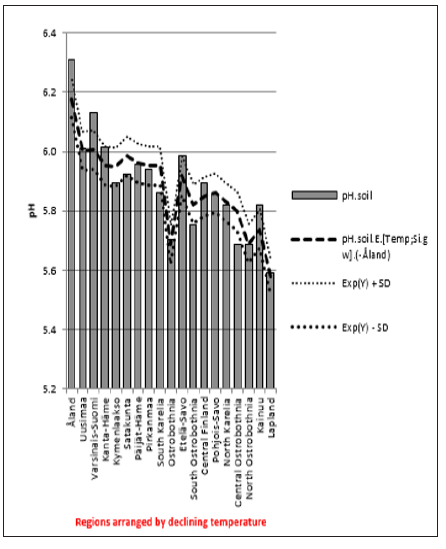 Figure 9: Combined regression of Δ. pH.gw by Organic and coarse mineral soil type proportion in continental Finaland.
 Discussion
Because generally only pH.gw.lab values are published [7] and I have not find discussions on differences between Finnish pH.gw.lab and pH.gw.field, this assessment can be justified. The primary aim was to describe the pHenomenon by (Figures 1-8) and secondarily to propose some explanations. CO2 values, which were measured only on the field, were not available for this survey. HCO3 - values, which were measured in the laboratory, were available, but they seem not to be informative without CO2. Regional Temp (average mean annual temperature) was significantly (p < 0.01) associated with Si.gw and pH.soil, weakly with pH.gw´s and infinitesimal with Δ. pH.gw (Table 2). Temperature was strongly associated with Finnish geography and soil-type variation [3,4,5]. Here Temp association with Prp.org was -0.88, with Prp.coms -0.51 and with proportion of fine mineral soils (Prp.fims) +0.72. calculated from (Table 2). (Prp.coms +Prp.org + Prp.fims = 100). Interesting was the low association of Temp with pH.gw parameters; especially Δ. pH.gw seems to be “thermo-resistent”.
pH.gw.field associated significantly positively with Si.gw (+0.64**) and negatively with Δ.pH.gw (Figure 2). pH.gw.lab associated about oppositely: significantly positively with Δ. pH.gw (+0.63**) (Figure 3) and weakly negatively with Si.gw. pH.gw.field curve forms like a mirror image with pH.soil (Figure 2), similarly as Si.gw with Δ. pH.gw (Figure 4). Interesting was that pH values of different soil-types (org, sands, mould, moraines and silt) gave highly similar curves as pH.soil [8]. pH.soil associated about similarly with pH.gw.lab and Δ. pH.gw (Figures 3&5). It is interesting, because proportion of agricultural soils of total land is different in different parts of Finland. This suggests that gw could be mainly of intra-regional origin. Regression of Δ.pH.gw by [Prp.coms;Prp. org] (Figure 9) showed trend-like positive association with coms and negative associations with org. Soil-type distribution (Figure 9) did not explain Ostrobothnia nor North Karelia values (Figure 9).
Combined regression by [Temp;Δ. pH.gw] explained pH. soil 79.4 % (r = 0.89, p < 0.001), both parameters were positive (Figure 7). [Temp;Si.gw] explained it slightly stronger 80.6 % (r = 0.90, p < 0.001), coefficients (+/-) (Figure 8). The negative association of Si.gw with pH. soil in this combination can be understood by Figure 6 (similar trends with Temp, but Si.gw fluctuations/deviations were like mirror-image to pH.soil). Δ. pH.gw could be associated with carbonic acid (H2CO3): Its pKa1 is 6.3 [12], which is near the means of pH.gw.field (6.45) and pH.gw.lab (6.76). This pKa1 includes reactions CO2 + H2O ↔ H2CO3 ↔ H+ + HCO3 - [13]. Most of CO2 is dissolved in water and about ca 0.2 % of CO2 is in the form of H2CO3 [13,14]. In the absence of a catalyst, the balance in reactions CO2 + H2O ↔ H2CO3 is reached quite slowly [13]. Slow evaporation of CO2 after pH.gw.field analysis could reduce H2CO3 and raise pH.gw. The effect of temperature as such on pH.gw (on the field 7.2 +/- 3 °C) [7] can obviously be excluded, because even pH.gw.field was measured at 25°C as pH.gw.lab [7].
Explanations via silicon: Silicate weathering can proceed via the chemical reaction as: CaSiO3 + 2CO2 + H2O ↔ Ca2 + + 2HCO3 - + SiO2 (dissolved silica) [1]. So silicates can sequestrate CO2 from air, soil and subsoils and work as antacids, before coming to groundwater. Possibly in gw this reaction could work slowly backwards [1] and produce again water-soluble CO2, which could evaporate as CO2 in the temperature (25°C), which is higher to the fresh gw and so raise pH. Inside every region Δ. pH.gw of different samples could be different with different explanations (i.a. different buffer systems). Low pH.gw in North Karelia as in Ostrobothnia (with acid sulpHate soils [15]) could be a part of explanation. Regional Δ. pH.gw medians got no negative values, but zero in Ostrobothnia . Product of soluble SiO2, orthosilicic acid Si(OH)4 or H4SiO4 –is a weak acid (pKs1 = 9.51 and pKs2 = 11.74) [16,17]. Si(OH)4 can condense and form dimers and oligomers [18]. The pK of silanol (Si-O-H) [19] groups on the outside of oligomers 1nm in diameter is 6.8 [18], which is close to the mean pH.gw`s, which could make buffering possible. Because pKa2 (7.20) of phosphoric acid is moderately near mean PH.gw’s, it could have some effects, too [20].
Regional Δ.pH.gw was associated inversely with Si.gw. Combined Temp and Δ. pH.gw explained ca 80 % of agricultural soil pH variation. Δ. pH.gw can be associated with silicate carbonate interactions. (CO2 sequestrating by silicates - weathering - can be seen as a pH stabilizing process, which could be supported by silicate liming agents and fertilizers, e.g. industrial slags and stone meals).
More BJSTR Articles : https://biomedres01.blogspot.com


No comments:
Post a Comment
Note: Only a member of this blog may post a comment.