Concurrent Determination of Danshensu and Hydroxyl Ligustrazine in Rat Plasma Using High-Performance Liquid Chromatography and its Application to the Pharmacokinetic Study of ADTM, DSS and TMP-OH Following Intravenous Administration
Introduction
Danshen, the root of Salvia Miltiorrhiza Radixet Rhizoma (SRR), is one of the most popular herbs in China and is used to treat various cerebro- and cardiovascular diseases [1,2]. One component of Danshen, Danshensu (DSS; (R)-3,4-dihydroxyphenyllactic acid; (Figure 1)), is believed to be primarily responsible for many of its cardiovascular-related pharmacological activities [3-5]. Although DSS is widely used, its poor chemical stability, low bioavailability and inadequate therapeutic efficacy restrict its clinical application. Therefore, it is necessary to improve its activity and stability via structural modifications. Tetramethylpyrazine (TMP, (Figure 1)) is another biologically active ingredient isolated from the traditional herbal medicine Chuangxiong Rhizoma (CR), which has been shown to produce an antithrombolytic effect, induce vasodilation, reduce endotoxic shock, and protect the brain against ischemic injury both in in vivo and in vitro models [6-9]. The combined use of Danshen and Chuanxiong has proven to be effective in patients with angina pectoris and ischemic heart failure, and also to lower the incidence of myocardial damage [10,11].
Figure 1: Chemical structure of TMP-OH (I), Danshensu (II), ADTM (III) and p-hydroxybenzoic acid (IV, internal standard).
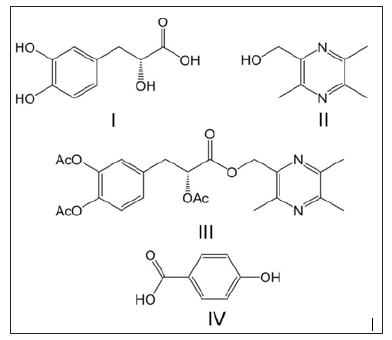 The aim of this study was to develop and validate a High- Performance Liquid Chromatography-Ultraviolet Detection (HPLCUV) method capable of detecting DSS and TMP-OH concurrently and to provide a modern and applicable analytical tool for further pharmacokinetic investigations of ADTM in vivo. Further, the pharmacokinetic characteristics of DSS and TMP-OH were compared for three modes of administration:
a) Intravenous (iv) ADTM administration;
b) Combined iv sodium DSS and TMP-OH administration;
c) Single iv sodium DSS and TMP-OH administration.
The same single dose (43.67μΜ/kg) of the above compounds was administered.
Materials and Methods
Chemicals and Reagents
Sodium DSS (purity >99.5 %) was purchased from HonSon Biotechnology Co. Ltd. (Xi’an, China). P-hydroxybenzoic acid (Internal Standard [IS]) was purchased from Sigma (St. Louis, USA). ADTM (99.8% pure) and TMP-OH (99% pure) were synthesized at the Institute of New Drug, Guangdong Jinan University (Guangzhou, China). HPLC grade methanol was purchased from Hanbon Sci.Tech. (Jiangsu, China). Hydrochloric and phosphoric acids were obtained from Kermel Chemical Reagent Co. Ltd. (Tianjin, China). Ultrapure water was produced by Milli-Q apparatus from Millipore (Bedford, MA, USA).
Instrumentation and Chromatography Conditions
The chromatogram was recorded with an Agilent HPLC system (series1200, Agilent Technologies, Palo Atto, CA, USA). An analytical column, Kromasil ODS C18 column (250mm × 4.6mm, 5μm) from Lubex Biological Technology Co. Ltd (Guangzhou, China) and a guard column packed with C18 (10mm× 4.6mm, 5μm) from Hanbon Sci. Tech. (Jiangsu, China) were used for chromatographic separation. The mobile phase consisted of a binary methanol and 0.05 % phosphoric acid mixture (25:75v/v) and was delivered at flow rate of 0.8ml/min. The detector was set to 280nm. Chromatography was performed at 35 oC, and the runtime was < 16.5min.
The chromatogram was recorded with an Agilent HPLC system (series1200, Agilent Technologies, Palo Atto, CA, USA). An analytical column, Kromasil ODS C18 column (250mm × 4.6mm, 5μm) from Lubex Biological Technology Co. Ltd (Guangzhou, China) and a guard column packed with C18 (10mm× 4.6mm, 5μm) from Hanbon Sci. Tech. (Jiangsu, China) were used for chromatographic separation. The mobile phase consisted of a binary methanol and 0.05 % phosphoric acid mixture (25:75v/v) and was delivered at flow rate of 0.8ml/min. The detector was set to 280nm. Chromatography was performed at 35 oC, and the runtime was < 16.5min.
Preparation of the Stock and Working Solutions
Stock solutions of DSS, TMP-OH, and P-hydroxybenzoic acid (Internal Standard [IS]) were individually prepared at 1mg/ml in mobile phase, stored at 4 oC, and protected from light. DSS and TMP-OH stock solutions were diluted with mobile phase to yield working solutions for preparing the validation samples. A diluted solution containing 10.0μg/ml of IS was also prepared. The working solutions containing concentrations of 1.0 to 100.0μg/ml of DSS and 0.25 to 50.0μg/ml TMP-OH were used to spike the blank healthy rat plasma sample. The Quality Control Samples (QCs) were prepared as calibration standards in a similar manner to obtain three final concentrations of 0.2, 2.0, and 16.0μg/ml for DSS and 0.05, 1.0 and 8.0μg/ml for TMP-OH. All solutions were stored at 4 oC and brought to room temperature before use. The spiked samples were then treated following the sample preparation procedure indicated in Section 2.4.
Stock solutions of DSS, TMP-OH, and P-hydroxybenzoic acid (Internal Standard [IS]) were individually prepared at 1mg/ml in mobile phase, stored at 4 oC, and protected from light. DSS and TMP-OH stock solutions were diluted with mobile phase to yield working solutions for preparing the validation samples. A diluted solution containing 10.0μg/ml of IS was also prepared. The working solutions containing concentrations of 1.0 to 100.0μg/ml of DSS and 0.25 to 50.0μg/ml TMP-OH were used to spike the blank healthy rat plasma sample. The Quality Control Samples (QCs) were prepared as calibration standards in a similar manner to obtain three final concentrations of 0.2, 2.0, and 16.0μg/ml for DSS and 0.05, 1.0 and 8.0μg/ml for TMP-OH. All solutions were stored at 4 oC and brought to room temperature before use. The spiked samples were then treated following the sample preparation procedure indicated in Section 2.4.
Sample Preparation
Plasma samples were extracted employing a liquid–liquid extraction technique. First, 100μl of mobile phase, 25μl of internal standard (10μg/ml), and 300μl of 0.1M hydrochloric acid, which contained 0.2% sodium bisulfite (NaHSO3), were added to 250μl of plasma in a polypropylene tube and vortex-mixed for 30sec. Three millilitres of ethyl acetate were then added to the mixture and vortex-mixed for 5min. After centrifugation at 12,000rpm for 6min, the super organic layer was transferred to a clean 10.0ml glass centrifuge tube and evaporated to dryness at 45oC under a stream of nitrogen. The dried residue was reconstituted in 100μl of mobile phase, and a 20μl sample was injected into the HPLC system for analysis.
Plasma samples were extracted employing a liquid–liquid extraction technique. First, 100μl of mobile phase, 25μl of internal standard (10μg/ml), and 300μl of 0.1M hydrochloric acid, which contained 0.2% sodium bisulfite (NaHSO3), were added to 250μl of plasma in a polypropylene tube and vortex-mixed for 30sec. Three millilitres of ethyl acetate were then added to the mixture and vortex-mixed for 5min. After centrifugation at 12,000rpm for 6min, the super organic layer was transferred to a clean 10.0ml glass centrifuge tube and evaporated to dryness at 45oC under a stream of nitrogen. The dried residue was reconstituted in 100μl of mobile phase, and a 20μl sample was injected into the HPLC system for analysis.
Method Validation
Method validation assays were carried out according to the currently accepted United States Food and Drug Administration validation guidelines for bioanalytical methods [20]. Selectivity was confirmed by comparing the chromatograms obtained from three types of plasma samples (namely drug-free samples collected from six individual rats). These samples were spiked with analytes and IS, and plasma samples were taken from rats 2min after the dose was injected. Calibration curves were prepared by assaying standard plasma samples at seven concentration levels, which ranged from 0.1 to 20.0μg/ml for DSS or 0.025 to 10.0μg/ml for TMP-OH. The linearity of each calibration curve was determined by plotting the peak area ratio (y) of analytes to IS versus the nominal concentration (x) of analytes with a weighted (1/x2) least square linear regression. The sensitivity of the method was determined by establishing the Lower Limits of Quantitation (LLOQ). This was defined as the lowest detectable concentration on the calibration curve. It is generally accepted that the Relative Error (RE) of accuracy should be within ± 20%, and Standard Deviation (RSD) values of both precision and accuracy measurements should be < 20%.
Method validation assays were carried out according to the currently accepted United States Food and Drug Administration validation guidelines for bioanalytical methods [20]. Selectivity was confirmed by comparing the chromatograms obtained from three types of plasma samples (namely drug-free samples collected from six individual rats). These samples were spiked with analytes and IS, and plasma samples were taken from rats 2min after the dose was injected. Calibration curves were prepared by assaying standard plasma samples at seven concentration levels, which ranged from 0.1 to 20.0μg/ml for DSS or 0.025 to 10.0μg/ml for TMP-OH. The linearity of each calibration curve was determined by plotting the peak area ratio (y) of analytes to IS versus the nominal concentration (x) of analytes with a weighted (1/x2) least square linear regression. The sensitivity of the method was determined by establishing the Lower Limits of Quantitation (LLOQ). This was defined as the lowest detectable concentration on the calibration curve. It is generally accepted that the Relative Error (RE) of accuracy should be within ± 20%, and Standard Deviation (RSD) values of both precision and accuracy measurements should be < 20%.
Pharmacokinetic (PK) Study in Rats
Adult male Sprague-Dawley rats (250 to 280g) were provided by the Experimental Animal Centre of Guangdong Province and maintained under specific pathogen-free conditions in the Animal Centre of Pharmaceutical College of Jinan University. The rats were divided into four groups, with six rats in each group:
a) Group 1 received a single intravenous (iv) administration of ADTM;
b) Group 2 received combined iv administration of sodium DSS and TMP-OH; and
c) Groups 3 and 4 received a single iv administration of sodium DSS or TMP-OH, respectively.
All groups were given iv injections at the same dosage (43.67μΜ/kg) via the tail vein. Serial blood samples (0.4ml) were obtained from the jugular veins via an indwelling catheter, before dosing (0min) and at 2,5,10,15,20,30,45,60,90, and 120min after iv injections. All samples were placed into heparinized tubes. After centrifugation at 3,000 rpm for 10 min, plasma was collected and frozen at -20 °C until analysis. The pharmacokinetic parameters were calculated using the Drug and Statistics (DAS) version 2.0 software package.
Statistical Analysis
In order to determine the pharmacokinetic parameters of DSS and TMP-OH in different groups, concentration-time data were analysed using DAS 3.2 software (Mathematical pharmacology Professional Committee of China, Shanghai, China). The groups were compared using One-Way Analysis of Variance (ANOVA) followed by Tukey’s multiple comparison tests with the statistics model of Graph Pad Prism 5.0 software. A value of P < 0.05 was considered to represent statistical significance.
In order to determine the pharmacokinetic parameters of DSS and TMP-OH in different groups, concentration-time data were analysed using DAS 3.2 software (Mathematical pharmacology Professional Committee of China, Shanghai, China). The groups were compared using One-Way Analysis of Variance (ANOVA) followed by Tukey’s multiple comparison tests with the statistics model of Graph Pad Prism 5.0 software. A value of P < 0.05 was considered to represent statistical significance.
Results
Method Development and Validation
Typical chromatograms of blank plasma demonstrated the selectivity of the method. Blank plasma was spiked with standard solution analytes and IS while plasma samples were obtained from different groups at 2 min after intravenous injection. As shown in Figure 2, the retention times of DSS, TMP-OH, and IS were 6.7, 11.3, and 15.0min, respectively. No obvious interference from endogenous plasma substances were observed under the chromatographic conditions. The typical linear equations of the calibration curves for DSS and TMP-OH were y = 0.3733x – 0.01096 (r=0.9958) and y = 1.342x + 0.002454 (r=0.9969), respectively. The results showed that there was an excellent correlation between the ratio of the peak area and the concentration of each compound with the test ranges. The Lower Limits of Quantification (LLOQs) of DSS and TMP-OH were 0.1 and 0.025 μg/ml, respectively. The intra- and inter-day precision and accuracy of DSS and TMP-OH at three QC concentration levels are shown in Table 1. All results for the tested samples were within the accepted ranges (RSD% below 15% and RE% within ± 15%, respectively) specified by Food and Drug Administration (FDA) guidelines, which indicated that the method was accurate, reliable, and reproducible.
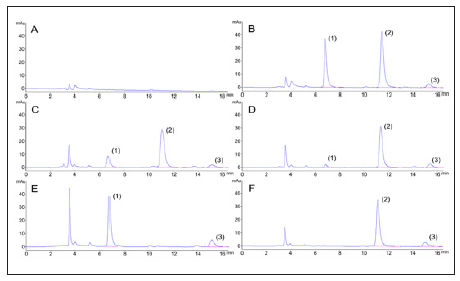 Table 1: Accuracy and precision for Danshensu and TMP-OH analyses in rat plasma (over five validation days and five replicates at each concentration level per day).
 The mean extraction recoveries were 89.10% ± 3.88%, 80.78% ± 4.36%, and 82.85% ± 2.33 % for DSS at 0.2, 2.0, and 16.0 μg/ ml, respectively, and 77.19% ± 4.56%, 83.46 ± 4.11%, and 78.71 ± 4.37% for TMP-OH at 0.05, 1.0, and 8.0 μg/ml, respectively. IS mean recovery was 100.65 ± 1.32%. These results show that the present method was appropriate for the extraction of compounds from plasma. The measured concentrations of DSS and TMP-OH at the QC levels deviated by no more than 10%, which demonstrated that DSS and TMP-OH were stable in rat plasma at room temperature for 24 h after preparation and at -20oC for one month after three rounds of freeze and thaw cycles. The stability results of the compounds under different conditions are summarized in Table 2.
 Plasma Pharmacokinetic Study on DSS and TMP-OH after Intravenous Administration of ADTM, DSS, and TMP-OH in Rats
The developed and validated analytical method was successfully applied to the evaluation of the pharmacokinetic properties of DSS and TMP-OH after iv ADTM administration, after individual administration of sodium DSS and TMP-OH, or after combined administration of sodium DSS and TMP-OH to rats in different groups. All pharmacokinetic parameters were processed using a non-compartmental model using DAS (Drug and Statistics) 2.0 software (Mathematical Pharmacology Professional Committee of China, Shanghai, China) from the plasma concentration-time data. The DSS and TMP-OH concentration-time curves from different groups are presented in Figures 3 & 4, and the corresponding pharmacokinetic parameters are listed in Table 3. After intravenous administration, the level of DSS and TMP-OH reached the maximum concentration and declined immediately. The half-life of DSS was no more than 1 h, it was fairly accorded with experimental results reported in literatures [21]. As shown in Table 3, the pharmacokinetics parameters of DSS after iv administration of ADTM have longer half-life (43.225 ± 13.89 min) than DSS used alone or in combination with TMP-OH. While, single iv administration of DSS showed the highst AUC0-t (367.449 ± 97.712 min·mg/L). As to TMP-OH, there was no significant differences of pharmacokinetic parameters among three groups.
Figure 3: Mean plasma concentration-time profile of Danshensu after three methods of administration at same molar dose of Danshensu in rats. (mean ± SD, n = 5).
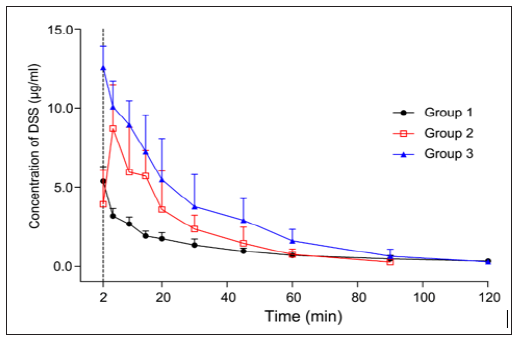 Figure 4: Mean plasma concentration-time profile of TMP-OH after three methods of administration at same mol dose of TMPOH in rats. (mean ± SD, n = 5).
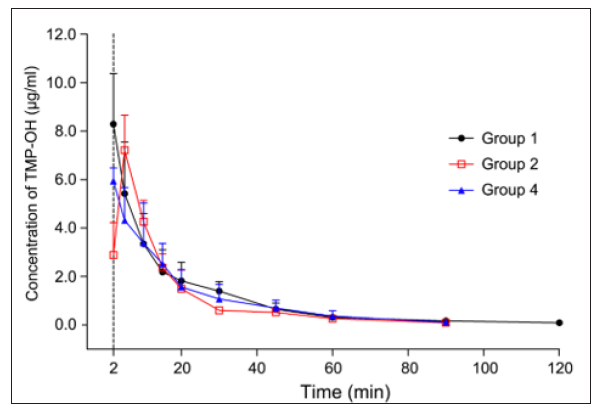 Table 3: The main pharmacokinetic parameters of Danshensu and TMP-OH after different intravenous administration in rats (mean ± SD, n = 5, Analysis of Variance (ANOVA) of Danshensu and TMP-OH pharmacokinetic parameters in different intravenous administration modes; *P < 0.05 versus Group 1 in DSS, **P < 0.01, ***P < 0.001; #P < 0.05 versus Group 2 in DSS, ##P < 0.01).
 Discussion
In order to concurrently determine DSS and TMP-OH in plasma, Modificaed chromatographic optimization was performed in accordance to a previous method used for the study of the pharmacokinetic properties of DSS [22]. We raised proportion of methanol to 25% and changed acial acetic acid into phosphoric acid. Comparing with the different kinds and amounts of acid, the peak shape of the tail can be effectively improved. A mixture of methanol and 0.05 % phosphoric acid solution (25:75, v/v) was chosen as the mobile phase to minimize the detection time and to improve the tailing peak.
 Figure 4: Mean plasma concentration-time profile of TMP-OH after three methods of administration at same mol dose of TMPOH in rats. (mean ± SD, n = 5).
 Table 3: The main pharmacokinetic parameters of Danshensu and TMP-OH after different intravenous administration in rats (mean ± SD, n = 5, Analysis of Variance (ANOVA) of Danshensu and TMP-OH pharmacokinetic parameters in different intravenous administration modes; *P < 0.05 versus Group 1 in DSS, **P < 0.01, ***P < 0.001; #P < 0.05 versus Group 2 in DSS, ##P < 0.01).
 Discussion
In order to concurrently determine DSS and TMP-OH in plasma, Modificaed chromatographic optimization was performed in accordance to a previous method used for the study of the pharmacokinetic properties of DSS [22]. We raised proportion of methanol to 25% and changed acial acetic acid into phosphoric acid. Comparing with the different kinds and amounts of acid, the peak shape of the tail can be effectively improved. A mixture of methanol and 0.05 % phosphoric acid solution (25:75, v/v) was chosen as the mobile phase to minimize the detection time and to improve the tailing peak.
a) Several hydrolytic steps are involved in the removal of acetic acid during DSS generation after ADTM administration;
b) Owing to the good lipid solubility of ADTM, the amount of DSS distributed among tissues is increased and the exposure level of DSS in serum is reduced; and
c) Potential drug interaction between DSS and TMP-OH When concurrent iv injections of DSS and TMP-OH were administered, as shown in Figures 3 & 4, the absorption peak was found in both concentration-time curves of DSS and TMPOH.
Figure 5: Proposed metabolic pathways for ADTM in vivo.
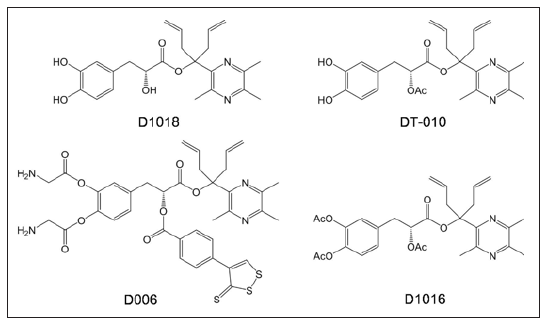
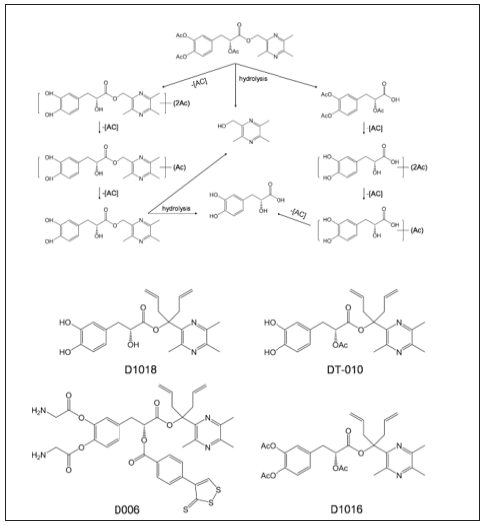 Additional pharmacokinetic studies have revealed that ADTM is quickly hydrolysed into DSS and TMP-OH in vivo and in vitro (halflife of 2.31 min in rat plasma) [19]. Further, we found significantly increased coronary blood flow and reduced mean arterial pressure following ADTM injections in dogs; however, these effects did not last for longer than 15 min [18]. The above results suggest that ADTM itself, rather than its metabolism into DSS and TMP-OH, plays a role in cardioprotection. Therefore, to improve its stability and increase its half-life, we designed and synthesized new DSS and TMP conjugates by modifying the linkage with the addition of bulky groups that would sterically hinder carboxylesterase-induced hydrolysis (as shown in Figure 6). These new ADTM analogues not only enhanced stability against hydrolysis by carboxylesterase in vitro [26] but also displayed higher cardio-protective effects than ADTM both in vitro [27,28] and in vivo [29].
 Additional pharmacokinetic studies have revealed that ADTM is quickly hydrolysed into DSS and TMP-OH in vivo and in vitro (halflife of 2.31 min in rat plasma) [19]. Further, we found significantly increased coronary blood flow and reduced mean arterial pressure following ADTM injections in dogs; however, these effects did not last for longer than 15 min [18]. The above results suggest that ADTM itself, rather than its metabolism into DSS and TMP-OH, plays a role in cardioprotection. Therefore, to improve its stability and increase its half-life, we designed and synthesized new DSS and TMP conjugates by modifying the linkage with the addition of bulky groups that would sterically hinder carboxylesterase-induced hydrolysis (as shown in Figure 6). These new ADTM analogues not only enhanced stability against hydrolysis by carboxylesterase in vitro [26] but also displayed higher cardio-protective effects than ADTM both in vitro [27,28] and in vivo [29].
Figure 6: Chemical structure of new DSS and TMP conjugates previously reported in the literature [21,23].
 Conclusion
A sensitive, simple, and rapid HPLC-UV method was developed for the concurrent analysis of DSS and TMP-OH in rat plasma at equivalent study doses. This reliable method has been successfully applied to assess the pharmacokinetics of DSS and TMP-OH via three different routes of administration. From the pharmacokinetic perspective, when ADTM enters the rat’s circulatory system, it is very rapidly metabolized into DSS and TMP-OH. Compared with that in the single-administration group, DSS has a longer elimination half-life when administrated as ADTM. These slight differences were insufficient to support ADTM as a prodrug. Based on the present results and previous studies, we believe that the chemical structure of ADTM indicates its’ mechanism of action. In future studies, we aim to identify new, more stable ADTM-based analogues with improved pharmacokinetics and drug ability.
Paracoccidioidomycosis in Childhood - A Case Report-https://biomedres01.blogspot.com/2020/11/paracoccidioidomycosis-in-childhood.html
More BJSTR Articles : https://biomedres01.blogspot.com


No comments:
Post a Comment
Note: Only a member of this blog may post a comment.