Monthly Variation in Finnish Total Mortality During 1891-2017, Temperature and Discussions
Introduction
Seasonal variations in mortality resulting from cardiovascular diseases (CVD) have been demonstrated in many countries, with the highest levels observed during the coldest months of the year [1]. Eng and Mercer wrote that monthly January/August (Jan/Aug) CVD death-rate ratio by people aged 60 and older was in Norway 1.22 and in Ireland 1.35 during 1985-95 [1]. The monthly average total death rate maximum (Max) was in January and minimum (Min) in August [1] but not every year, and periodical mean of annual Max/Min ratio was 1.29 in Norway and 1.45 in Ireland [1]. In Finland provincial CHD mortality has been associated significantly with mean annual Temperature [2] although stronger with longitude. The aim of this study is to assess seasonal variation in total mortality in 1891-2017 and discuss the observations.
Materials and Methods
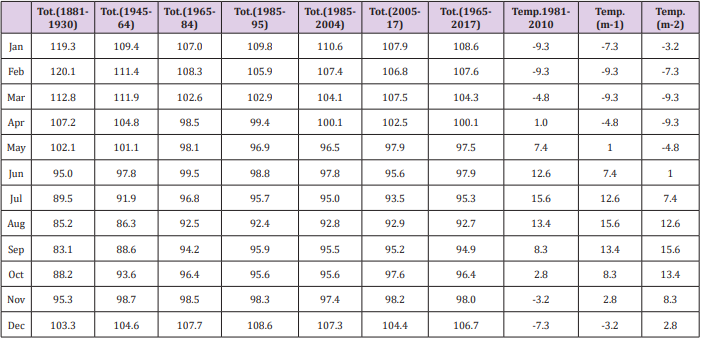
Total mortality data are from Statistics Finland [3,4]. Monthly 10 years periodical data from 1891-1930 [3] are processed (differently to [3]) as follows: Jan, Mar, May, Jul, Aug, Oct and Dec data are divided by 31, Feb by 28,25 and the others by 30 and calculated their sum. By them were calculated values for monthly relative mortality (TOT) (Table 1). Similarly are calculated values for 1945-64, 1965-84, 1985-2004, 2005-2017 and 1965-2017 [4]. By them was calculated periodical SD, Min, Max and Max/Min ratio for each monthly TOT. For the periods in 1945-2017 was additionally calculated “periodical mean of annual Max/Min” (means of monthly Max/Min ratios of TOT of separate years). Temperature data concerning years 1981-2010 are from Finnish Meteorological Institute (Suomen ilmatieteen laitos – in the Finnish version). Data from 1931-44 was excluded because of the war years.
Table 1: Monthly relative Total mortality (Tot) in Finland during different periods in 1891-2017 and Temp (1981-2010).
Results
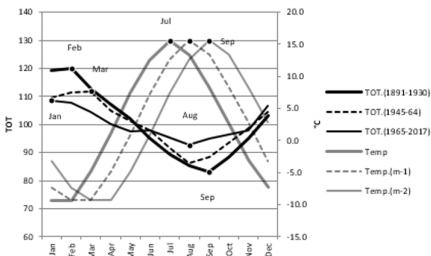
Periodical highest monthly mortality (Max) was in Feb or Mar (in 1945-64) until 1984, after that in Jan. Lowest mortality (Min) was in Sept until 1930, after that in Aug (Table 1). Periodical standard deviation (SD), Max/Min and Jan/Aug ratio was highest in 1891-1930 Next highest in 1945-64. Remarkable is the lowest SD of 1965-2017 during 1965-85. Periodical mean of annual Max/Min was 1.40 in 1945-64, TOT.(1891-30) and TOT.(1945-2017) associated best with Temp of the preceding month [Temp.(m-1)]. Before 1965 TOT association with Temp of the respective month was weaker than with Temp two months earlier [Temp.(m-2)], since 1965 the opposite (Table 2).
Discussion
Perodical Max/Min ratio of monthly mortality has decreased from 1.40 (1891-1930) to 1.16 (2005-2017). (Table 3). Decrease in Max/Min ratio in 1945-64 and moderate stability in 1965-2017 are suggesting on the effects of antibiotics and better protection against cold effects on vascular system and mucous membranes (vasospasms, microbe resistance) externally via clothes, houses, means of communication and internally via protective nutrients (indirectly via fodder, too). Generally is known that fresh food is healthy and vitamin C, E and D are reduced during preservation. Before 1945 food and fodder quality was obviously lowest in May, before grazing period of cattle. Earlier elevated TOT in Apr and May was normalized after 1965, which could suggest (additionally to cold protection) on better food and fodder and their preserving (Table 1 and Figures 1-4). The mineral and vitamin status of people and cattle was possibly in 1891-1930 better in Sept than in Aug, which could reduce TOT in Sept. Higher TOT in Sept than in Aug after 1945 (when the annual dietary variation was decreased) and May TOT decrease after 1965 below annual average could be associated with psychological effects of light. Benefiting of new vitamin additives obviously increased in the 1950’s for cattle (at least advertisements, e.g. in “Karjatalous” Journal) asnd for human beings obviously decreased annual dietary variation.
Note: In 1891-30 TOT.min was reached in Sept (two months after Temp.max) and in 1945-2017 in Aug (one month after Temp. max). 1891-65 TOT.max was in Feb-Mar, later in Jan. The amplitudes of seasonal TOT variation were highest in 1891-1830.
Figure 1: Monthly total mortality (TOT) in three periods and temperatures of respective month and one and two months earlier.
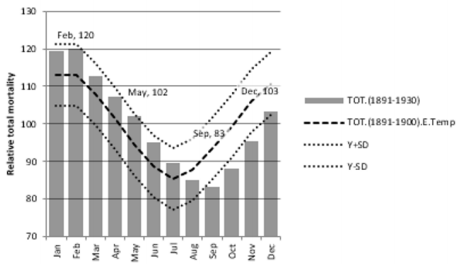
Note: In 1891-30 TOT.max in Feb (120) and TOT.min in Sep (83). Mortality in May (102) was reduced since Feb, but still above the annual average, about the same as in December (103). Y+SD and Y-SD are deviations caused by standard deviation.
Figure 2: Monthly total mortality (TOT) in 1891-1930 and its regression by temp
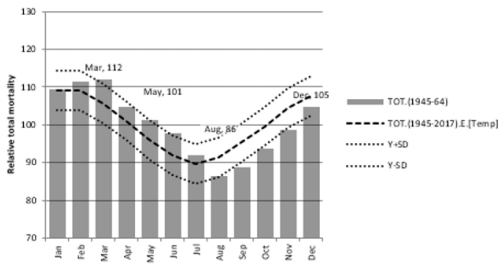
Note: In 1945-64 TOT.max in March (112) and Tot.min in Aug (86). Mortality in May (101) was still slightly above the annual average and slightly below that of December (105). Y+SD and Y-SD are deviations caused by standard deviation.
Figure 3: Monthly total mortality (TOT) in 1945-1964 and its regression by temp.
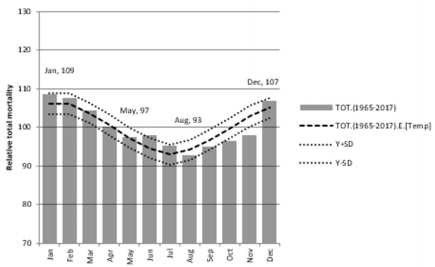
Note: In 1965-2017 TOT.max in Jan (109) and TOT.min in Aug (93). Mortality in May (97) was below the annual average, remarkably lower than in December (107). Y+SD and Y-SD are deviations caused by standard deviation.
Figure 4: Monthly total mortality (TOT) in 1965-2017 and its regression by temp.
Table 3: Periodical SD, Min, Max and Max/Min and Jan/Feb ratio and Periodical mean of annual Max/Min of monthly Tot during 1891-2017 from different periods.
Global Temp has been somewhat increased during 1891- 2017, but supposedly relative seasonal Temp variation has been on average the same, with maximum in Jul and minimum in Jan-Feb why Temp reference from 1981-2010 can be acceptable. The main aim was to observe seasonal variation in periods, Temp as the only numerical non-mortality parameter as a background for other discussion. As CVD mortality in Norway and Ireland 1985-95 TOT in Finland had its maximum in Jan and minimum in Aug (Table 1). Respective periodical mean of annual Max/Min and Jan/Aug ratio of TOT in Finland were 1.24 and 1.19 respectively (Table 2). They are slightly lower than CVD figures from 1985-95 in Norway (1.29 and 1.22) and moderately lower to Ireland figures (1.45 and 1.35) [1]. This difference can be based on different age groups (in Finland total population, in Norway and Ireland people over 60 years of age) or different seasonal variation in CVD and TOT mortality in 1985-95 or national differences. Stabilization in seasonal variation since the 1960´s (during development of CHD treatments) needs clarification.
Conclusion
The seasonal TOT variation was highest in 1891-30, next highest in 1945-65 and stabilized after that. Amplitudes of seasonal Finnish Tot variation in 1985-95 were slightly lower than those of CVD variation in Norway and Ireland. Causality of TOT variation and its changes are discussed.
Novel Strategies to Increase Sodium Removal and to Reduce Glucose Exposures in Peritoneal Dialysis-https://biomedres01.blogspot.com/2021/03/novel-strategies-to-increase-sodium.html
More BJSTR Articles : https://biomedres01.blogspot.com



No comments:
Post a Comment
Note: Only a member of this blog may post a comment.