Outcome Prediction of Bell’s Palsy by Kinect II
Introduction
Bells palsy is the most common acute mononeuropathy affecting a 7th cranial nerve. In some patients this leads to a permanent weakening of the muscles in one side of the face [1]. The grading system developed by House and Brackmann (HB) [2] ranges between I (normal) and VI (no movement). This and similar clinical scales allow only a very approximate assessment of the degree of muscle weakness. The presence of great interobserver variability of the subjective grading systems justify technological enhancements of objective classifications for facial nerve paresis. Holistic spatial analysis, such as principal component analysis, independent component analysis, local feature analysis, and linear discriminant analysis; and methods based on the outputs of local filters, such as Gabor wavelet representations and local principal components were used for automatically recognizing facial actions in sequences of images. Quantification of muscle weakness 3D scanners with Bell’s palsy was not to the best knowledge of the authors performed. The aim of this work is to design a simple outpatient system for monitoring asymmetry of muscle strength in patients with Bell’s palsy based on cheap 3D scanner Microsoft Kinect 2. MS Kinect’s 3D facial model is derived from the Candide3 model (https://www.icg.isy.liu.se/candide/). The Face Tracking SDK tries to fit a 3D mask to the users face.
Materials and Methods
The group of patients with unilatera Bell’s palsy included 7 men and 8 woman (19-56 years). Each subject was examined up to 3rd day from first symptoms. The second examination was one week later and control examination after 6 months. The following examinations were performed:
a) House-Brackmann scale
b) Conduction studies and needle EMG
c) Kinect II 3D facial mode recording
The parameter for outcome prediction was the grade of weakness in the first and second examination. Mean score was in the first examination 4.27 ± 0.96, in the second one 3.00 ± 1.18 and in the last examination 1.67 ± 0.98
Conduction Studies and Needle EMG
Conduction studies measure the compound muscle action potential of the response on the not affected side of the face upon stimulation and compares the amplitude of the response to that on the affected side. The measurement is thought to correspond to the number of remaining functional nerve fibers and thus to be predictive of the likelihood of spontaneous recovery. For example, in Bell palsy, patients who demonstrate greater than 90% amplitude reduction within 14 days of onset have a decreased chance of recovery. Needle EMG records electrical signals generated from the proximity of muscle fibers and displays changes of signal under pathological circumstances. First, it detects the fibrillation potentials that occur after about 2-3 weeks after injury. Then polyphasic reinnervation potentials appear. They may precede clinical signs of recovery by 6-12 weeks. This examination was used for outcome evaluation in the six months from the onset of illness [3-5].
Kinect II 3D Facial Mode Recording
On the basis of a priori knowledge about the anatomical localization of the observed muscles were chosen area of interest on the mask. Before selecting an area of interest, we first have to transform the marker points from the performance coordinate system to the model coordinate system. We used 3D face registration [6] based on the symmetry plane analysis on nose regions. We calculate the transform only once at the first frame of the performance data. Then we choose symmetrical areas of interest for monitoring the individual muscles and apply the same masks to all the other frames. The length-tension relationship is non-linear and is a compromise between tissue elasticity and muscle tension. To test the degree of weakening 6 muscles were selected. The first three represent the upper branch and the rest represent the lower branch of the facial nerve:
a) m. frontalis : eyebrow elevation
b) m. corrugator supercilii : bunching eyebrow (the formation of vertical wrinkles)
c) m. orbicularis oculi: eyes closed, rapid blinking
d) m. orbicularis oris: clamping lips
e) m. risorius: baring teeth
f) m. buccinator: inflating cheeks
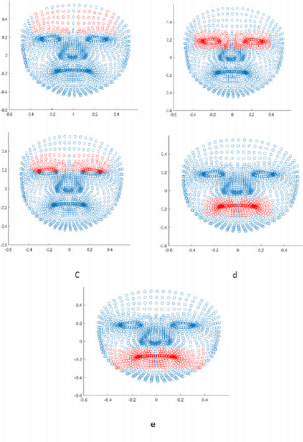
Accuracy of recorded data for each muscle was increased by space - time restriction. For each tested muscle the symmetrical mask covering region of interest was created (Figure 1). Movement of each muscle was evaluated only during specific task limited by time stamps.
a) Frontalis (44 points on each side out of 1347 points of the whole mask)
b) Orbicularis oculi
c) Corrugator supercilia
d) Orbicularis oris
e) Risorius and buccinator
Length od point trajectories in the region of interest on both sides were estimated in 3D space using Euclidean distance [7]. The parameter for outcome prediction was ratio of the sum of trajectories on affected a non-affected side in the first and second examination. The same ratio was evaluated for Hausdorf distance [8] between sets of trajectories on both sides (1st examination). The predicted value was the presence or absence of measurable deficit on the affected side at the third examination by conductive studies, needle EMG and House Brackmann scale. An abnormality in any of the listed methods was considered a poor outcome.
Data Analysis
A cross-validated SVM classifier [9] was optimized using Bayesian optimization. For separation of the data the radial basis kernel function was used. Parameters for optimization the error and margin width was performed by quadratic programming. Two feature vectors were used for binary classification. The Gaussian radial basis function kernel had a scaling factor 1. To estimate the quality of the results, leave-one-out cross-validation was used.
Discussion
Evidence of a high interobserver variability of the HB grading system would justify technological enhancements of objective classifications for Bell’s palsy. According to the study (Scheller et al.) interobserver variability was considerably different with respect to the three time points depending upon the severity of facial nerve paresis. Determining the outcome with HB scale could contribute to its best predictive value. Hausdorf distance overcome the predictive value Euclidean distance since the most important feature of the facial muscle paresis in the MS Kinect image is the proportion of the longest paths identifying points on face mask during voluntary contraction.
Results
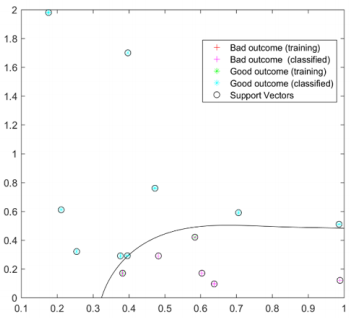
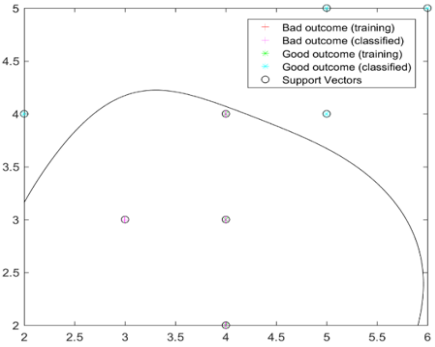
At the 3rd examination 5 patients had poor outcome. The best accuracy had House-Brackmann scale (0.87) (Figure 2). Hausdorf distance with accuracy 0.80 (Figure 3) outperformed Euclidean distance with accuracy = 0.67.
Figure 2: House-Brackmann scale in the first and second examination. Classification according to the outcome. Thanks to the semi-quantitative low resolution scale, many values overlap.
Conclusion
Although there are reservations about clinical scales, the Hause-Brackmann clinical scale has shown superiority over the distance measures in the facial mode of Kinect 2. This can be due to low accuracy of the Kinect 2 depth sensor. Introduction of other symmetry measures, time-space interpolation with 3D Kinect signal filtering or new 3D scanners with higher resolution could result in improvement in accuracy and reproducibility.
More BJSTR Articles : https://biomedres01.blogspot.com/


No comments:
Post a Comment
Note: Only a member of this blog may post a comment.