Determination of Air Quality index (AQI) of Aerosol Particles along Busy Roads in Karachi Metropolitan, Pakistan
Introduction
Air pollution is a global hazard and has immense effects on
human health, metrology, climatic changes and ecosystem. In developing
countries modernization and industrialization increases
the use of fossil fuel in many ways and producing environmental
damages especially in rapidly growing megacities [1,2]. According
to the World Health Organization (WHO), urban air pollution is
responsible for approximately 800,000 deaths annually around the
globe [3]. At present Particulate matter pollution is one of the most
important issue in urban cities, not only producing adverse health
effects, reducing the atmospheric visibility and also affect the status
of cultural heritages [4]. [5-7] show a strong association between
elevated concentrations of inhalable particulate (PM10) and increased
mortality and morbidity. Several researches associated
with particulate matter pollution also show increase in
hospitalizations, lung function disorder, asthma, bronchitis, other
respiratory
diseases and premature deaths (Sicard et al., 2011) [8-10].
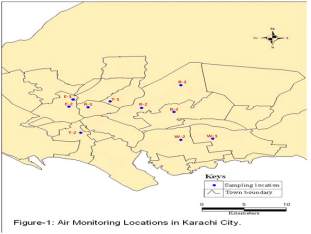
The air quality index (AQI) is a scale to show or characterize the degree of ambient air pollution at a particular monitoring location during a certain monitoring period (e.g., one, 8 or 24 h) due to the concentration of human activities that occur in cities. The main aim of AQI calculation is to aware the public about the risk of pollution level day to day and to prepare for precautionary measurement and to regulate the safety measures for health hazards (Figure 1).
Materials and Methods
Sampling was carried out at ten different locations consisting of main roads, side road, round about, and open places along the busy roads of Karachi during 2013 - 2017 for PM10. Selected locations were differentiated as Residential, Commercial and Industrial areas of the Karachi’s environment. PM10 samples were collected on glass fiber filters (203×254 mm) by using high volume air sampler with an average flow rate of 1.0 m3/min. Eight hour sampling was done in duplicate at each location during the year 2013-2017. The high volume is considered a reliable instrument for measuring the weight of PM10 in ambient air (USEPA-Method 40 CFR).
Air Quality Index (AQI)
In this study AQI has been calculated with reference to the concentration of particulate pollution proposed by US-EPA (USEPA, 2012). Following equation was used to calculate the AQI values by using the pollutant concentration data.

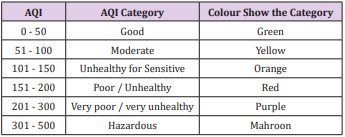
After compiling the data, the concentration of PM10 pollutant was converted in to an AQI value for each location, higher the AQI value, higher the level of air pollution and describe the associated health hazards, providing meaning full information to the citizens. The Table 1 shows the air quality index with the category of health risk. The air quality index zero to fifty is good for human health and indicate clean air, 50 to 100 indicate moderate air quality, 101 to 150 point toward unhealthy for sensitive group, 151 to 200 express unhealthy for all people, 200 to 300 very unhealthy, 301 to 500 hazardous and > 500 indicate sever hazardous (Table 1).
Result and Discussion
Evaluation of the concentrations of ambient PM10 were
determined on the basis of PM10 size fractions at the selected sites
in Karachi city. Ambient AQI values has been calculated with the
recorded pollutant concentration data of the selected sampling
locations, showing the degree / intensity of ambient air pollution
category at monitoring locations during a certain monitoring
period (e.g., 1, 8 or 24 h) due to its surrounding metrology and
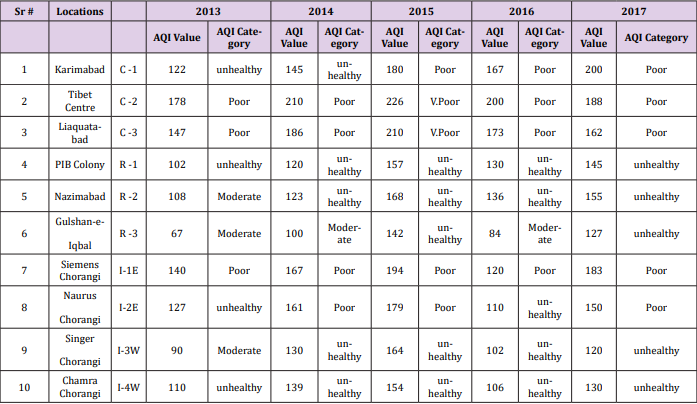
human activities and its relation to health hazards. Table 2 shows
the intensity of the pollution level according to AQI category. Yearly
average concentration of PM10 shows rising trend during the year
2013- 2015 and then a little bit start decreasing / controlling for
specific period. The result suggested that rising trend during the
year 2013 to 2017 may be due to civil works for overhead bridges
and extension of roads and island at different locations in Karachi,
again start rising after 2017 may be due to unplanned development,
many fold increase in vehicles on poorly maintained roads and
insufficient road spaces, less parking facilities, encroachment on
roads and footpath, violation of traffic rules with an alarming traffic
management strategy are the main issues of rising trend of urban
air pollution. The calculated Air Quality Index values for PM10
shows moderate and unhealthy pollution level in residential areas,
poor or unhealthy pollution level found at all the sampling locations
in industrial areas, whereas Poor or very unhealthy pollution level
has been recorded in commercial areas respectively.
Table 2: AQI values / Category of Aerosol Particles (PM10) at the selected locations in Karachi city.
Conclusion
The present study reveals that the concentration of suspended
particulate matter exceeded the permissible standards in highly
commercial areas, densely populated residential areas and in industrial
areas. High concentration of particulate pollutants has a
significant negative impact on the ambient air quality status of Karachi
city as in terms of Air Quality Index. The main source of pollutant
appears to be vehicular emission as its concentration is highest
in the sites located in the busy commercial areas of the city with
high traffic density. From the studies it is evident that development
and planning of the transport system and social awareness can play
a major role in improving the quality of air in the city.
More BJSTR Articles: https://biomedres01.blogspot.com


No comments:
Post a Comment
Note: Only a member of this blog may post a comment.