An Epidemiological Hypothesis of Policy-Shaped Drug Use Onset Curves
Introduction
United States (US) estimates show that ages 14 to 18 years old
is the interval of peak risk for starting extra-medical use of tobacco
and most internationally regulated drugs (EMIRD), with extramedical
use defined to encompass using the drug to get high and
otherwise outside boundaries intended by a prescribing clinician
(EMIRD as defined in supplemental material appendix S1; e.g., [1-
4]). US estimates generally show that consuming the ‘first full drink’
of an alcoholic beverage is an exception to this pattern of a single
mid-adolescent peak. Age-specific incidence of drinking alcohol
follows a distinctive bimodal pattern with the mid-adolescent peak
followed by a sharp decline, a second peak at the US legal minimum
drinking age of 21 years, and then a continuous decline as age
increases [5-7]. In this paper, we use the acronym PDPD to denote
this specific peak-decline-peak-decline bi-modal pattern. Cheng, et
al. [7] focused on the legal minimum drinking age (LMA) in their
explanation of the PDPD pattern in the age-specific estimates.
They posited existence of two heterogeneous subgroups within
each birth cohort. A more law-abiding subgroup of adolescents might tend
to delay onset of drinking a ‘first full drink’ until LMA
is reached at age 21 years. Another subgroup of cohort members
give less attention to the LMA policy, with drinking onset soon after
the first chance to try [i.e., first alcohol exposure opportunity, as
discussed by Chen, et al. [8]]. If this hypothesis is correct, readers
in countries with no LMA policy might find no bimodal pattern
(cf. [9]). With respect to cannabis, a natural LMA experiment is
underway in the United States, with some jurisdictions setting
cannabis LMA at age 21 years [10]. If Cheng and colleagues are
correct, the age-specific incidence patterns in these jurisdictions
might shift, eventually, toward the bimodal pattern seen for alcohol.
In this short communication, we present starting estimates on this
policy topic as a forecast of what might become a congruent PDPD
pattern for age-specific cannabis incidence rates. Our results depict
recent age-specific cannabis use incidence patterns in Colorado and
in Washington State by year, each with age 21 LMA for cannabis,
and we compare incidence rates in states with no cannabis LMA
[11,12].
Material and Methods
For this epidemiological study, the population was specified to
include non-institutionalized US civilian residents, sampled and
assessed for successive National Surveys on Drug Use and Health
(NSDUH), 2010 through 2017. These NSDUH cross‐sectional
surveys were conducted with multistage area probability sampling
to draw state-level representative samples and to over-sample
12-to17‐year‐olds, with overall interview participation levels of
67%-75%, slightly lower than corresponding levels for the 12-to-
22-year-olds in this study’s sub-samples. Standardized audio
computer-assisted self-interview modules assessed month and
year of first cannabis use, from which age-specific incidence rates
can be estimated from the NSDUH Restricted Data Access portal
(R-DAS). The R-DAS portal provides analysis weights and variance
estimate capabilities for state-specific and national estimates and
95% confidence intervals (CI).
For this research, the primary estimate is age-specific firsttime
cannabis use (incidence), calculated as ψ = Xr / Nr , where Xr is
the number of individuals starting to use cannabis within the 1-12
month interval before assessment, age-by-age, and Nr is all persons
who had not started using cannabis before that interval, stratified
by cannabis LMA policy. Estimates described in this report are
not readily available in R-DAS. The estimated prevalence rates (
1 / r p = X N , where N is the total projected population size) and the
estimated proportion of the population at risk ( 2 / r p = N N ), with
the corresponding standard errors can be obtained. We note that
the incidence can be calculated in term of p1 and p2 as:

The corresponding variance can be calculated using the standard statistical procedures as:

Furthermore, we discovered that R-DAS estimates can often be produced for the entire population of interest (e.g., age-specific cannabis incidence over all 50 states), and for a sub-population that includes a relatively large, unweighted numerator and denominator (e.g., first-time cannabis use in every state except Colorado and Washington). Nevertheless, estimates for the other subpopulation (e.g., age-specific cannabis incidence in Colorado or Washington) may often be suppressed due to privacy concerns. In the instance when two sub-populations can be considered mutually exclusive, we have developed a method for estimating the suppressed output “by hand” (Vsevolozhskaya, et al. 2014). Specifically, if we let ψ be the incidence of cannabis use in all 50 states, and CW ψ be the incidence of cannabis use in every state except Colorado and Washington, we can estimate the suppressed output as:

Where N is the projected population size in all 50 states and NCW N is the projected population size in every state except Colorado and Washington. Then, the corresponding variance of can be calculated as:

Given Colorado State and Washington State (CSWS) LMA policies implemented in 2014, we looked for PDPD patterns during 2010 through 2017 using two approaches. The first approach involved a panel study method with sample restriction to participants in the birth cohort born in either 1995 or 1996, successively re-sampled to secure a new sample each year. The panel approach has constrained statistical power, given its focus on that one birth cohort. The second approach is more tightly focused on what happens at age 21 years. The expectation is that cannabis incidence at age 21 years in CSWS will show an increase, versus relatively stable cannabis incidence at age 21 years in the other 48 states.
Results
Panel Study Approach
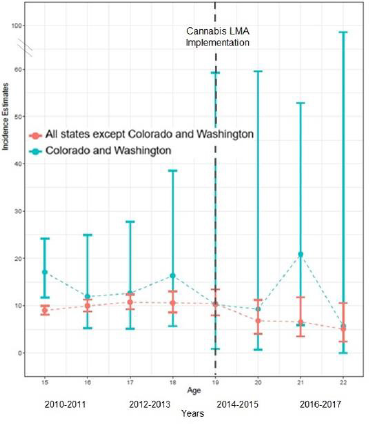
Figure 1 shows cannabis incidence estimates based on the panel study approach restricted to the 1995-96 birth cohorts, with state contrasts based on cannabis LMA policies. No PDPD bimodal pattern is seen for the non-LMA policy states (red lines). A hint of bimodality is seen in the CSWS data (blue lines), sufficient to motivate our proposed plan to analyze the more complete NSDUH sample data that is being withheld until after the COVID pandemic has ended, but not yet with statistical precision to warrant firm conclusions (Figure 1).
Figure 1: Trends in past year cannabis incidence by age in CSWS and all other states in the US, 2010-2017.
LMA-Stratification at Age 21
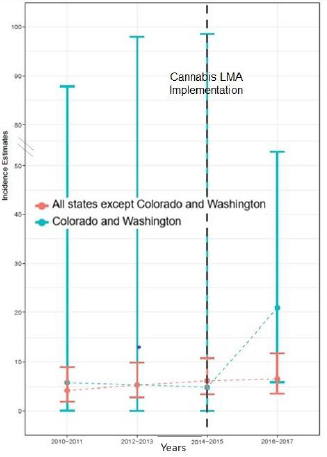
Figure 2 shows LMA-stratified year-pair-specific estimated cannabis incidence with focus on the NSDUH participants assessed at age 21. The mean cannabis incidence rate expectation for non- LMA states is relatively stable at about 5% becoming new users. For CSWS, the corresponding estimate is close to the estimate for the other states until after 2014-2015; the rate estimate for 2016-17 is just above 20%. Here, again, the statistical precision of estimates based on the R-DAS datasets is constrained. We must express hope for earlier rather than later access to the larger NSDUH samples and more recent data now sequestered in the restricted data enclaves until the COVID pandemic has ended.
Discussion
In this short communication, we build from the recent alcohol
LMA hypothesis offered by Cheng, et al. [7] and we present evidence
that a corresponding cannabis LMA hypothesis might deserve
attention in future research. Acknowledging constraints on the
statistical precision of the cannabis incidence estimates presented
in Figures 1 & 2, we look forward to pursuit of this research line
once we are allowed to tap the more complete NSDUH data in the
now-restricted federal enclaves. In the meantime, readers might
be interested to know how an LMA policy might exert an influence
on epidemiology’s patterns of age-specific incidence rates. In turn,
the epidemiologically disclosed age-specific patterns can be used
to guide organization and deployment of public health tactics of
early outreach and intervention, as well as prevention initiatives
intended to reduce hazards of drug use onsets during adolescence
and the transition to early adulthood.
Limitations of the research include reliance upon self-reports
about age and timing of cannabis onsets as well as uncontrolled
confounding between states. In time, the public use dataset sample
sizes also will be addressed when the enclave datasets become
available, and re-opening of the data enclaves will make it possible
to investigate sub-state variations, given that some within-CSWS
jurisdictions do not permit retail cannabis sales.
Notwithstanding these limitations, these analyses demonstrate
the potential for a large shift in long-standing patterns in age of
first use for cannabis in the US. Additionally, the study findings are
of interest because the hypothesis that LMA may be shaping agespecific
drug use incidence has never been tested. However, the lag
time for seeing such policy effects might take 5-10 years if cannabis
follows the experience with alcohol legal minimum age in the US
[13].
If this pattern continues to develop, there are new public
health considerations for this age group as well as the design
and implementation of cannabis prevention campaigns. Targeted
prevention campaigns for alcohol and tobacco use have been one
of the larger successes of public health and prevention, partly due
to age-specific and appropriately timed targeting [14,15]. In a
deviation from the traditional perspective that early adolescence is
the optimal window for prevention, if the hypothesized development
of the PDPD pattern continues, public health campaigns that seek
to reduce cannabis use may be optimized in separate approaches
for the law-ignoring teens who first use cannabis illegally vs.
the 21-year-olds who wait until cannabis use is legal for them.
Although more research is needed to investigate the theorized
policy-induced curve, if a sufficient number of states follow in the
footsteps of Colorado and Washington, we may see the age-specific
incidences for first time cannabis use begin to resemble the PDPD
pattern in the country overall [16,17].
Discussion
Supplementary Appendix 1.
For more Articles on : https://biomedres01.blogspot.com/


No comments:
Post a Comment
Note: Only a member of this blog may post a comment.