Lower Sensitivity of CAT and ER to Melatonin May Lead to Poor Ooplasmic Maturation of Porcine Oocytes from Heat Stress
Introduction
High temperature not only reduces the oocytes maturation quality [1-4] but also has a tremendous adverse impact on the animal ovarian function and embryo attachment [5,6]. Heat stress (HS) damage of oocyte can inhibit cumulus cells expansion [7], which lead to the abnormal distribution of organelles [8,9], decreased antiapoptotic and estrogen receptor gene expressions, enhanced apoptosis gene expression [10], as well as increased Reactive Oxygen Species (ROS) concentration [11,12] in the oocytes. In fact, excessive ROS can induce DNA damage and lipid peroxidation, disrupt the mitochondrial function [13,14], and induce abnormal gene expression and protein synthesis [15]. Reportedly, mitochondrial maturation distribution is an important indicator of the oocyte quality. Oocytes with poor maturation quality have a non-uniform mitochondrial distribution, whereas mitochondria are uniformly distributed in the ooplasm [16]. In order to protect oocytes from HS damage and improve their maturation quality, several materials are supplemented in the maturation medium during in vitro oocyte maturation, such as insulin-like growth factor, β-mercaptoethanol, astaxanthin, anthocyanins, Melatonin (MT), and coagulated proteins [17-20].
It has been reported that MT is involved in regulating several different physiological processes; it can promote the expression of antioxidant-related genes and improve the oocyte maturation quality and embryo developmental potential [21]. In addition, MT concentration of 10-9 M has been proven to be effective in promoting porcine oocyte maturation and development [22]. Oocyte maturation involves several complex events that coordinates nuclear and cytoplasmic maturation processes. Cytoplasmic maturation events following meiotic maturation is much more difficult to assess microscopically, such as the abnormal distribution of the mitochondria, lipid droplets [23], and Glutathione (GSH) concentration detection. However, the nuclear maturation process involves the Germinal Vesicle (GV) breakdown, chromosomal arrangement, and completion of Metaphase 1 (MI) by extruding the first polar body into the perivitelline space of the oocytes, all of which were observed by stereomicroscopy in a previous study [24]. It has been reported that HS can increase the expression of proapoptotic genes, enhance the activity of caspase proteins, and trigger the apoptosis pathway [25,26]. The members of the BCL- 2 family play a key role in regulating apoptosis, among which the expressions of the proapoptotic gene BAX and antiapoptotic gene BCL-2 as well as the ratio of these two gene expression levels are generally deemed as indicators for predicting the oocyte maturation quality and the embryo developmental potential.
Past studies in cattle have reported that the expressions of genes related to oocyte maturation quality and developmental potential were greatly reduced after the Cumulus and Oocyte Complexes (COCs) were subjected to HS at 41℃ for 12h. The present study discusses the sensitivity of BCL-2, BAX, CAT, and ER to high temperature and MT and analyzes the relationship among their sensitive differences and porcine oocyte maturation quality and developmental potential in vitro. We first discovered that the low sensitivity of CAT and ER to MT possibly contributes to the strong relationship with the poor porcine oocyte maturation quality and the developmental capacity of the embryos in vitro. We believe that the present results would be helpful in enhancing oocytes utilization and would provide a practical guide toward improving pig fertility during the high-temperature season.
Materials & Methods
All reagents used in this experiment were purchased from Sigma Chemicals (St. Louis, MO, USA), unless otherwise specified.
Oocytes Collection and Culturing In Vitro
The ovaries were acquired from a slaughterhouse and dispatched to our laboratory within 2 h of collection in a thermos flask containing sterile saline at 35-37℃. The COCs were extracted from follicles (of 2-6-mm diameter) with a disposable syringe (10 mL; No. 18 needle), and only COCs with uniform ooplasm and compact cumulus cells were maturation cultured in an incubator with 5% CO2 and 95% humidified air atmosphere, as follows: some COCs were cultured at 38.5℃ for 42 h in a maturation medium (Control, No HS); some COCs were cultured at 41.5℃ for 4 h and then transferred for continuous culturing at 38.5℃ for 38 h in the maturation medium (HS group); and the other COCs were cultured at 41.5℃ for 4 h in a medium supplemented with 10-9 M MT, after which it was subjected to continuous cultured for 38 h in a maturation medium at 38.5℃ (HSMT group). The maturation medium consisted of TCM199 (with Earle’s Salts; Gibco, Grand Island, NY, USA) supplemented with 10% porcine follicular fluid (PFF), 0.1 mg/mL cysteine, 0.065 mg/mL penicillin, 10 ng/ mL epidermal growth factor (EGF), 10 IU/mL equine chorionic gonadotropin (eCG; Intervet Pty. Ltd., Boxrneer, Australia), and 10 IU/mL human chorionic gonadotrophin (hCG; Intervet Pty. Ltd.). All the experiments were repeated thrice.
Assessment of the First Polar Body Expulsion Rate
The COCs from different groups were respectively stripped off cumulus cells by gentle pipetting in Phosphate-Buffered Saline (PBS) supplemented with 0.1% hyaluronidase, and the first polar body expulsion rate was determined under a stereomicroscope. A total of 150 denuded oocytes from each group were used for determining the rate of the first polar body expulsion. All oocytes used in the subsequent experiments had their first polar body expulsed.
Ooplasmic ROS Detection
ROS was detected using the Reactive Oxygen Species Assay Kit (S0033; Beyotime®, Haimen, Jiangsu, China) as per the manufacturer’s instructions. Briefly, 50 matured oocytes from each group were rinsed in the PBS solution thrice, followed by dying with 10× M ROS dye in the dark for 10 min. Next, photographs were taken under a fluorescence microscope (TE2000-s; Nikon, Japan). The fluorescence intensity analysis was performed with the Image J (Version 1.8.0) software, and the experiment was repeated thrice.
Ooplasmic Mitochondrial Distribution Analysis
Mitochondrial staining was performed with the Mito-Tracker Red CMXROS (C1049; Beyotime®) as per the manufacturer’s instructions. Briefly, 50 oocytes from each group were stained with 200-nM mitochondrial dye in the PBS solution for 25 min at 37℃ in the dark after washing in PBS thrice. Then, the stained oocytes were observed under the fluorescence microscope. The mitochondrial distribution pattern of porcine oocytes was then characterized based on two main distribution features: uniform distribution throughout the ooplasm or non-uniform distribution throughout the ooplasm.
Parthenote Production and Culture In Vitro
A total of 100 matured oocytes from each group were transferred to the activation medium (composed of 1.0 mM CaCl2, 0.1 mM Mg Cl2, 0.3 M mannitol, and 0.5 mM HEPES). Matured oocytes were activated with two pulses of 120 V/mm DC for 60 ms with the Electro-Cell Manipulator BTX 2001 (BTX Inc., USA). After activation, the parthenotes were subsequently cultured in 2 mM 6-dymethylaminopurine (6-DAMP) for 6 h and then the parthenotes were transferred into the PZM-3 medium for 7 days in an incubator at 39℃ under 5% CO2 atmosphere in humidified air. The rates of cleavage and blastocyst transfer were observed respectively on days 2 and 7 after oocytes activation.
Blastocyst Cells Staining
A total of 10 blastocysts were randomly selected from each group and fixed in 4% paraformaldehyde prepared in PBS containing 0.1% polyvinyl alcohol (PVA) for 1 h after washing thrice, and the blastocysts were then permeabilized in PBS-0.1% PVA solution containing 0.3% Triton for 30 min. After washing, the blastocysts were transferred to a solution supplemented with 10 μg/mL DAPI dye for 1 min, and then the blastocysts were mounted on a slide and covered with a coverslip. The total blastocyst count in each group was counted under the fluorescence microscope.
Gene mRNA Expression
The expressions of BCL-2, BAX, CAT, and ER were analyzed by reverse transcription-polymerase chain reaction (RT-PCR). Total RNA of 100 oocytes from each group was extracted by using the Micro RNA Extraction Kit (160027349; Qiagen, CA, USA) as per the manufacturer’s instruction. After washing in PBS, the oocytes were transferred to a 200-μL centrifuge tube for pre-cooling and then stored at -80℃ for further processing. After total RNA extraction, cDNA synthesis was performed for 30 min at 55°C using the Omniscript Reverse Transcription Kit (Invitrogen) with oligodT primer. PCR was performed by using the Maxime PCR Premix with SYBR Green (TaKaRa Bio Inc., Otsu, Japan) supplemented with each primers and cDNA samples under the following conditions: predenaturation at 95°C for 3 min, denaturation at 95°C for 15 s, annealing at 56°C for 30 s, elongation at 72°C for 30 s, and a final extension at 72°C for 5 min for 40 cycles using the Eppendorf Mastercycler (Eppendorf, Hamburg, Germany). According to the mRNA sequences of Sus scrofa genes published on Gen Bank, we designed primers with the Primer 5.0 software and synthesized by Shanghai Bioengineering Co., Ltd. (Shanghai, China). The primers used in the present study were verified for their availability by RTPCR. Real-time quantitative PCR was performed by the comparative Ct (2 -△△Ct ) method, and the results obtained for each gene in each cDNA pool were normalized based on the GAPDH ratio. The primers and Genebank source accessions for each gene are listed in Table 1.
Statistics
The percent values were subjected to log transformation before analysis, and the quantitative data were analyzed by least-square analysis of variance (ANOVA) using the General Linear Models (GLM) procedures of the Statistical Analysis System (SAS Institute, Cary, NC, USA). We corrected the real-time PCR data by using the GAPDH data as a covariate for the analysis of differences. All data were expressed as mean ± SEM, with P < 0.05 deemed as statistically significant. All experiments were repeated thrice.
Results
Assessment of the First Polar Body Expulsion Rates of Oocytes in Different Groups
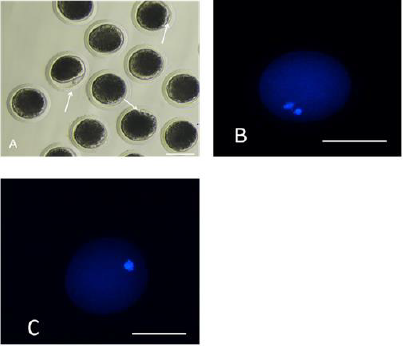
The first polar body expulsion rates of porcine oocytes are given in Table 2. Although the first polar body expulsion rate greatly decreased in the HS group in comparison with that in the control group, the corresponding rate in the HSMT group significantly increased again but exhibited no significant difference with that in the control group (P > 0.05). The first polar body of porcine oocytes was observed under a stereomicroscope (Figure 1A), and the observation was confirmed under a fluorescence microscope (Figure 1B). Figure 1C represents oocytes without the expulsed first polar body, indicating that fluorescence occurred only at the nuclear sites observed under the fluorescence microscope.
Figure 1: Porcine oocytes with or without the first polar body expulsed
A. The stereomicroscopic examination of the matured oocytes with the first polar body expulsed, as pointed by the arrows.
B. The matured oocytes were stained with fluorescent dye Hoechst 33342, where both the polar body and the nucleus exhibited fluorescence.
C. Oocytes with no polar body expulsed were stained with fluorescent dye Hoechst 33342, where only the nucleus exhibited fluorescence as pointed by the arrows. Bar=100 μm.
ROS Concentration in Oocytes of Different Groups
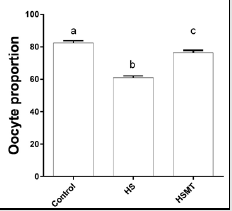
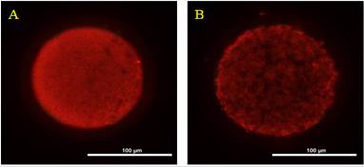
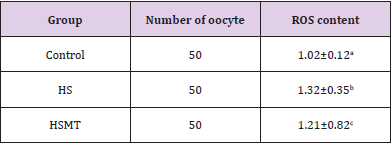
The ROS concentrations in the HS group was significantly increased relative to those in the control group. In addition, although the ROS concentration in the HSMT group decreased significantly, it remained significantly higher than that in the control group as showed in Table 3 (P < 0.05). The proportion of oocytes with uniform mitochondrial distribution in porcine oocytes of different groups. Figure 2 supports that the proportion of oocytes with a uniform mitochondrial distribution in the HS group was significantly lower than that in the control group (P < 0.05). Although the proportion of oocytes with uniform mitochondrial distribution was greatly enhanced in the HSMT group, it remained significantly lower than that in the control group (P < 0.05). Figure 3 represents the uniform and non-uniform mitochondrial maturation distribution in the ooplasm.
Figure 2: The proportion of oocytes with better mitochondrial maturation distribution in different groups. Different letters (a-c) over a bar means significant difference (P < 0.05). Each experiment was repeated three times.
Figure 3: The condition of mitochondrial maturation distribution in ooplasm Oocyts were fluorescent stained by Mito-Tracker Red, and A. Represents the oocyte of better maturation quality with even distribution of mitochondria in ooplasm. B. Represents the oocyte of poor maturation quality with uneven distribution of mitochondria in ooplasm. Bar = 100 μm.
Assessment of Porcine Oocytes Developmental Potential In Vitro
As can be seen in Table 4, the cleavage rate, blastocyst rate, and the total number of blastocysts were significantly lower in the HS group than in the control group (P < 0.05). As compared with those in the HS group, the rates of cleavage, blastocysts, and the total number of blastocysts in the HSMT group were significantly increased (P < 0.05), with no significant difference in the cleavage rate relative to that in the control group (P > 0.05). Nevertheless, the blastocyst rate and the total number of blastocysts remained significantly lower than the respective control values (P < 0.05). The results of blastocyst cells staining are depicted in Figure 4.
The mRNA Expressions of CAT, BCL-2, BAX, and ER in Oocytes of Different Groups
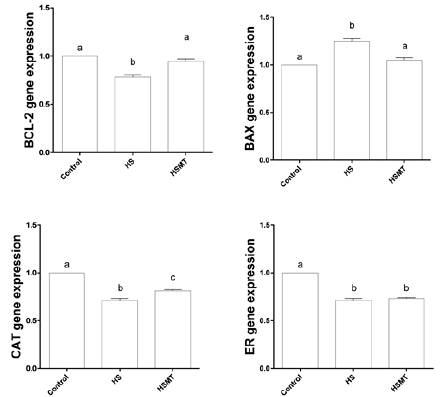
As shown in Figure 5, the mRNA expressions of CAT, ER, and BCL- 2 were decreased, whereas the BAX expression was significantly increased in the HS group in comparison with those in the control group. However, in the HSMT group, the mRNA expression levels of BCL-2 and BAX were restored to the control levels, while the CAT and ER expressions remained significantly lower than the control values (P < 0.05). Moreover, no significant difference was noted in the mRNA expression of ER between the HS and HSMT groups (P > 0.05).
Figure 4: The fluorescence staining of blastocyst cells. The blastocyst cells was fluorescent stained with 10μg/ml DAPI dye and a number of 10 blastocysts randomly selected from each group.
A. The blastocyst comes from the Control
B. The blastocyst comes from the HS group
C. The blastocyst comes from the HSMT group. Bar = 100 μm.
Figure 5: The mRNA expressions of CAT, BCL-2, BAX and ER genes in oocytes of different groups. Different letters (a-c) over a bar means significant difference (P < 0.05). Each experiment was repeated three times.
Discussion
Previous studies have shown that the effects of MT exposure on protecting oocytes from HS damage varied among different animals. Negrón-Pérez reviewed that the cleavage rate and the total number of blastocysts in dairy cows increased when MT was supplemented in the HS system [27], while another bovine study demonstrated that MT has no significant effect on the cleavage rate and on the total number of blastocysts [28]. The present study on porcine suggested that, although 10-9 M concentration of MT could significantly improve the cleavage rate, the blastocyst rate and total cell of blastocysts remained significantly lower in the HSMT group than in the control group (P < 0.05). Indeed, neither previous bovine studies nor the present porcine study indicated whether high-concentration MT supplementation could increase the total cell of blastocysts. With regards to porcine oocyte maturation, the ooplasmic maturation is usually evaluated by some molecular events, bioreaction, or organelle distribution [29], and the nuclear maturation is estimated by the first polar body expulsed into the perivitelline space of oocytes [30].
The results of the present study indicated that the first polar body expulsion rate was greatly increased in the HSMT group in comparison with that in the HS group, exhibiting no significant difference relative to that in the control group. We thus speculated that supplementation with 10 IU/mL Equine Chorionic Gonadotropin (eCG) and 10 IU/mL human Chorionic Gonadotrophin (hCG) to the maturation medium was sufficient for porcine oocyte nuclear maturation in the present experiments, considering that gonadotropins are responsible for the resumption of oocyte meiosis and for the promotion of nuclear maturation by the cAMP/PKA/MAP kinase pathway [31]. Although MT supplementation could significantly increase the ratio of oocytes with a uniform mitochondrial distribution, it remained significantly lower in the HSMT group than in the control group. Several other researches have demonstrated that HS could influence abnormal mitochondrial distribution, which is detrimental to oocyte maturation and development in vitro [32-37]. The data from production also suggests that the ooplasmic mitochondrial distribution was poor during the summers, but it improved during the autumn season [38].
The poor mitochondrial maturation in the HSMT group oocytes may attribute to the higher intracellular ROS concentration, considering that ROS is one of the main factors that result in diverse damages to oocyte maturation and development [39-42]. The present experiments demonstrated that 10-9 M MT concentration is insufficient to eliminate the excessive ROS in the oocytes of the HSMT group. Our study is the first to indicate that the BAX and BCL-2 were sensitive to both high temperature and MT. As for the CAT, 10-9 M concentration of MT could not restore its expression to the control level, which may explain the higher ROS concentrations in the HSMT group. Estrogen receptor gene is closely associated with the fertility of female animals and follicular development and oocyte maturation [43-45]. In our study, we found that the ER was sensitive to high temperature, but extremely insensitive to MT exposure. The reduction in ER expression induced the lack of binding sites for estrogen, which lowers the fertility of female animals under hot conditions [46]. Recent data in production also confirmed that the fertility of sow was lower in the summer season than in other seasons [47]; moreover, past studies in cows have reported that subcutaneous implantation with 18 mg MT could only partially alleviate the adverse effects of HS on the reproductive performance of cows in the hot season [48-50].
Backed by our research, we propose that the reduced secretion of MT and the insensitivity of ER to MT is most probably related with the lower fertility of animals in high temperature season. However, until date, the quantity of MT required to counteract the adverse effects of HS on pig remain unreported. Based on our experiments, we believe that much more than the 10-9 M concentration of exogenous MT would be required. The present experimental results imply that the lower fertility of animals in high temperature season can be attributed to the sensitive differences in the expressions of BCL-2, BAX, CAT, and ER to high temperature and MT, which provides important insights to the application of MT toward improving the fertility of animals during the high temperature season.
Conclusion
BCL-2 and BAX were found to be sensitive to both high temperature and MT exposure; however, CAT and ER, especially the latter, were found to be sensitive only to high temperature and extremely insensitive to MT exposure. The sensitive differences in these genes contributed to poor ooplasmic transfer, lack of nuclear material transfer, and maturation, which further hampered the developmental capacity of porcine oocytes.





No comments:
Post a Comment
Note: Only a member of this blog may post a comment.