Whole Exome Sequencing or Pan-Myeloid NGS Gene Panel to Assess Leukemic Evolution of Myelodysplastic Syndromes. Advantages and Disadvantages
Introduction
Myeloid Neoplasms (MN) encompass a group of clonal diseases clinically and biologically heterogeneous characterized by the dysregulation of hematopoiesis, as a consequence of Hematopoietic Stem Cells (HSC) excessive proliferation and abnormal myeloid linage cells differentiation. They comprise different hematological entities such as Acute Myeloid Leukemia (AML), Myelodysplastic Syndrome (MDS) and Myeloproliferative Neoplasm (MPN). As a result of the genetic heterogeneity of MN, recent studies have highlighted the im-portance of genomic testing (rather than individual gene testing) to comprehend the pathogenesis of MN [1,2]. Due to its wide scope Massive parallel Sequencing (also known as Next Generation Sequencing, NGS) is becoming the technique of choice for genomic characterization of clinical samples, being not just a crucial tool for the discovery of new gene mutations, but also as a regular technique used in molecular laboratories to improve patient diagnosis, prognosis and treatment based on identified tumor variants. Regarding the number of targeted genes, there are different types of NGS DNA sequencing. Those NGS strategies designed to interrogate a few genes frequently mutated in a given disease are the so-called NGS gene panels. Another NGS strategy is Whole Exome Sequencing (WES), exons are thought to encompass ~2.5% of the total human genome, and WES allows the identification of variations in the protein-coding regions of any gene, rather than only in a selected list of genes [3]. In this study we aim to determine the variant calling efficiency of both NGS techniques (WES and a custom NGS gene panel) in MN of different infiltration levels, addressing their advantages and disadvantages.
Materials and Methods
Sample Collection
We collected 24 samples corresponding to 8 patients with MDS that transformed to AML: 16 bone marrow (BM) and 8 T cells CD3+ sorted from peripheral blood.
Genomic DNA
QIAamp DNA Blood Mini Kit (Qiagen, Hilden, Germany), was used to extract genomic DNA from all samples. The extracted DNA was then quantified using Qubit dsDNA BR Assay Kit on a Qubit 3.0 Fluorometer (Life Technologies, Carlsbad, CA, USA), and the DNA quality was assessed by DNA genomic kit on a Tape Station 4100 (Agilent Technologies, Santa Clara, CA, USA). Patients’ personal information and samples included in this study were provided by the Biobank of the University of Navarra (UN) and were processed following standard operating procedures approved by the CEI (Comité de Ética de la Investigación) of UN. All patients provided informed written consent to use data from their medical records (age, gender, and diagnosis…) for research purposes, once patient’s data had been fully anonymized.
Pan Myeloid-Panel (PMP)
Library Preparation: Our custom NGS panel targets 48 genes [4]. NGS libraries were constructed following manufacturer’s instructions (SOPHiA GENETICS, Saint Sulpice, Switzerland). The quality of the final NGS libraries was assessed using DNA D1000 kit, and visualized on Agilent 4100 Tape Station (Agilent Technologies, Santa Clara, CA, USA), and then quantified using Qubit dsDNA HS Assay Kit in a Qubit 3.0 Fluorometer (Life Technologies, Carlsbad, CA, USA). According to the manufacturer’s instructions, 8 libraries were pooled at a final concentration of 10.5pM, and pair-end sequenced on a MiSeq (Illumina, San Diego, CA, USA) with 251 × 2 cycles using the Reagent Kit V3 600 cycles cartridge.
Variant Data Analysis: Sequencing raw data were obtained from the MiSeq instrument, and then uploaded onto SOPHiA GENETICS DDM platform (SOPHiA GENETICS, Saint Sulpice, Switzerland). This software performed read alignment, variant calling of Single Nucleotide Variants (SNV), insertions and deletions (indels), and also variant annotation. Two geneticists with expertise in hematological malignancies firstly filtered out variants that were intronic, intergenic, and synonyms, and then classified the remaining filtered-in variants according to the Spanish Group of Myelodysplastic Syndromes [5] and the American College of Medical Genetics and Genomics (ACMG) guidelines [6]. Moreover, the presence of the filtered-in variants was manually confirmed within the Integrative Genomics Viewer (IGV) software (Broad Institute) [7].
Variant Data Analysis: Sequencing raw data were obtained from the MiSeq instrument, and then uploaded onto SOPHiA GENETICS DDM platform (SOPHiA GENETICS, Saint Sulpice, Switzerland). This software performed read alignment, variant calling of Single Nucleotide Variants (SNV), insertions and deletions (indels), and also variant annotation. Two geneticists with expertise in hematological malignancies firstly filtered out variants that were intronic, intergenic, and synonyms, and then classified the remaining filtered-in variants according to the Spanish Group of Myelodysplastic Syndromes [5] and the American College of Medical Genetics and Genomics (ACMG) guidelines [6]. Moreover, the presence of the filtered-in variants was manually confirmed within the Integrative Genomics Viewer (IGV) software (Broad Institute) [7].
Whole Exome Sequencing (WES)
Library Preparation: Extracted DNA was sent to Macrogen Korea, where they carried out library preparation using Sure Select Human all exons V6+UTR (Agilent Technologies, Santa Clara, CA, USA), that is based on hybridization capture technology and counts on a total genomic footprint of 35.7 Mb. Tumor samples were pooled aiming for a higher depth (200X) than that desired for the constitutional samples (60X). Libraries were pair-end sequenced on a HiSeq 2500 (Il-lumina, San Diego, CA, USA) with 201 x2 cycles using the Reagent Kit V4 250 cycles cartridge, according to manufacturer’s instructions.
Variant Data Analysis: Whole Exome Sequencing raw data was directly obtained from the HiSeq 2500. To obtain bam files, alignment was performed using BWA Aligner, Samtools SORT performed sort, and duplicates were marked with PicardTools. To obtain the variant calling files, bam files analysis was performed using VarScan version 2.3.9, with strand bias filters and setting minimum read to 5. Annotation of the variants was performed with ANNOVAR software.
Results
Depth of Coverage
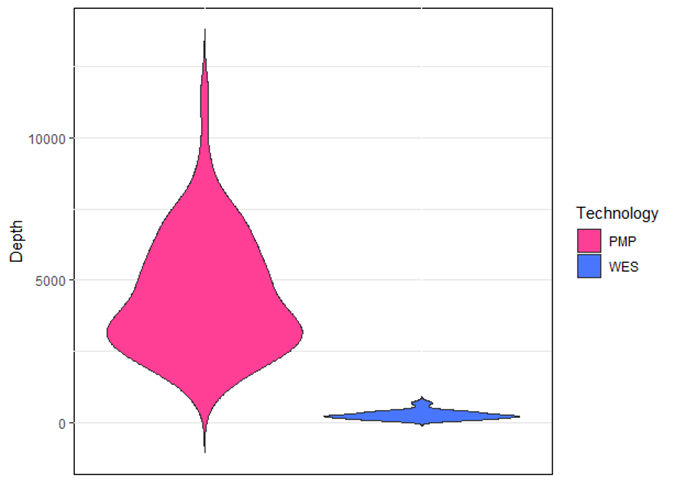
Depth of coverage is the average number of mapped reads at a given locus. Low coverage in a given genomic location would limit the ability to confidently call a variant present in such location, especially if the variant is present at low allele frequency, hence the importance of a good depth of coverage. The mean depth of coverage for each technique is shown in Figure 1: 4500X for PMP and 250X for WES; a mean coverage of 1000X allows detection of clones present at 0.1% VAF (cut-off value of 10 reads, assuming there is no strand-bias).
Figure 1: Variants read depth comparison between PMP and WES. The average of coverage was 4500x for PMP and 250x for WES. PMP=Pan-Myeloid Panel; WES= Whole Exome Sequencing.
Variant Analysis
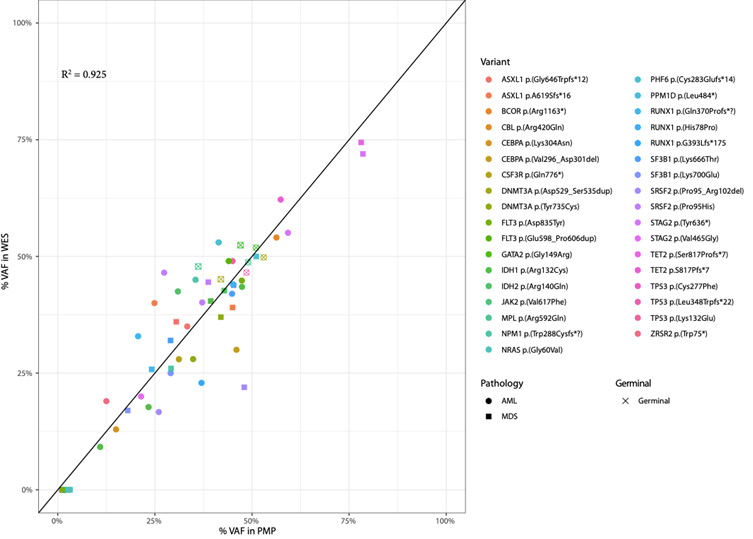
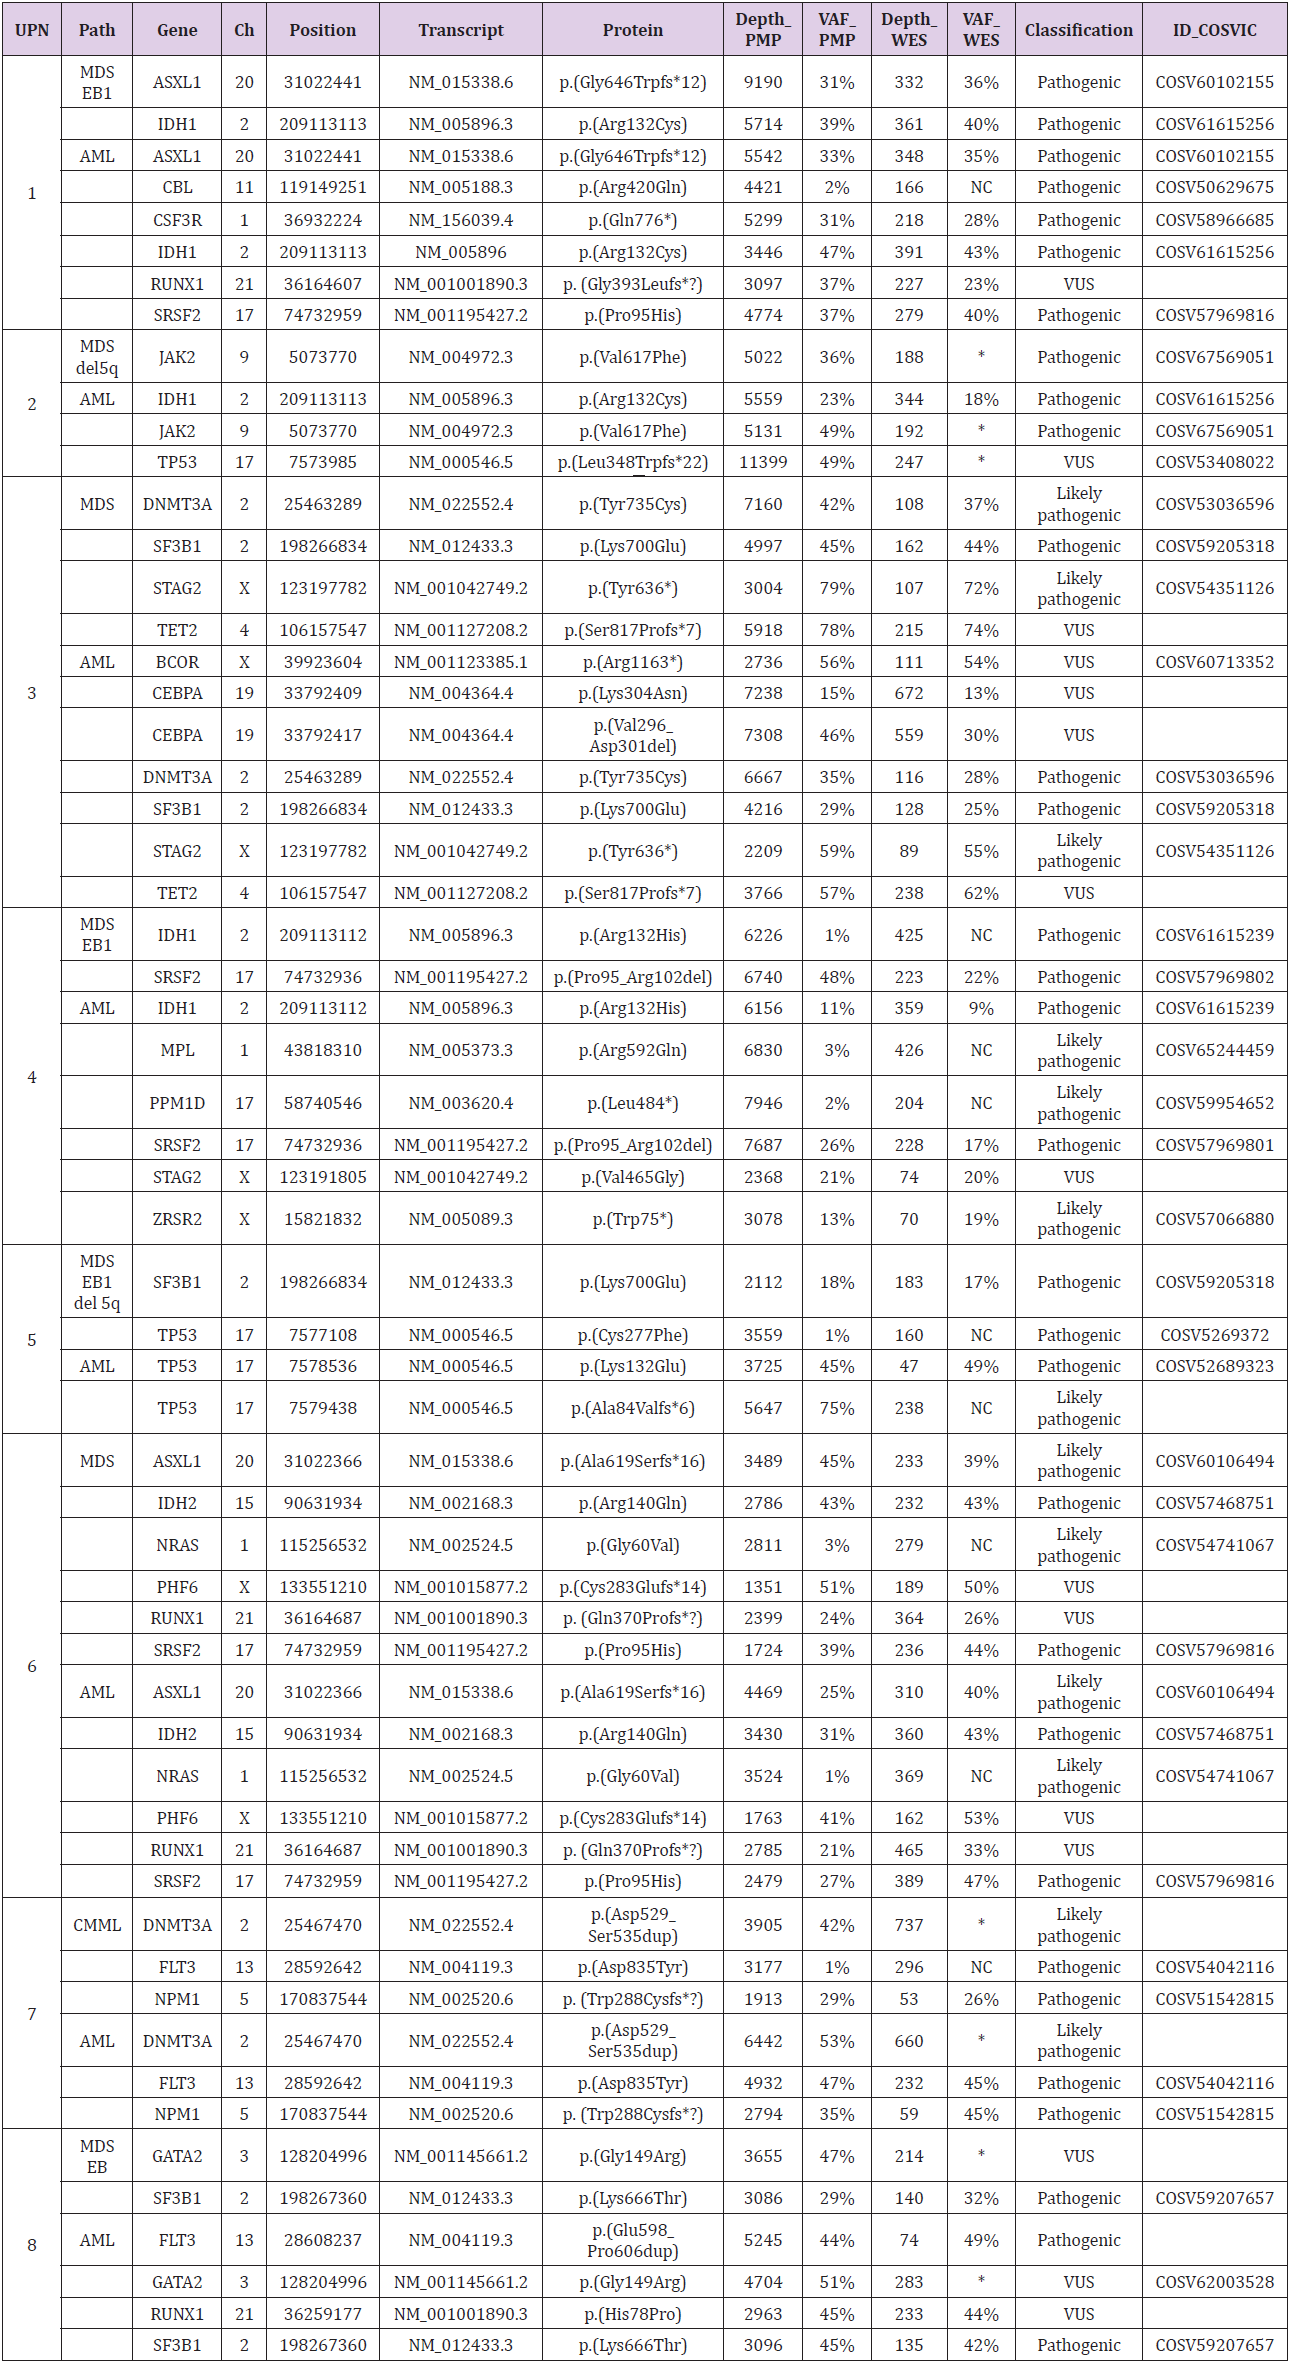
We performed an analysis of all variant VAFs called by PMP and WES in the genes included in PMP design (Table 1 & Figure 2). The results showed that PMP called a total of 59 clinically relevant variants and WES called 211 variants, 44 of them in genes included in PMP panel design. On the one hand, after careful assessment of all variants by visualization with IGV, we noted that, out of the 15 variants not called by WES, 7 were characterized by presenting a VAF<5% with PMP; and additional 7 variants were not called because they were detected in T cells CD3+ at a VAF~50%, meaning that these 7 variants are of germline nature. In both types of scenarios, the 14 variants were filtered out by the bioinformatics pipeline. Of note, the 15th WES-missed variant in UPN5 was a 115bp insertion in TP53 p.Ala84Valfs*6 at a VAF of 75%, that was called by PMP but not by WES, because it was either not captured during library preparation, or it was not correctly aligned against the genome hg19. On the other hand, PMP test only missed 1 variant in GNAS p.Arg844Cys that was called by WES, because the gene was not included in panel design.
Figure 2: Correlation analysis of the Variant Allele Frequencies (VAFs) detected by the panel (PMP) and by WES. The VAF’s correlation was high for the variants detected by both techniques (R2= 0,925).
Table 1: Detailed description of variants called by PMP and WES in the 8 patients with MDS that progress to AML.
Note: UPN: Unique Patient Number; Path= Pathology; Chr: Chromosome; PMP= Pan-Myeloid panel; WES= Whole Exome Sequencing; VAF= Variant Allele Frequency; MDS-EB1= Myelodysplastic Syndromes with Excess Blast 1; AML= Acute Myeloid Leukemia; CMML= Chronic Myelomonocytic Leukemia; NC= Not called; *VAF~50% in CD3
Discussion
As genomic technologies continue to improve, NGS-based tests might become stand-alone in the short term. Therefore, since clinicians are ultimately responsible for communicating test results to patients, it is crucial for them to understand the differences and difficulties, in terms of the NGS technologies, test interpretation and clinical significance. In order to address the distinct advantages and disadvantages of the two technologies at study, we sequenced 24 samples (16 BM and 8 T cells CD3+) corresponding to 8 patients with MDS that transformed to AML. All 24 samples were tested by WES, and all 16 BM samples were tested by our custom panel PMP. Gene panels minimize the chance of secondary findings, due their targeted nature, but require periodic design revisions in order to be updated by incorporating new gene discoveries, while WES offers the advantage of a wider scope in terms of number of genes analyzed, enabling the identification of variants at loci not considered at point of ordering, and providing data for genes not yet associated with the disease at study [8]. UPN4 is a good example of this: only WES called the pathogenic variant GNAS p.Arg844Cys; GNAS is a gene related to MN, but it was not included in PMP design (it has been included in later versions of the panel). Besides, WES data offers the possibility of being analyzed only for the genes of interest at a given time point and, later on, being re-analyzed when new genes related to the pathology are discovered, and in that way yielding relevant genetic information not identified at the time of initial assessment.
Even though WES offers greater breadth of coverage, it comes with some compromise in read depth [9]. Therefore, variants with low VAF might scape to WES analysis. Indeed, our data showed that WES missed several variants with low VAF that had been called by PMP (1 in CMML, 3 in MDS and 5 in AML). This is especially important in those cases where PMP called small clones with pathogenic variants IDH1 p.Arg132His, FLT3 p.Asp835Tyr and NRAS p.Gly60Val at a VAF≤3% in the premalignant samples (UPN4, UPN5 and UPN7), because these findings directly affect MDS IPSS risk, preventing the patients to get a more suitable treatment and disease follow up. Therefore, if those cases had exclusively been assessed using WES, they would have missed the opportunity of benefitting from those available treatments. Besides, targeted panels usually are conceived together with a software that greatly facilitates data analysis, whereas WES presents the challenge of interpreting large volumes of data with a higher chance of identifying variants in genes of unknown significance to the disease at study [10]. Consequently, analysis of WES sequencing data usually needs the labor of an expert bioinformatician together with an expert geneticist. Also, WES comes with the requisite of sequencing germline tissue alongside the sequencing of the tumor sample, in order to discard polymorphisms; otherwise, the volume of data would be simply impossible to be interpreted even by the best experts in both fields. These requirements make WES more expensive and laborious than panels.
Our data showed 7 variants called by PMP that were not called by WES, precisely because they were present in T cells CD3+ at a VAF~50%, meaning that these 7 variants might be of germline nature. Interestingly, one was the well-known pathogenic JAK2 p.Val617Phe (UPN2). Indeed, the necessity of sequencing a nontumoral tissue in order to be able to discriminate the nature of the variants has been reported in several studies, due to its potential impact in genetic counselling [11-13]. NGS gene panels and WES are limited in their capacity to detect specific DNA abnormalities, such as CNVs, long indels, and variants in repetitive regions. Surprisingly, our results showed that WES missed a 115 bp insertion in TP53 p.Ala84Valfs*6 (UPN5) that was called by PMP at a VAF of 75%. Because it was not in the BAM file of the sample, the variant was not in the VCF, therefore the cause was either failure in exome capture during library preparation, or maybe the raw sequencing data was not correctly aligned against the genome hg19 [14]. Therefore, the use of additional sequencing techniques to improve the number of reads, are necessary to minimize false negative results due to the low coverage of certain genomic regions [15,16].
Conclusion
Although it was not the main goal of the study, our data highlight the importance of sequencing germline tissue, since distinguishing the nature of the variant has a direct impact in genetic counselling. It should be noted that inherited variants conferring predisposition to develop a neoplasm are becoming highly important in all cancers, including MN. Therefore, this issue also needs to be considered when analyzing WES data, since WES pipeline filters out all germline variants. Regarding WES vs NGS gene panels, we conclude that both techniques are clinically valuable: WES is advantageous for the discovery of new variants, and NGS gene panels are essential for the detection of emerging clones. Therefore, they complement each other, and together they provide a more accurate image of the clonal heterogeneity of the tumor.


No comments:
Post a Comment
Note: Only a member of this blog may post a comment.