Monitoring BTEX Adsorption on to Organoclays in Aqueous Solution: Multi-isotherm and Kinetics Studies
Introduction
The vast amount of organic pollutants such as BTEX, PAHs, Phenols etc, present in the aquatic environment today is a matter of global concern which requires an urgent attention. BTEX is the acronym for the group of volatile organic compounds (VOCs) benzene, toluene, ethylbenzene and xylene. Anthropogenic sources of BTEX in ambient air largely include petrochemical fuel derivatives such as petrol or gasoline, automobile emissions, and the use of solvents and paints [1-6]. In urban areas, the combustion of gasoline and diesel fuels, especially for motor vehicles, constitutes the most important source of BTEX [6-10]. BTEX compounds are volatile and easily vaporize at temperatures above 200°C, and hence fugitive emissions from fuel storage facilities and transportation activities are also important sources of BTEX [9,11]. A number of studies have reported high ambient concentrations of BTEX during fuel tank filling [12-14], from oil and gas operations [14-16], and during solvent usage and spills from accidents [10,14].
It is known from the literature that these compounds have a negative impact on the environment since they contribute to the formation of ozone and other photochemical oxidants [17,18]. Moreover, BTEX are either known for being, or suspected to be, irritants, neurotoxins, allergens or carcinogens [19] and their exposure on a long term basis presents a serious threat to the human health [20,21]. Therefore, implementing effective strategies for pollution control is of paramount importance to limit human exposure and prevent environment degradation [18,22]. Many conventional methods can be employed to remove BTX from water and wastewater, including adsorption, aeration, biological oxidation and chemical oxidation [18]. Of these, adsorption processes involving porous solids are the most popular, and are widely utilized in engineering practice since they permit the recovery of these compounds [23]. Various mineral and organo-mineral sorbents have recently been regarded as alternative adsorbents which are potentially useful for the removal of BTX from water [24-40].
Clay is generally considered ineffective for sorption of hydrophobic organic compounds like BTEX and Polycyclic aromatic hydrocarbons (PAHs) due to its hydrophilic surface [33,40]. Montmorillonites (MMT) are commonly used clays owing to their high cation exchange capacity (CEC), swelling properties, and high surface areas but they are hydrophilic but can be modified for hydrophobic sorption by a simple organophilicization achieved by ion exchange reaction between clay surface ions and those of organic cations [33,40,41]. In attempt to design this new adsorbents to remove non-ionic organic contaminants from waste water, several researchers have replaced the inorganic exchange cations with quaternary amine cations [(CH3)2NHR]+, where R is a large alkyl hydrocarbon chain, yields organoclays with organophilic clay surfaces, by simple ion-exchange reaction [42,43]. It is generally accepted that adsorption of hydropholic long-chain quaternary ammonium cations onto clays occurs according to the ion-exchange mechanism [44,45].
The adsorption extent of such cations can approach double the cation-exchange capacity (CEC). Earlier workers reported that the lyophilic tails from cations of long-chain quaternary ammonium salts, previously retained on the clay, lead to the adsorption of organics such as benzene, toluene, phenol, and its chlorinated compounds and herbicides [43,45,46]. Therefore, the present study monitors BTEX Adsorption by HDTMA+ and TMPA+ Intercalated Montmorillonite clay. Effect of adsorption parameters such as contact time and initial adsorbate concentration, multiple adsorption isotherms and kinetic models were used to study the sorption mechanism.
Experimentals
Adsorbents
The montmorillonite (Mt) clay exploited in this research were collected from Ropp, Plateau State, situated at Longitude 80E and Latitude 90N, Northern Nigeria, and the clay was beneficiated according to our previous study [40]. The pure Mt was pre-modified by adopting the methods of Baskaralingam [47]. High-purity Mt was mixed with sufficient amount of 1M NaCl using a mechanical stirrer (6000 rpm for 24h) at room temperature of 250°C. The Na-Mt was then separated and washed four times with distilled water to remove any trace of chlorides, which was confirmed by the addition of 1M AgNO3, resulting to the absence of a white or off-white precipitate. Wanders and Fourie’s Procedure [48] was followed to impregnate the pre-modified Montmorillonite (Na- Mt). 21 g of Na-Mt each was separately added to 0.54 L of distilled water. The impregnated Na-Mt was prepared by separately adding the surfactants (HDTMA and TMPA) to their individual mass value equivalent to twice the clays’ CEC. The mixtures were separately kept in suspension for 24 hours at 160 rpm and 25°C by using a temperature controlled orbital shaker. The impregnated Na-Mt was washed with distilled water and dried at 70°C for 24 hours, and were designated as Mt-HDTA and Mt-TMPA.
Adsorbent Characterization
The surface area of the adsorbents were determined by Sear’s method [49] and cation exchange capacity (CEC) by the ammonium acetate procedure [50]. The morphological and X-ray diffraction properties of the adsorbents, as well as variation in functional groups were studied using scanning electron microscope (Leo 1455 VP), X-ray diffractometer (XRD-7000 Shimadzu) and Buck scientific M530 USA FTIR respectively. Detail of procedures employed in these characterization are available in our previously published work [40].
Adsorbate
Benzene (≥99%), toluene (99.5%), ethylbenzene (≥99%), and xylene (99.5%) were purchased from Sigma- Aldrich Chemical Company Switzerland. The BTEX standard solution (400 mg/L BTEX = 100 mg/L benzene + 100 mg/L toluene + 100 mg/L ethylbenzene + 100 mg/L xylene) was prepared in distilled water and kept at 40C. The stock solutions were further diluted by distilled water as working solutions.
Batch Adsorption Studies
Batch adsorption tests were carried out to assess the adsorption efficiency of the raw and surfactant modified clays (Mt, Mt-HDTMA, Mt-TMPA). All adsorption experiments were carried out at room temperature (250°C) with 100 mL of BTEX solution into a 200 mL conical flask (with air tight cape) and shaken at 250 rpm for 24 h. After this, the suspensions were centrifuged (6000 rpm for 15 min) and the clear supernatant was then measured for BTEX by Gas chromatography (Agilent GC, 6890N), equipped with mass spectrometer detector. Blank samples (BTEX solution without the adsorbent) were also used to determine the value of BTEX volatilization. The BTEX loss due to the volatilization was estimated in percentage. The experimental data were corrected to account for volatilize BTEX. The adsorption capacities of Mt, Mt-HDTMA and Mt-TMPA for BTEX uptake were determined using:

where qe(mg/g) is the adsorption capacity of the adsorbent, 𝐶o(mg/L) is the initial concentration of the adsorbate, 𝐶𝑒 (mg/L) is the equilibrium concentration of the adsorbate in the solution, 𝑚(g) is the mass of the adsorbent, and 𝑉(L) is the volume of the solution. The effect of contact time on the adsorption of BTEX by Mt, Mt-HDTMA, Mt-TMPA, was carried out, using 100 mL of a solution containing 0.5 g adsorbent and 50 mg/L BTEX solution (Benzene 10 mg/l, Toluene 10mg/l, Ethylbenzene 10 mg/l and Xylene 20 mg/l) at various contact times of 10, 20, 40, 60, 100 and 120 mins. In many industrial wastewaters the concentration of BTEX varies between 20 to 200 mg/L [51]. Hence, the effect of initial BTEX concentrations of 50, 100, 125, 150, and 200 mg/L on the adsorption efficiency was evaluated at optimum contact time and pH at 250°C.
Results and Disscussion
Surface Characterization
Results of the experiments and analyses representing the chemical composition of raw adsorbents montmorillonite (Mt), and results for specific surface area and cation exchange capacity (CEC) of montmorillonite (Mt); HDTMA modified Montmorillonite (Mt-HDTMA); TMPA modified montmorillonite (Mt-TMPA) are represented in (Tables 1 & 2) respectively3.1.1. Surface
Area Determination and CEC Measurements
(Table 2). show the values for surface areas for montmorillonite (Mt), HDTMA modified montmorillonite (Mt-HDTMA), TMPA modified montmorillonite (Mt-TMPA). The modification of the adsorbents by Haxadecyltrimethylanonium bromide and Trimethylphenylamonium chloride led to reduction of surface areas for modified montmorrilonite from 39.1 m2/g for Mt to 29.4 m2/g and 24.87m2/g for Mt HDTMA and Mt-TMPA respectively. These values for surface areas are in line with that obtained for raw and TTAB modified Montmorillonite clay by Nourmoradi et al. [33]. From the values obtained for CEC of montmorillonite (Mt), HDTMA modified montmorillonite (Mt-HDTMA), TMPA modified montmorillonite (Mt-TMPA), an increase in cation exchange capacity (CEC) from 78.51 meq/100g for Mt to 95.48meq/100g respectively was observed, corresponding to the values obtained by Nourmoradi et al [33]. Due to the favorable interlayer microenvironment created by the long chain alkyl ammonium ions for the partitioning of organic molecules, the size of the alkyl chain and the charge density of the clay layer are responsible for the arrangement of the intercalated cations corresponding to increase in the clay cation exchange capacity.
Table 2: Values for cation exchange capacity and specific surface area of montmorillonite (Mt); HDTMA modified Montmorillonite (Mt-HDTMA) and TMPA modified montmorillonite (Mt-TMPA).
FT-IR Spectroscopy
(Figure 1) represents FT-IR spectra of the adsorbents. FTIR spectroscopy has significantly contributed to the understanding of the structure, bonding, and reactivity of clay minerals [52]. FTIR spectra reveals the specific functional groups on montmorillonite and organoclay surface qualitatively based on the characteristics absorbed energy for each bonds in certain groups [53]. The examination of the IR spectra in the range 4000-400 cm-1 provides information on fundamental vibrational modes of the constituent units of these materials [54]. OH, stretching and bending occur in the spectral region of 3750-3500 and 950-600 cm-1 respectively. Si-O and Al-O stretching modes are found in the 1200-700 cm-1 range while Si-O and Al-O bending modes dominate in the 600-400 cm-1 region [55]. IR spectra peak for unmodified montmorillonite clay indicates that the -OH bending band at 850.63cm-1 respectively were readily assigned to Al-OH.
The position and the shape of the -OH stretching band in the IR spectra of montmorillonite is basically influenced by the nature of the octahedral atoms to which the hydroxyl groups are contained [54,56]. The strong band located at 1157.6 cm-1 was the Si-O stretching vibrations, indicating that Si-O-Al and Si-O-Si bending vibrations respectively were typical of the tetrahedral Si-O. Bands at 3249.37cm-1, 1612.6cm-1 are attributed to the OH stretching and bending vibrations of molecular water respectively. The quantity of adsorbed water in the clay is attributed to the deformation vibration of the H-O-H group (around 1631 cm-1). Bands at around 1612.69cm-1 for montmorillonite (Mt) is a consequence of Si-O valence vibrations.
The addition of organic modifier-HDTMA and TMPA (Figure 1) increased the intensity at around 2898.3cm-1, 2796.3cm-1 and 2840.53cm-1, 3235.31cm-1 for HDTMA modified montmorillonite (Mt-HDTMA) and TMPA modified montmorillonite (Mt-TMPA) respectively. The absorption band at around 2898.3cm-1, 2796.3cm-1 and 2840.53cm-1, 3235.31cm-1 for HDTMA modified montmorillonite (Mt-HDTMA) and TMPA modified montmorillonite (Mt-TMPA) respectively corresponds to asymmetric and symmetric stretching methylene (CH2) bond [54,57]. Also, a bending vibration of the methylene groups can be seen at bands of 1613cm-1 for montmorillonite (Mt), verifying the intercalation of surfactant molecules between the silica and layers [54,58]. The change of the percentages of clay in the composite does not strongly affect the intensity of the remaining vibrational bands.
Figure 1: FT-IR Spectra of montmorillonite (Mt); HDTMA modified Montmorillonite (Mt-HDTMA) and TMPA modified montmorillonite (Mt-TMPA).
The AI-AI-OH stretching band typically occurs at 3620-3630 cm-1, the AI-Mg-OH stretching band at 3695 cm-1 and the A1-Fe3+- OH band at 3599 cm-1. The frequency of maximum absorption thus indicates that the montmorillonite is Al-rich. The broadness of the band is due to the contribution of Mg and Fe in octahedral sheets and might also indicate, that the momtmorillonite structure is poorly ordered. The OH vibrations are better resolved in the bending frequencies as compared to the stretching frequencies. Other bands in the 1149-600 cm-1 region are the Si-O stretching bands at around 1149 cm-1 (in-plane) and 914 cm-1 (out-of-plane), the Al-O+Si-O outof- plane vibration at 690.2 cm-1 for montmorillonite (Mt). Analysis of IR spectra confirmed that the organic modifiers-HDTMABr and TMPACl are strongly associated with montmorillonite when put in its interlayer space and this equally leads to the formation of a new composite, which, because of the different structure relative to the clays and the monomers, will have different properties [54,59,60]
Scanning Electron Microscopy (SEM)
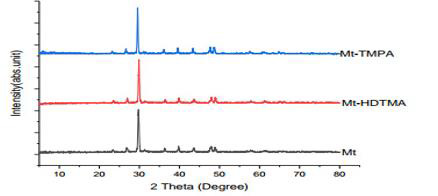
The SEM images of montmorillonite (Mt), HDTMA modified montmorillonite (Mt-HDTMA), TMPA modified montmorillonite (Mt-TMPA) are presented in (Figure 2) (a-c). The surface structure of the adsorbent is changed by the modification with HDTMA and TMPA. It can be seen that the surface textures of montmorillonite (Mt) are rough with irregular shapes. However, the surface morphologies of HDTMA modified montmorillonite (Mt-HDTMA) and TMPA modified montmorillonite (Mt-TMPA) are smoother than montmorillonite (Mt). This is due to the fact that the porous surfaces of montmorillonite is filled with surfactant. Similar results have been reported by Aivalioti et al [61]. Nourmoradi et al [33]. and Onwuka et al., [40]. The combined XRD patterns of montmorillonite (Mt), HDTMA modified montmorillonite (Mt- HDTMA), TMPA modified montmorillonite (Mt-TMPA) samples are shown in (Figure 3).
Figure 3: Combined XRD pattern for montmorillonite (Mt); HDTMA modified Montmorillonite (Mt-HDTMA) and TMPA modified montmorillonite (Mt-TMPA).
The XRD basal spacing (𝑑001) of Mt, Mt-HDTMA, Mt- TMPA, Bt, Bt-HDTMA and Bt-TMPA were found to be 12.004Å, 16.780Å,15.834Å respectively. Moreover, increasing the reflection intensity from 2.52% for Mt to 100% for both Mt-HDTMA and Mt-TMPA respectively showed that the surfactant modification has led to structural changes in Mt. The interlamellar expansion in the modified adsorbent is attributed to the penetration of haxadecyltrimethylanonium cation and trimethylphenylamonium cation into the layers of Mt. The values of basal spacing obtained are in agreement with that reported in the literature [62]. The cation exchange reactions have been traditionally exploited as an effective method to replace inorganic ions with organic cationic surfactant molecules which intercalate into the clay gallery, resulting in expansion of the interlayer spacing thereby leading to an increase in the basal spacing [63-66].
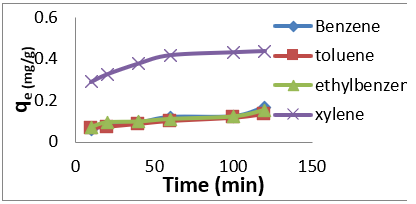
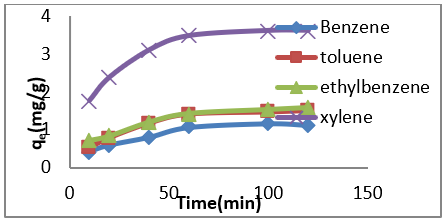
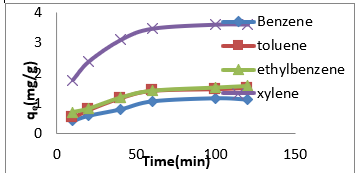
The adsorption data for BTEX uptake by montmorillonite (Mt), HDTMA modified montmorillonite (Mt-HDTMA), TMPA modified montmorillonite (Mt-TMPA) are presented in (Figures 4-6) respectively. The adsorption capacity of BTEX using modified adsorbent has been rapidly increased at the beginning of contact time which could be due to the availability of more adsorption sites [33,40,66]. Then the adsorption capacity increases slowly up to about up to 120 mins. The adsorption capacities of Mt, Mt-HDTMA and Mt-TMPA at the first 60mins of the adsorption was determined to be 0.12 mg/g, 0.10 mg/g, 0.11 mg/g, 0.418 mg/g; 1.208 mg/g, 1.396 mg/g, 1.596 mg/g 3.768 mg/g; 1.066 mg/g, 1.412 mg/g, 1.426 mg/g, 3.478 mg/g for benzene, toluene, ethylbenzene, and xylene, respectively. But the corresponding adsorption capacity at the equilibrium time was estimated to be 0.168 mg/g, 0.144 mg/g, 0.352 mg/g, 0.438 mg/g; 1.228 mg/g, 1.462 mg/g, 2.132 mg/g, 4.504 mg/g; 1.724 mg/g, 1.506 mg/g, 2.584 mg/g, 4.618 mg/g.
Figure 4: Effect of contact time on the adsorption of BTEX using Mt (BTEX solution = 50mg/L, initial pH= 7±0.5, contact time = 2hours, Mt = 0.5g).
Figure 5: Effect of contact time on the removal of BTEX using Mt-HDTMA ( BTEX solution = 50mg/L, initial pH= 7±0.5, contact time = 2hours, Mt-HDTMA = 0.5g).
Figure 6: Effect of contact time on the adsorption of BTEX using Mt-TMPA (BTEX solution = 50mg/L, initial pH= 7±0.5, contact time = 2hours, Mt-TMPA =0.5g).
The order of the sorption capacities of the modified adsorbents are B
Table 3: Comparison of BTEX removal of aqueous solution by adsorbent used in this study to those of other studies.
Effect of Initial BTEX Concentration:
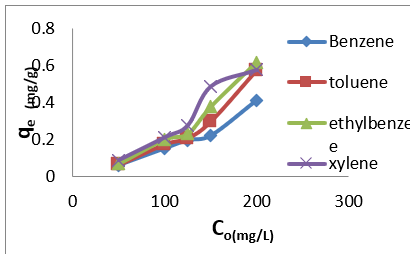
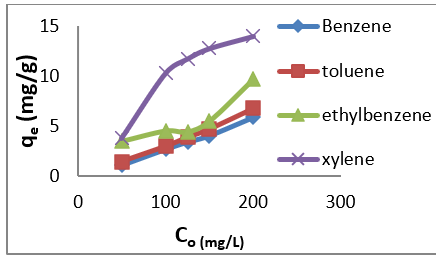
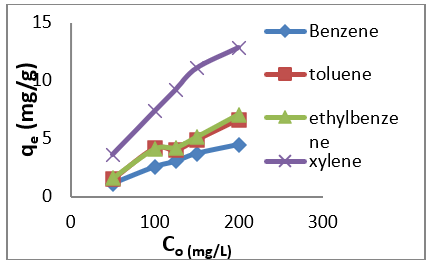
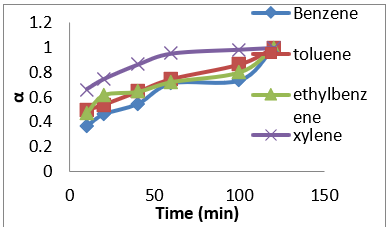
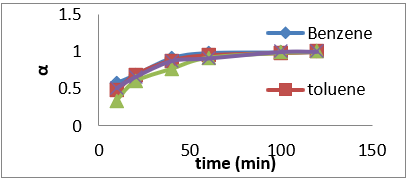
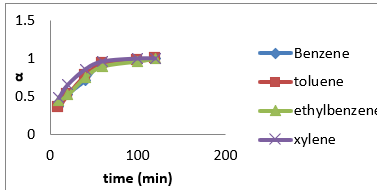
(Figures 7-9) shows the influences of initial BTEX concentrations between 50 and 200 mg/L on the sorption using montmorillonite (Mt), HDTMA modified montmorillonite (Mt-HDTMA), TMPA modified montmorillonite (Mt-TMPA) at initial pH of 7 ± 0.5 for 120 minutes. Based on the results, the initial concentration of BTEX has substantial role on the adsorption capacity. As seen, the adsorption capacities of the sorbents were increased by increasing BTEX concentration in the solution [69]. This may be due to an increase in driving forces affecting BTEX compounds. One of these forces is van der adsorbed at infinity. The plot of the fractional attainment to equilibrium (FATE) is shown in (Figures 10-12) for montmorillonite (Mt), HDTMA modified montmorillonite (Mt- HDTMA), TMPA modified montmorillonite (Mt-TMPA), 3.5.3. Intra- Particulate Diffusivity
The intraparticulate diffusivity was estimated using equation (2) which was developed using the linear driving force concept [70].

where α is the fractional attainment to equilibrium (FATE) given by equation (3), Kp is the rate constant for intraparticulate diffusivity

Figure 7: Effect of contact time on the removal of BTEX using Mt-HDTMA ( BTEX solution = 50mg/L, initial pH= 7±0.5, contact time = 2hours, Mt-HDTMA = 0.5g).
Figure 8: Effect of BTEX concentration on adsorption by Mt-HDTMA (Initial pH= 7± 0.5, contact time= 2 hours and Mt- HDTMA conc= 5g/L).
Figure 9: Effect of BTEX concentration on adsorption by Mt-TMPA (Initial pH= 7± 0.5, contact time= 2 hours and Mt-TMPA conc= 5g/L).
Figure 10: Fractional attainment to equilibrium (FATE) alpha against Time (min) for BTEX adsorption on Mt (BTEX conc = 50mg/L).
Figure 11: Fractional attainment to equilibrium (FATE) alpha against Time (min) for BTEX adsorption on Mt-HDTMA (BTEX conc = 50mg/L).
Figure 12: Fractional attainment to equilibrium (FATE) alpha against Time (min) for BTEX adsorption on Mt-TMPA (BTEX conc = 50mg/L).
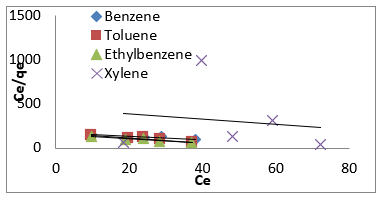
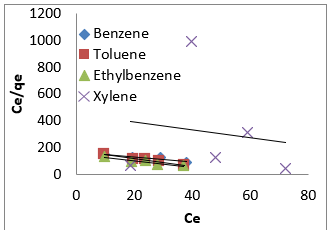
where [M]t represents amount of BTEX adsorbed at time t and [M] the amount of BTEX 3.6. Adsorption Isotherm. Adsorption isotherm is one of the most important parameters to find the adsorption mechanism necessary for designing any sorption system [71]. It could be regarded as a graphical expression which described the amount or the quantity of the adsorbate that has been adsorbed onto the surface of the adsorbent at a particular operating condition [72]. Adsorption isotherms are precisely used to ascertain whether the adsorbent could be efficiently exploited for the removal of the adsorbate molecule from several solutions [73]. The use of adsorption isotherm model helps one to understand the process of adsorption [74]. The two widely used adsorption isotherm models include; Langmuir and Freundlich adsorption isotherm models. [33,74,75]. The Langmuir Isotherm model is a mathematical isotherm model, which is being obtained from theoretical approach or non experimental analysis and also has a constant referred to as Langmuir constant. The Langmuir isotherm model assumes that the adsorption of adsorbate molecule can only occur at a homogeneous site of the adsorbent and when this happen, no other adsorption will take place on the adsorbent surface [33, 73-75]. This isotherm model [40] in linear form is given as:

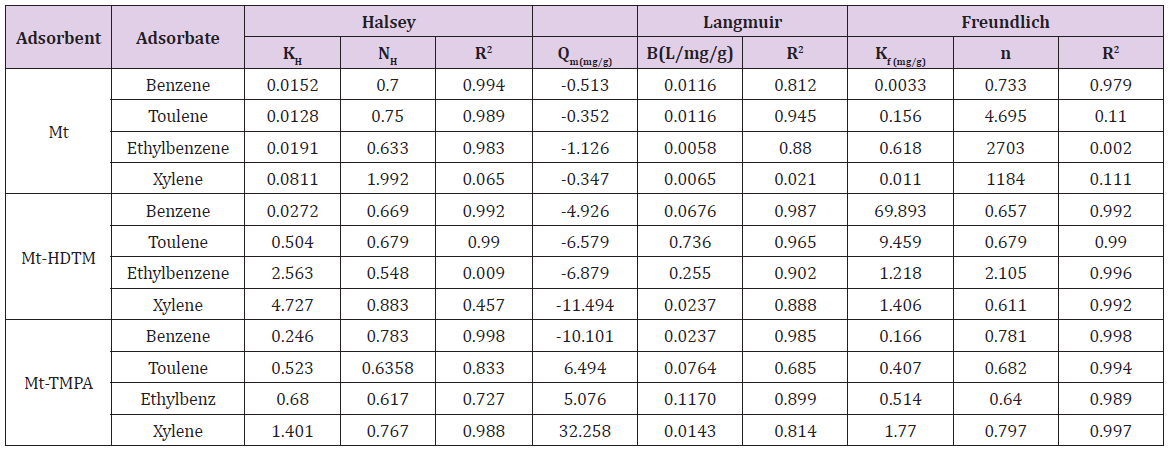
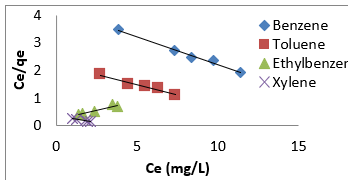
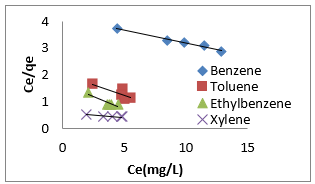
where 𝐶𝑒(mg/L) and 𝑞𝑒(mg/g) are the concentration of adsorbate and the adsorption capacity of the adsorbent at the equilibrium time, respectively. 𝑏(L/mg) is the Langmuir constant and 𝑄𝑚(mg/g) is maximum adsorbent capacity. 𝑄𝑚 and 𝑏 are attained by the slope and intercept of 𝐶𝑒/𝑞𝑒 versus 𝐶𝑒, respectively. The values of the Langmuir isotherm parameters are shown in (Table 4a). Lngmuir isotherm rather fitted poorly to the experimental data. Similar result was obtained by Nourmoradi et al. [33]; Onwuka et al [40].
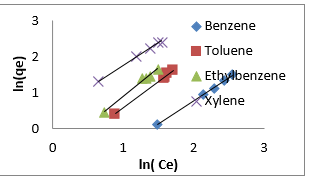
Freundlich isotherm model is an empirical adsorption isotherm model which explains the equilibrium relationships existing between the adsorbate and the adsorbent molecules and assumes multi layer adsorption on the adsorbent heterogeneous site. The Freundlich isotherm model [73,75,76] is given as;

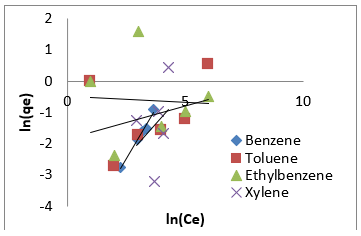
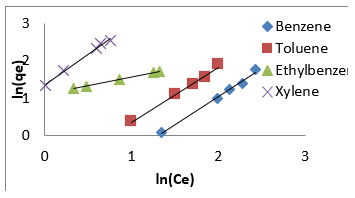
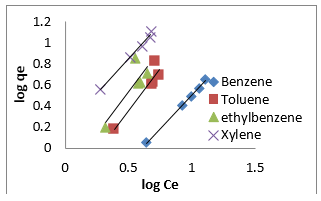
qe and Ce are the adsorption capacity (mg/g) and the concentration (mg/L) of the adsorbate at equilibrium. The values of 1/n and kf are gotten from the linear plot of Inqe against In Ce. 1/n is the slope of the graph while kf is the intercept on y-axis, which are the Freundlich constant relating to heterogeneity of the adsorbent surface and adsorption capacity respectively [75]. The Freundlich isotherm parameters and its correlation coefficient (𝑅2) for BTEX adsorption by Mt-HDTMA and Mt-TMPA are exhibited in (Table 4a). The results show that Freundlich isotherm model fits well to the experimental data. Many researchers have shown that sorption of BTEX from aqueous solutions with different adsorbents is described well by Freundlich isotherm model [23,26,33,40,51,61]. The adsorption bond between adsorbent and adsorbate would be relatively strong if the 𝑛value, obtained from Freundlich isotherm model, is greater than one [76].
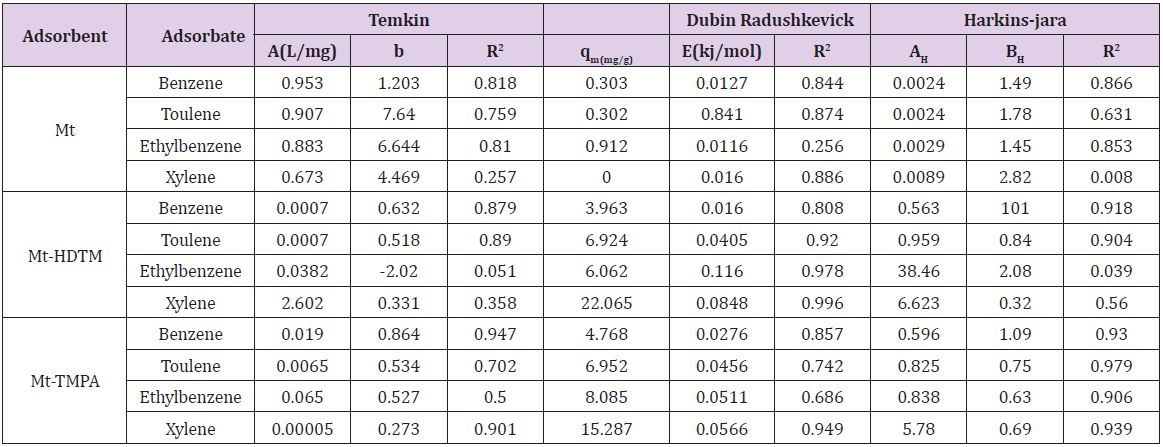
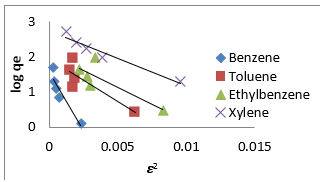
Therefore, the 𝑛values of 2.61 to 1.66 for Mt-HDTMA and 3.80 to 1.78 for Mt-TMPA obtained by this isotherm model showed that BTEX is suitably adsorbed by Mt-HDTMA, Mt-TMPA, compared to Mt whose values are inconsistent with some values less than 1, indicating weak adsorption bonds between adsorbents and adsorbates. Nourmoradi et al [33] and Sharmasarkar et al [25]. reported that the 𝑛 values for the removal of BTEX via the cationic modified clays (TTAB-Mt) and (TMPA-SWy and Adam-SWy) were in range of 1.04 to 1.55 and 1.59 to 1.88 respectively . The Dubinin- Radushkevich isotherm (𝐷-𝑅) model has been used to determine the type of adsorption process as physical, chemical adsorption or ion exchange [33,77]. The linear form of the 𝐷-𝑅isotherm model can be shown as:

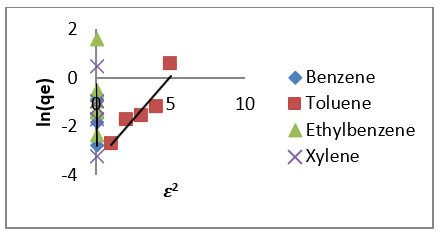
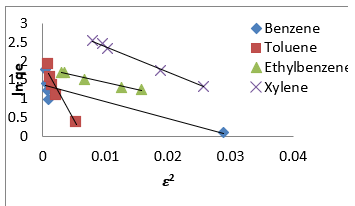
where, 𝑞𝑚(mg/g) is the theoretical sorption capacity based on the isotherm, 𝛽(kJ/mol) is related to mean adsorption energy and 𝜀 (Polanyi Potential) is equal to 𝑅T ln (1 + 1/Ce). 𝑅(kJ/mol-K) is the universal gas constant and (K) is temperature [77]. From (Figures 13, 14 & 15) 𝑞𝑚 and 𝛽 are obtained from the intercept and slope ln 𝑞𝑒versus 𝜀 2, respectively. 𝐸(kJ/mol) is the mean adsorption energy that is illustrated by equation (7):

The type of adsorption process is specified by the 𝐸value as follow: The physical and chemical adsorptions occurs if E < 8 kJ/ mol or E ˃ 16 kJ/mol, respectively. But the chemical ion exchange occurs for 𝐸in the 8–16 kJ/mol [78]. The values of parameters for 𝐷-𝑅 isotherm model for adsorption of BTEX by Mt, Mt-HDTMA, Mt- TMPA, are presented in (Table 4b). As seen, the adsorption of BTEX through Mt, Mt-HDTMA and Mt-TMPA, has occurred for 𝐸values in the range of 0.023 -0.11, 0.041-0.12, 0.028-0.057 kJ/mol for Mt, Mt-HDTMA and Mt-TMPA, respectively. Hence, the removal of BTEX in the solution by Mt, Mt-HDTMA and Mt-TMPA is governed by the physical adsorption.
Table 4b: Parameter for Temkin,Dubin Radushkevick and Harkins- jara isoterms for the adsorption of BTEX.
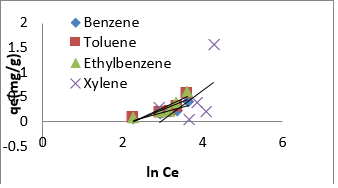
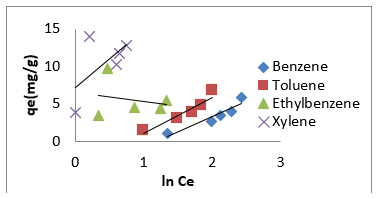
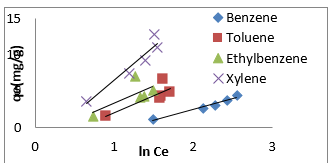
The Temkin model takes into account the effects of indirect adsorbate-adsorbate interactions on the adsorption isotherm and the heat of adsorption tends to decrease with increasing coverage due to these interactions [35,79]. The derivation of the Temkin model is based on the assumption that the decrease of the heat of adsorption with temperature is linear rather than logarithmic as implied by the Freundlich equation. The linear form of the Temkin model is given by Eq. (8).

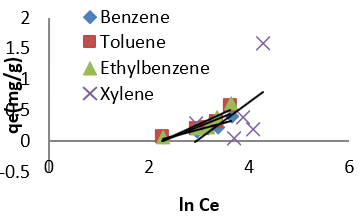
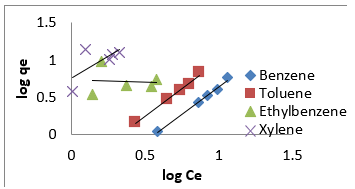
where A (L.mg-1) and b are Temkin isotherm constants, R = 0.0083kJmol-1 K-1 and T is temperature (K) of the experiment. A plot of 𝑞𝑒 versus 𝐼𝑛𝐶𝑒 is linear and the Temkin constants determined from the slope and intercept. From (Figures 16,17 & 18) it can be seen that the Temkin isotherm fitted rather poorly to the experimental data. Similar result was also obtained by Egbuchunam et al [79]. Halsey isotherm describes condensation of a multilayer at a relatively large distance from the surface [80]. This equations are suitable for multilayer adsorption and the poor fitting of the experimental data to this equation attest to the nonheteroporous nature of Mt, Mt-HDTMA and Mt-TMPA [81].The Linear form of this equation is given as follow:

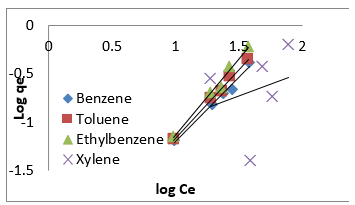
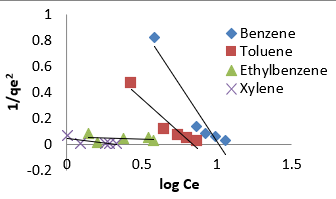
The Halsey isotherm parameters are obtained from the plot of logqe versus log Ce. Where nH and KH are isotherm constants. (Figures 19, 20 & 21) shows linear Halsey isotherms graph. The constants and correlation coefficients of the related equation are listed in (Table 4a). The fitting of the Halsey isotherm equation was very low R2 =0 in some cases, suggesting non-heteroporosity of the adsorbents [82].
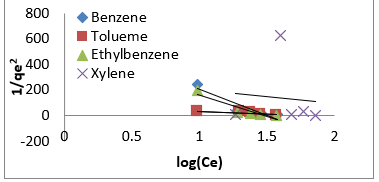
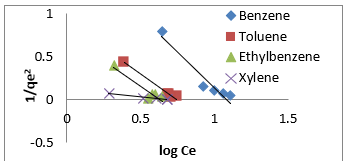
The Harkins-Jura adsorption isotherm accounts to multilayer adsorption and can be explained with the existence of heterogeneous pore distribution. The linear form of Harkins-Jura adsorption isotherm can be expressed as

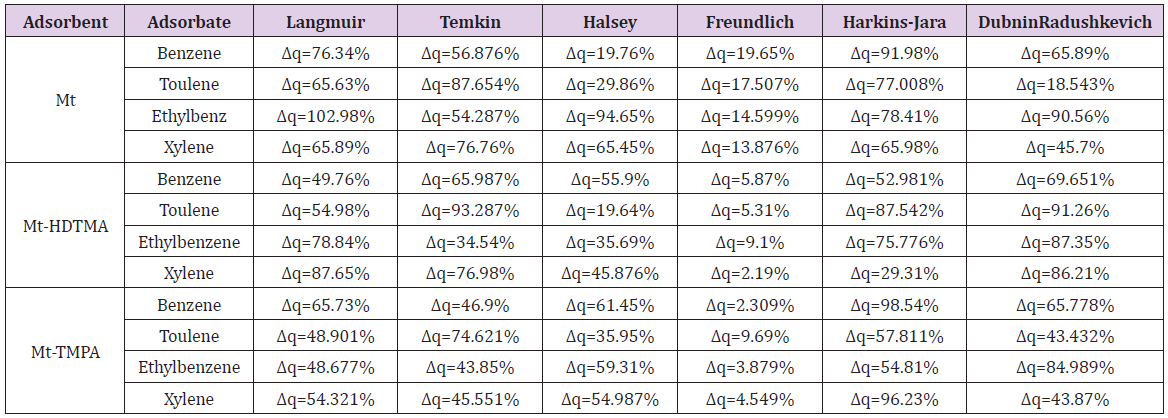
AHJ is Harkins-Jura isotherm parameter which accounts for multilayer adsorption and explains the existence of heterogeneous pore distribution, BHJ is the isotherm constants (Ali et al., 2017). The Harkins-Jura isotherm models for BTEX adsorption onto Mt, Mt- HDTMA and Mt-TMPA are presented in (Figures 22, 23, 24) and the relevant isotherm parameters (Table 4b) shows that the low values of R2 reveals the unlikelihood of the existence of heterogeneous pore distribution in Mt, Mt-HDTMA and Mt-TMPA. 3.6.1 Statistical Validation of Isotherm Model Percentage (%) residual error analysis was carried out to determine the best fitness, suitability and agreement of isotherm models and this was done using normalized standard deviation Δq (%) of root mean square residual error to compare the validity of each of the isotherm models more efficiently [83]. This is according to the relation.

The qeexpand qecal are the experimental and calculated values respectively and n is the number of measurements. The values of Δq are also given in (Table 5). It can been seen that the lowest values obtained for benzene, toluene, ethylbenzene and xylene for modified clays were in the range of Δq=2.19% to Δq=9.69% for Freundlich isotherm, and the highest value 102.98% was obtained for ethylbenzene for Langmuir isotherm (for Mt).Therefore, the Freundlich isotherm model was considered to describe the satisfactory fit with the sorption process since the value of Δq(%) is less than <10% [40]. Similar results was obtained by 40,82,83].
Adsorption Kinetics
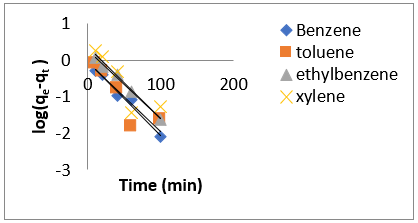
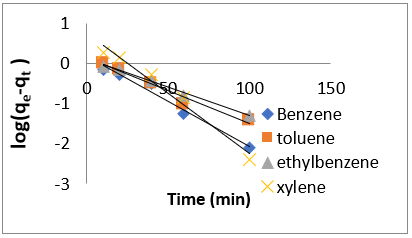
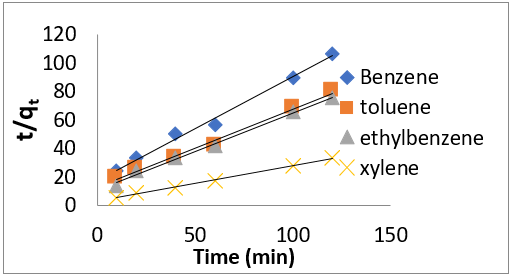
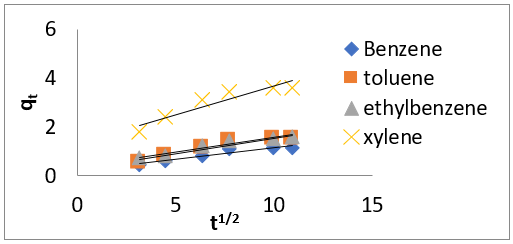
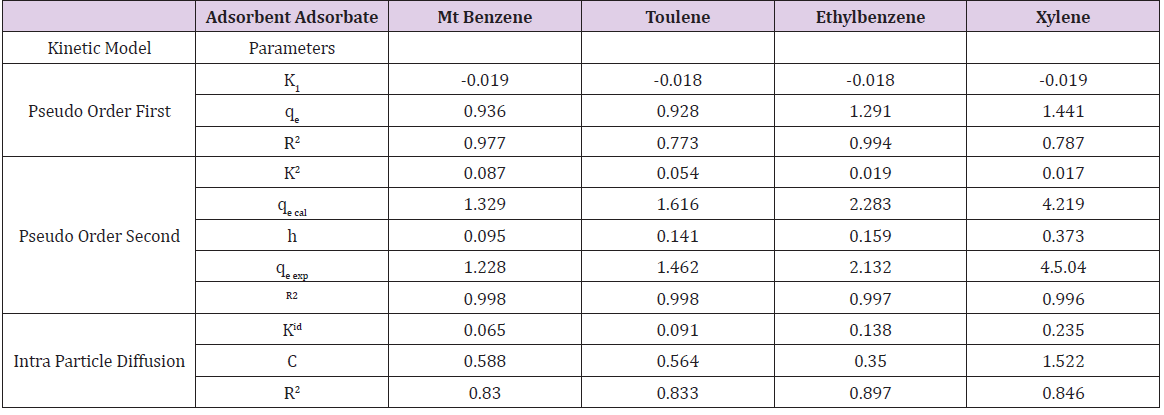
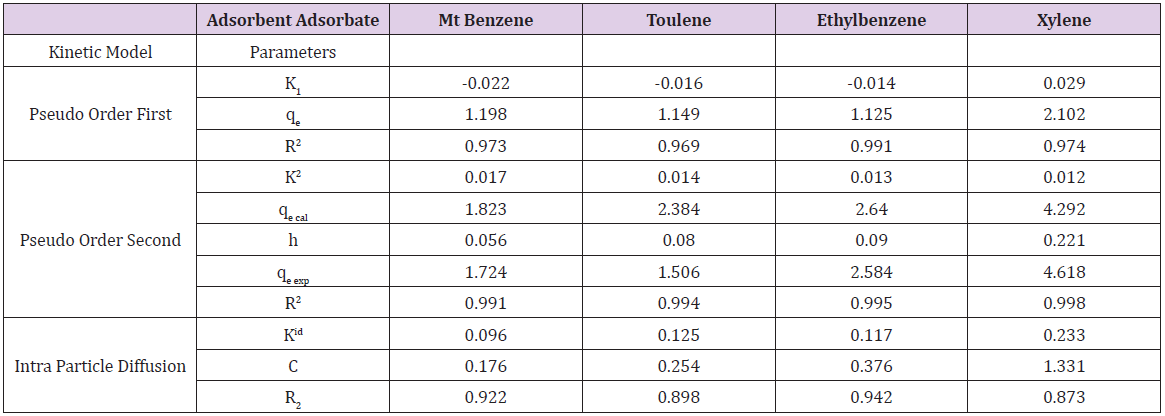
Adsorption kinetics is one of the most important parameters for determining the adsorption mechanism and also to investigate the efficacy of adsorbent for the removal of pollutants [33]. In this study, three kinetic models; pseudo-first-order, pseudo-secondorder, and intra-particle diffusion models, were used to predict the sorption behavior of the data (Figures 25-38). below, represents various plots for these adsorption kinetic models. The pseudofirst- order kinetic model known as the Lagergren equation [49] is defined as

where 𝑞𝑒 is the amount of BTEX adsorbed at equilibrium (mg/g), 𝑞𝑡 amount of BTEX adsorbed at any given time t (mg/g), k is the rate constant for the pseudo-first-order model. A plot of 𝑙𝑜(𝑞𝑒− 𝑞𝑡) against The pseudo-second-order model was also fitted to the adsorption data using the following equation [84]:

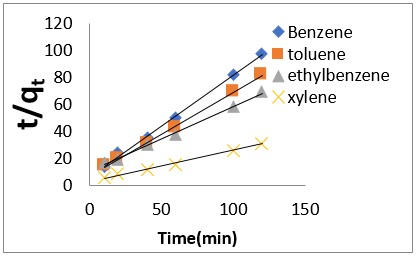
where q𝑒 and 𝑞𝑡 are the same as for the pseudo-first-order parameters. 𝑘2 (g/mg-h) is the rate constant of pseudo-second order. In (Figure 39) 𝑘2 and 𝑞𝑒 values were obtained from the intercept and slope of linear plot of 𝑡/qt against 𝑡, respectively [33]. At initial stage of the adsorption process (𝑡∽0), the initial adsorption rate, h (g/mg -h), is obtained from;

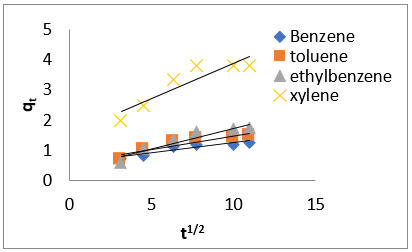
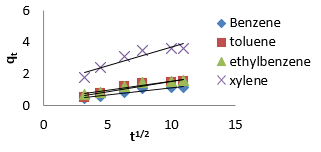
The intra-particle diffusion kinetic model is mathematically described by the following equation [33]:

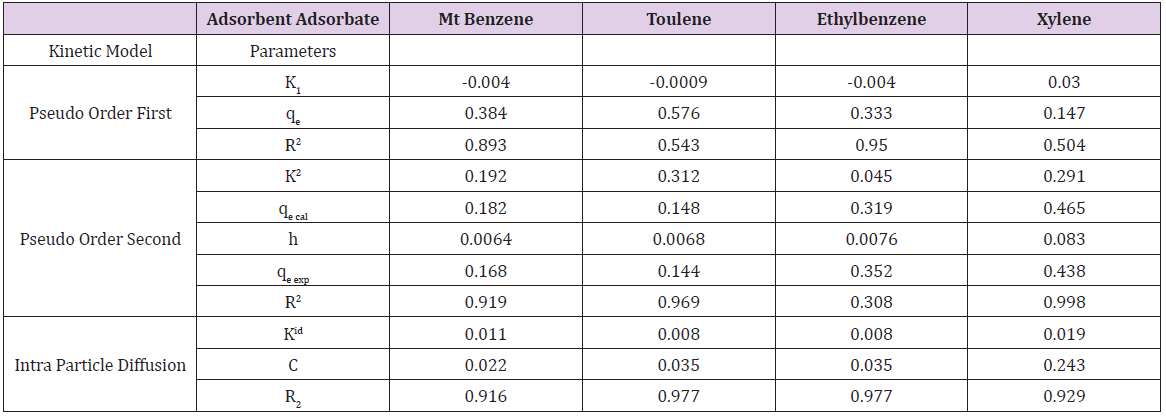
where 𝑘id(g/mg-h) is the rate of the intraparticle diffusion kinetic model [51]. 𝑘idand 𝐶are obtained from the slope and intercept of 𝑞𝑡versus 𝑡 1/2, respectively. (Figures 40 & 41) show plots of pseudo-second-order kinetic model for the adsorption of BTEX with Mt, Mt-HDTMA and Mt- TMPA. As can be seen from the correlation coefficient (𝑅2), the pseudo-second-order kinetic model fits to the experimental data better than the other kinetic models (Figure 39). Moreover, the 𝑞e,calculated (mg/g) achieved using the pseudo-second-order kinetic model is rationally similar to the 𝑞𝑒,experimental (mg/g) obtained from the experimental data. On the other hand, the pseudo-first-order and intra-particle diffusion models, because of the differences between calculated 𝑞𝑒 from the models and experimental 𝑞𝑒, do not suitably predict BTEX sorption by the adsorbent. Aivalioti et al [61]. and Nourmoradi et al [33]. reported that sorption of BTEX with raw and thermally modified diatomite, and raw and TTAB modified montmorillonite respectively were described well by the pseudo-second-order kinetic model [33,61]. The parameters for pseudo-second- order kinetic model are listed in (Table 6) for Mt, Mt-HDTMA, Mt-TMPA. As seen, the values of the rate constant for pseudo-second-order kinetic models, 𝑘2(g/mg.h), follow the order of B >T >E >X, while the initial adsorption rate constant values of this kinetic model, h (g/mg - h), are shown to have the order of B
Table 6a: Parameters of pseudo-first order, Pseudo Order Second, Intra Particle Diffusion Kinetic models Obtained from Mt Adsorption Data.
Table 6b: Parameters of pseudo-first order, Pseudo Order Second, IntObtained from Mt-HDTMA Adsorption Data.
Table 6c: Parameters of pseudo-first order, Pseudo Order Second, Intra Particle Diffusion Kinetic models Obtained from Mt-TPMA Adsorption Data.
The reason for this (the order of h value) may be due to availability of more adsorption sites of the adsorbent at the beginning of the sorption process [33,67]. Hence, the lower hydrophilic compounds such as xylene and ethylbenzene have a higher tendency to the adsorbent, especially at the start of the adsorption process [85]. But as the time elapsed, the order of 𝑘2 value has a reverse relation with the order of h value. This may be attributed to the molecular weight of BTEX [86]. Due to lower molecular weight [33], benzene and then toluene can better penetrate onto the internal adsorption sites of the adsorbent as in comparison to higher-molecular weight compounds such as ethylbenzene and xylene.
Conclusion
Organophilicization of montmorillonite clay was achieved via intercalation mechanism involving the exchange of montmorillonite’s surface cations with those of HDTMA and TMPA cationic surfactants. The modification enhanced the adsorption capacity of the new organoclay adsorbents for BTEX removal. The adsorption capacities of the synthesized organoclays for adsorption of BTEX was influenced by contact time and initial BTEX concentration. Freundlich isotherm and Pseudo second order kinetic models were best fits to sorption data. However, the adsorption capacities of the synthesized organoclays (Mt-HDTMA and Mt-TMPA) found to be 7-10 times greater than un-modified montmorillonite (Mt) confirms that the synthesized organoclays are promising and suitable for hydrophobic sorption.
For more Articles on: https://biomedres01.blogspot.com/




No comments:
Post a Comment
Note: Only a member of this blog may post a comment.